Nifty Spot Weekly Profile (20th to 24th Jan 2020)
Spot Weekly 12248 [ 12430/ 12087 ]
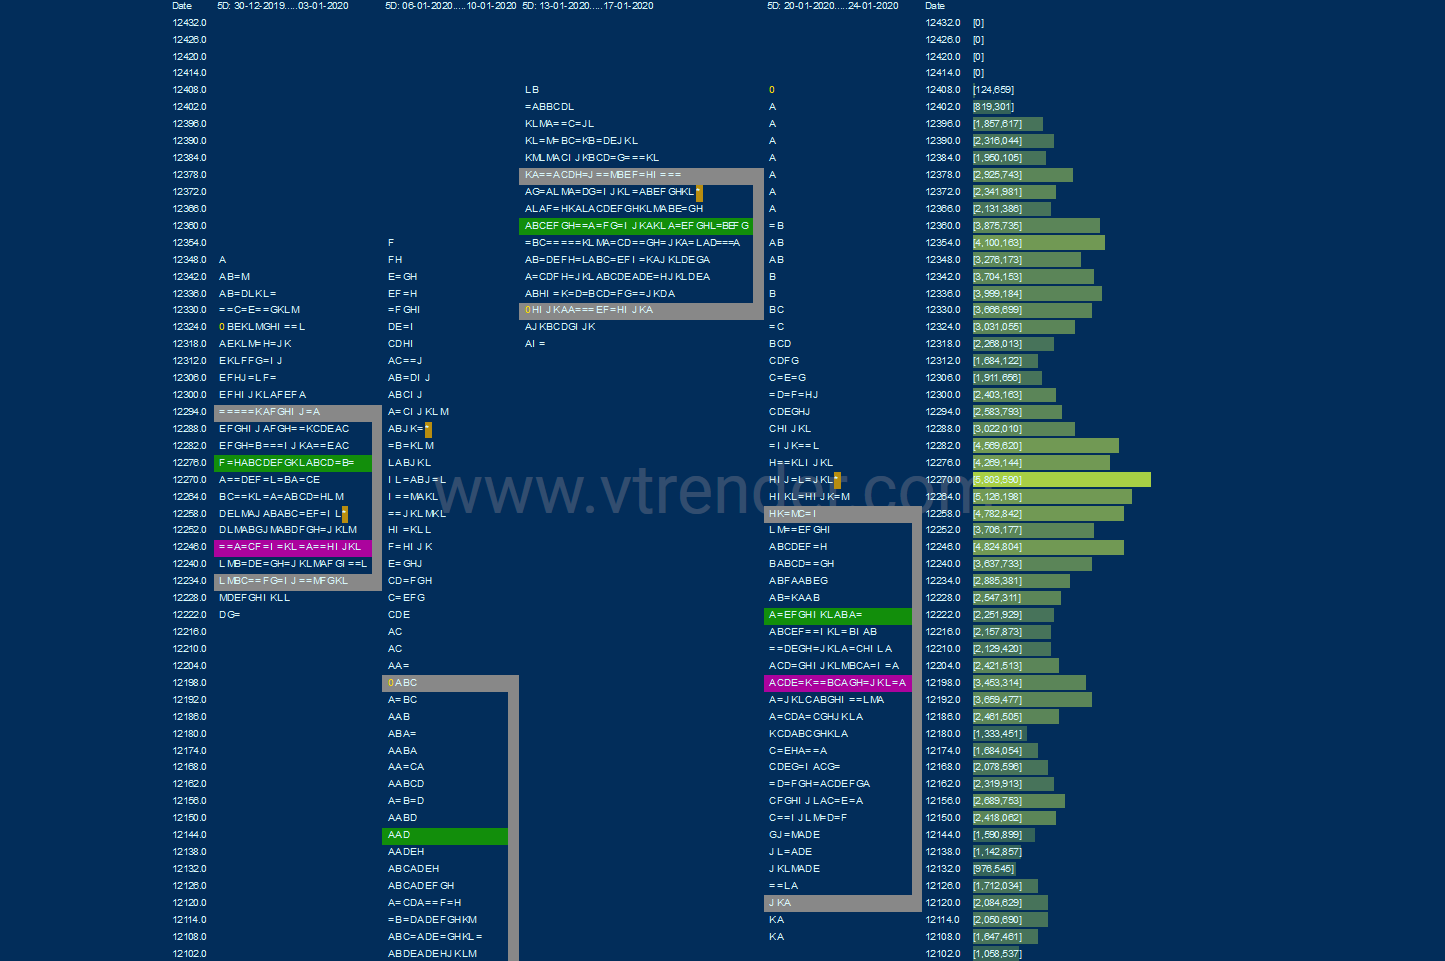
Last week Nifty had recorded not just the highest ever weekly close but also the narrowest range of just 110 points in over 2 years forming a nice Gaussian profile and this balance called for an imbalance to follow.
Nifty opened this week with a huge gap up making new all time highs of 12430 but was also an OH start (Open=High) as it turned out to be a freak tick after which it got back into the previous week’s range and the well balanced Value Area triggering the 80% Rule which it promptly completed in the IB (Initial Balance) itself where it left a selling tail exactly as the gap up zone from 12354 to 12430 along with an extension handle at 12340. The auction continued to probe lower giving multiple REs (Range Extension) as it left a Trend Day Down breaking below previous week’s low making lows of 12217 and leaving a huge daily range of 214 points almost doubling the previous week’s range in a single day. This imbalance led to a balance being formed on Tuesday as Nifty stayed mostly below the PDL (Previous Day Low) after being rejected as it made a high of 12230 making a narrow range of just 68 points as it made lows of 12162. Nifty then opened higher on Wednesday but got rejected once again from the attempt to get into Monday’s range making a lower high of 12225 and this rejection led to a fresh OTF (One Time Frame) move down as the auction made new lows for the week and got into the buying tail of 12132 to 12025 from 9th Jan which was the start of the new IPM (Initial Price Movement) to take support at 12087 as it left a small buying tail at lows. Thursday made an inside bar but more importantly left a ‘p’ shape profile indicating that the shorts were covering and more confirmation of this came on Friday as Nifty gave an initiative move higher in the ‘A’ period leaving a buying tail in previous day’s Value as it finally got accepted in Monday’s range & Value to form yet another ‘p’ shape profile on the daily but could not tag the VPOC of 12295 and stalled at monthly VAH of 12270 indicating that the sellers were coming back in this zone as the auction closed at 12248 leaving a ‘b’ shape profile on the weekly which indicates long liquidation on a larger timeframe. Value for the week was completely lower at 12134-12166-12268 and the inability of the auction to sustain above 12270 in the coming week could lead to a test of 12166-133.
Weekly Hypos for Nifty (Spot):
A) Nifty needs to sustain above 12266-270 for a move to 12295*-300 / 12321-340 & 12377
B) Immediate support is at 12243-230 below which the auction could test 12210-200 & 12166-156
C) Above 12377, Nifty can probe higher to 12400-430 & 12458-485
D) Below 12156, lower levels of 12133 / 12109-100 & 12070-045 could come into play
E) If 12485 is taken out, Nifty can have a fresh leg up to 12517-524 / 12545 & 12576
F) Break of 12045 could bring lower levels of 11994* & 11955-936
NF (Weekly Profile)
12271 [ 12419 / 12110 ]
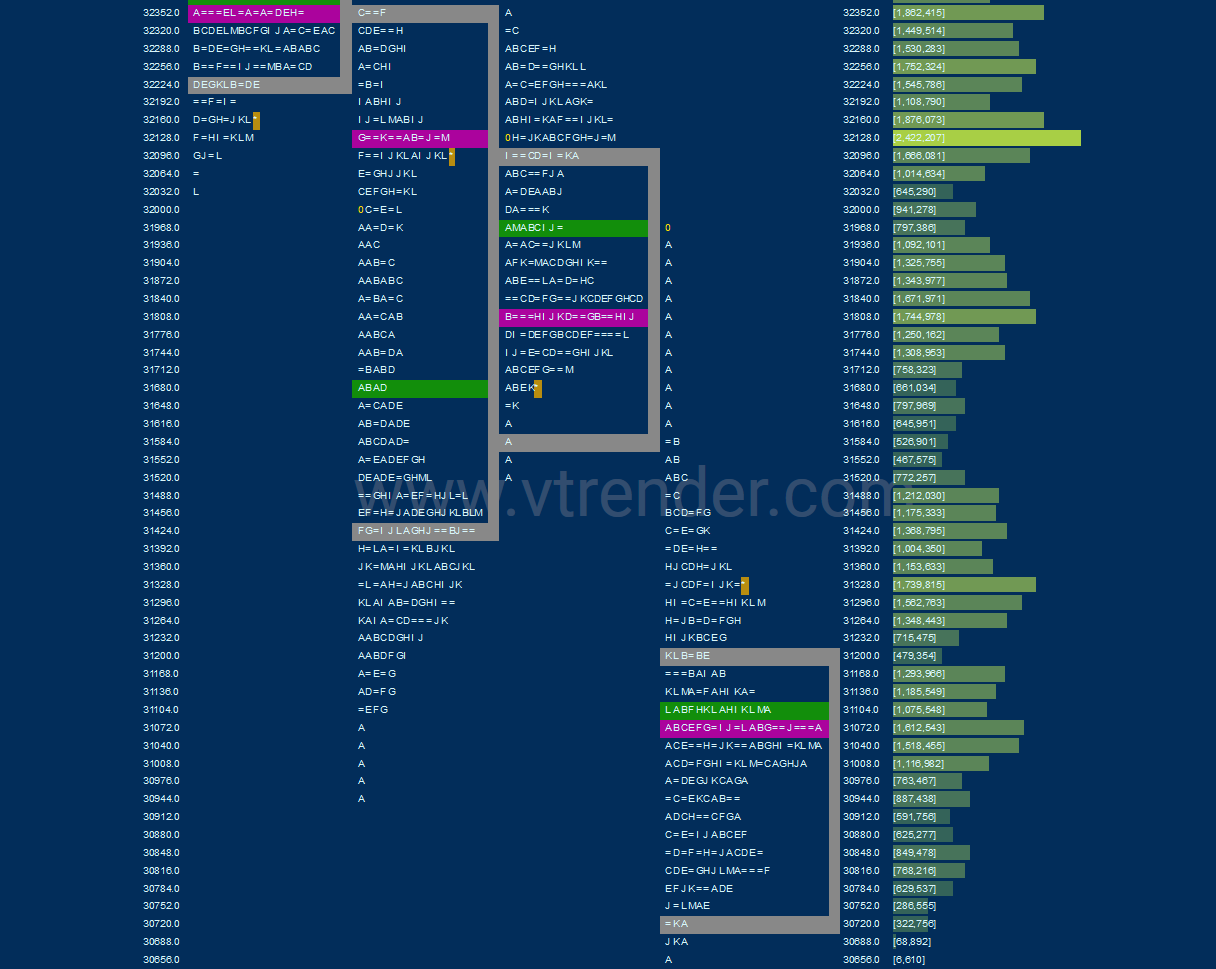
NF also made a similar range expansion from a mere 93 point balance last week to a 309 point imbalance this week as it made an outside bar starting the week with an ORR (Open Rejection Reverse) at new all time highs of 12419 which resulted in a Trend Day on Monday making lows of 12252 as the auction not only completed the 80% Rule in previous week’s Gaussian profile but also went on to enter the Value of the week prior to it on Tuesday and looked set to tag the weekly HVN & VPOC of 12057 & 12042 as it stayed below the lows of the Trend Day for the next 3 days but saw demand returning in the buying tail of 12181 to 12063 from 9th Jan which was the start of a new IPM (Initial Price Movement) making similar lows on Wednesday & Thursday at 12110 and the Thursday’s ORR (Up) open confirmed the end of the move down at least for this week. NF finally managed to get into the Trend Day range on Friday as it went on to tag the daily VPOC of 12268 as it made highs of 12293 and closed at the weekly HVN of 12270 to leave a ‘b’ shape long liquidation profile. The Value for the week was completely lower at 12129-12200-12255 and staying above 12270, NF will have to get new demand above the Trend Day VWAP of 12308 in the coming week for any upside. On the downside, the POC of this week at 12200 will be an important reference which if taken out could end up repairing the poor lows of this week.
BankNifty Spot Weekly Profile (20th to 24th Jan 2020)
31242 [ 31924 / 30614 ]
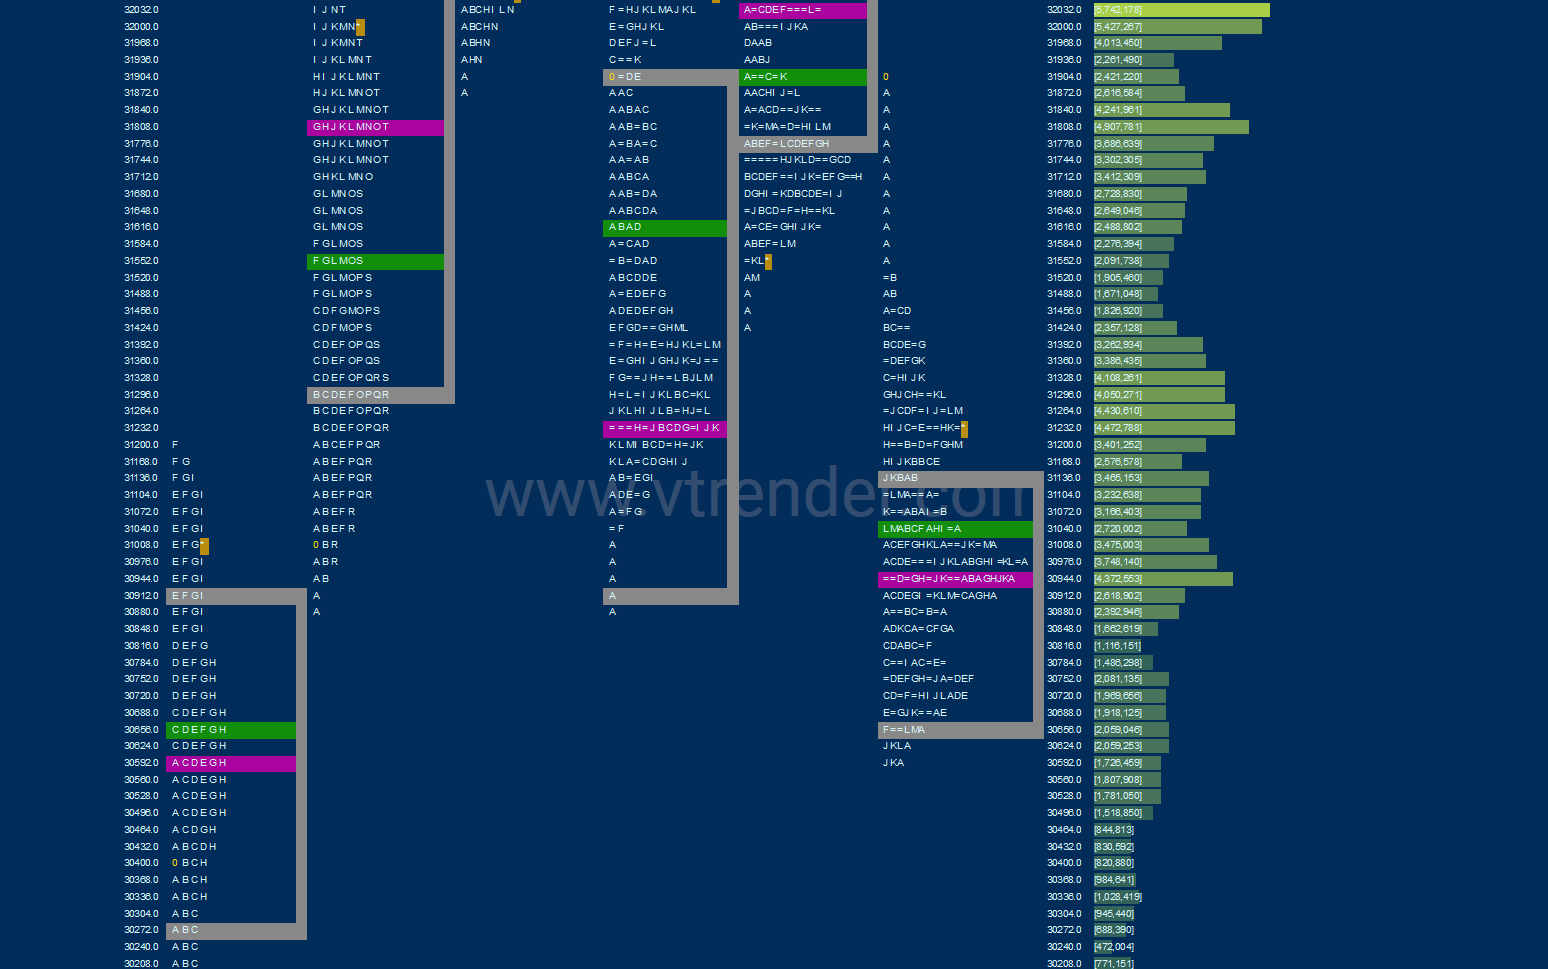
BankNifty gave a Drive away from previous week’s POC of 31744 as it opened on Monday with a freak OH tick of 31924 and broke below previous week’s Value in the ‘A’ period itself as it left a big selling tail from 31531 to 31924 after which it made made multiple REs lower and closed around the lows of 31051 leaving a Trend Day Down. The auction continued to probe lower till Wednesday afternoon as it made lows of 30614 while tagging the weekly VPOC of 30626 (of the 2 week composite from 4th November to 15th November) where it took support as it left a ‘b’ shape profile on the daily indicating that the sellers were getting exhausted. More confirmation of this came on Thursday as BankNifty formed an inside bar completing a 3-day composite and the Friday open gave a move away from the POC of this composite to the upside forming a ‘p’ shape profile for the day as it made highs of 31375 falling just short of the VPOC of 31403 it had left on Monday. BankNifty closed the week at 31242 forming a ‘b’ shape profile for the week with completely lower Value at 30626-31002-31221 so the PLR (Path of Least Resistance) remains to the downside unless the auction sustains above 31246 and successfully takes out that VPOC of 31403. Staying below 31246-31221, BankNifty could go for the test of the weekly POC of 31002 and break of that could open up more downside in the coming week.
Click here to view the BankNifty action this week with respect to the previous week’s Value on MPLite
Weekly Hypos for Bank Nifty (Spot):
A) BankNifty needs to sustain above 31246 for a move to 31330 / 31403-418 & 31488-531
B) Staying below 31221, the auction could test 31174-153 / 31072-065 / 31002 & 30960-950
C) Above 31531, BankNifty can probe higher to 31580-596 / 31684 & 31744-752
D) Below 30950, lower levels of 30890-880 / 30801 & 30715 could come into play
E) If 31752 is taken out, BankNifty could rise to 31860 / 31924-952 & 32041-056
F) Break of 30715 could trigger a move lower to 30626 / 30550-538 & 30450
G) Sustaining above 32056, the auction can tag higher levels of 32100-131 / 32196-221 & 32272
H) Staying below 30450, BankNifty can probe down to 30364-335 / 30277 & 30204
BNF (Weekly Profile)
31330 [ 31936 / 30680 ]
BNF has made a ‘b’ shape profile on the weekly with completely lower Value at 30752-31083-31212 after it gave an initiative move away from previous week’s Value & POC in the form of big selling tail from 31587 to 31936 and went on to make lows of 30680 after which it gave a retracement to 31438 on Friday before closing the week at 31330.


