Nifty Spot Weekly Profile (23rd to 27th Mar 2020)
Spot Weekly – 8660 [ 9039/ 7511 ]
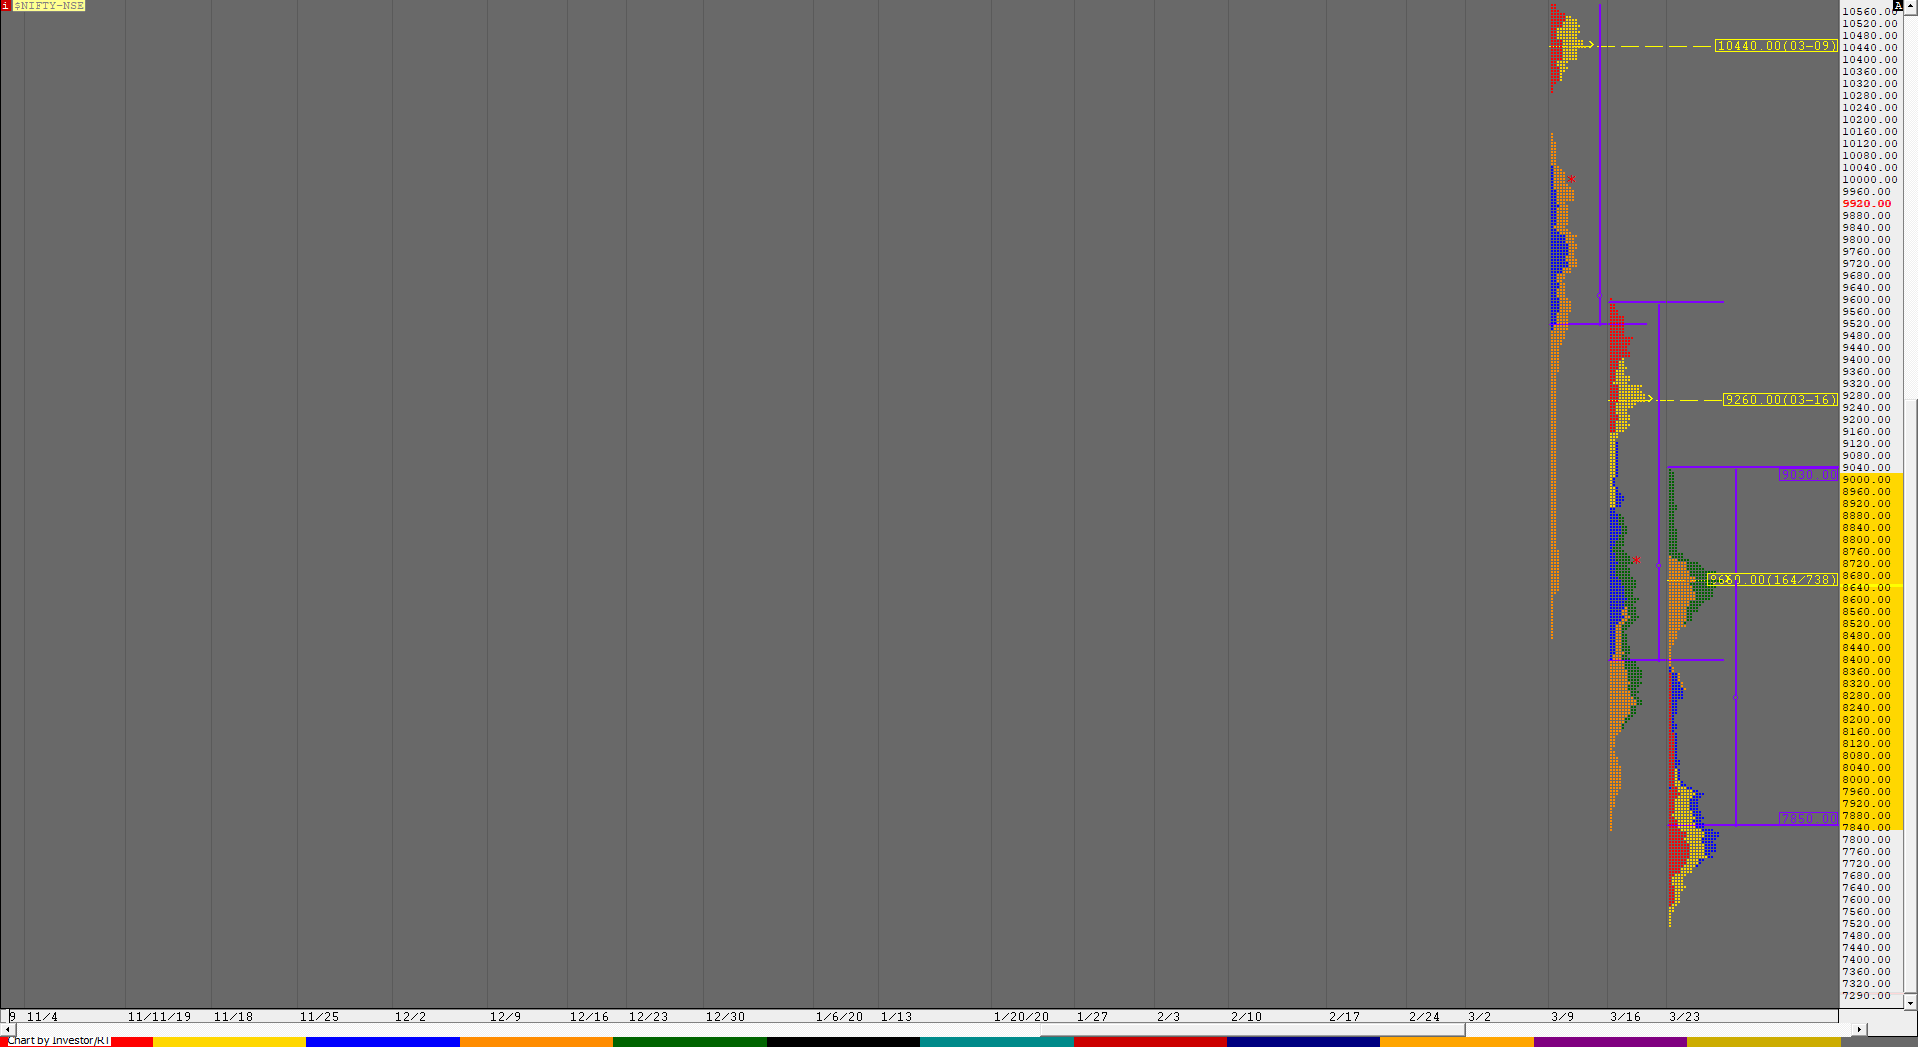
Nifty opened this week with a HUGE GAP DOWN of 800 points from previous week’s close of 8745 and continued to probe lower resulting in the second lower circuit of this month as it made lows of 7892 before trading was stopped for an hour. However, the auction continued to trend lower post the re-open making multiple REs to the downside as it made lows of 7583 & closed at 7610 resulting in a Trend Day Down with a PBH (Pull Back High) at 7863 & the dPOC at 7903 as important references on the upside. The fall of over 1000 points in a day led to a small retracement on Tuesday open as Nifty opened higher with an OL start at 7848 and drove higher as it scaled above the PBH of 7863 as well as the YPOC of 7903 making highs of 8037 in the opening minutes but was swiftly rejected as it not only broke the OL start in the ‘A’ period itself but went on to make new lows for the week at 7567 in the ‘B’ period leaving a huge 300 point selling tail from 7703 to 8037 in the IB. The auction then made the dreaded C side extension lower making new lows of 7511 and was quickly rejected back into the IB which was the first sign that the downside auction was getting more emotional and this got more confirmation as Nifty made a One Time Frame move higher for the next 8 periods and in the process negated almost the entire selling tail as it left a PBH at 7994 before a long liquidation move into the close got it back to 7801 at end of the day. Wednesday saw a lower opening in Nifty as it took support at previous day’s VAL of 7713 and on the upside got rejected in the IB at 7980 just below previous day’s PBH in the IB after which it started to form a balance for the first part of the day. The auction then changed character in the ‘G’ period as it not only made a RE to the upside leaving an extension handle at 7980 but went on to scale above PDH and continued this imbalance over the next 4 periods with the help of 2 more extension handles at 8069 & 8182 as it made new highs for the week at 8376 leaving a Trend Day Up with a close at 8318. Follow up to Trend Days are rare but Thursday was an exception as it opened with a gap up of 130 points and took support at 8304 as it closed the gap in the A period but left a buying tail from 8476 to 8305 in the IB which meant that the PLR remains to the upside. Nifty went on to make a RE to the upside as it hit 8749 closing the weekly gap via the dreaded C side extension which was a sign of exhaustion and as had happened at lows on Tuesday from where there had been a huge 1239 points upmove, it seemed that this leg of imbalance could be coming to an end. The auction then remained in the IB for most part of the day forming a ‘p’ shape profile with an attempt to break into the morning buying tail in the ‘J’ period where it left a PBL at 8454 indicating return of demand as Nifty bounced back higher to close around the dPOC of 8624. Friday then saw a bigger gap up of more than 300 points from where the auction continued higher to tag 9039 in the A period completing a 1500 point range for the week after which it made a OTF move down for the next 4 periods as it not only closed the gap but went on to complete the 80% Rule in previous day’s well balanced Value Area as it made lows of 8522 in the ‘I’ period completing the 2 IB objective for the day from where it made an attempt to get back into the IB but was rejected as it left a PBH at 8840 before closing the day at 8660 which was the overlapping POC of last 2 days with almost similar Value. The weekly profile resembles a DD (Double Distribution) with the lower balance formed over the first 3 days of the week with Value at 7671-7903-7965 above which we have the daily extension handle of 7980 & the weekly extension handle of 8160 and a low volume zone right upto 8454 which separates the 2-day balance formed higher with Value at 8520-8680-8726. The weekly Value is at 7850-8660-9030 with the close being around the POC which would be the important reference in the coming week. Staying below this POC, Nifty could fill up the low volume zone of this week with a probability to tag the POC of the lower distribution at 7903. On the upside, the auction would need to get accepted above 8726 for a probe towards the weekly VPOC of 9260.
Click here to view this week’s auction in Nifty with respect to previous week’s profile on MPLite
Click here to view the 2 balances formed this week
Main Weekly Hypos for Nifty (Spot):
A) Nifty needs to sustain above 8680-96 for a move to 8727-48 / 8790 / 8840-88 / 8920-30 & 8978-9025
B) The auction staying below 8649 could test lower levels of 8605 / 8555-10 / 8465-54 / 8415-8375 & 8325-17
Extended Weekly Hypos
C) If 9025 is taken out, Nifty can probe higher to 9073 / 9113-21 / 9169 / 9217 & *9260-82*
D) Break of 8317 could bring lower levels of 8279 / 8236-26 / 8191-82 / 8146-8101 & 8069-56
Additional Hypos*
E) Above 9282*, Nifty could start a new leg up to 9313 / 9354-61 / 9404-09 / 9441-58 & 9491-9507
F) Below 8056*, the auction can go down to 8011 / 7965 / 7922-03* / 7877-65 & 7833-05
NF (Weekly Profile)
8651 [9044 / 7521]
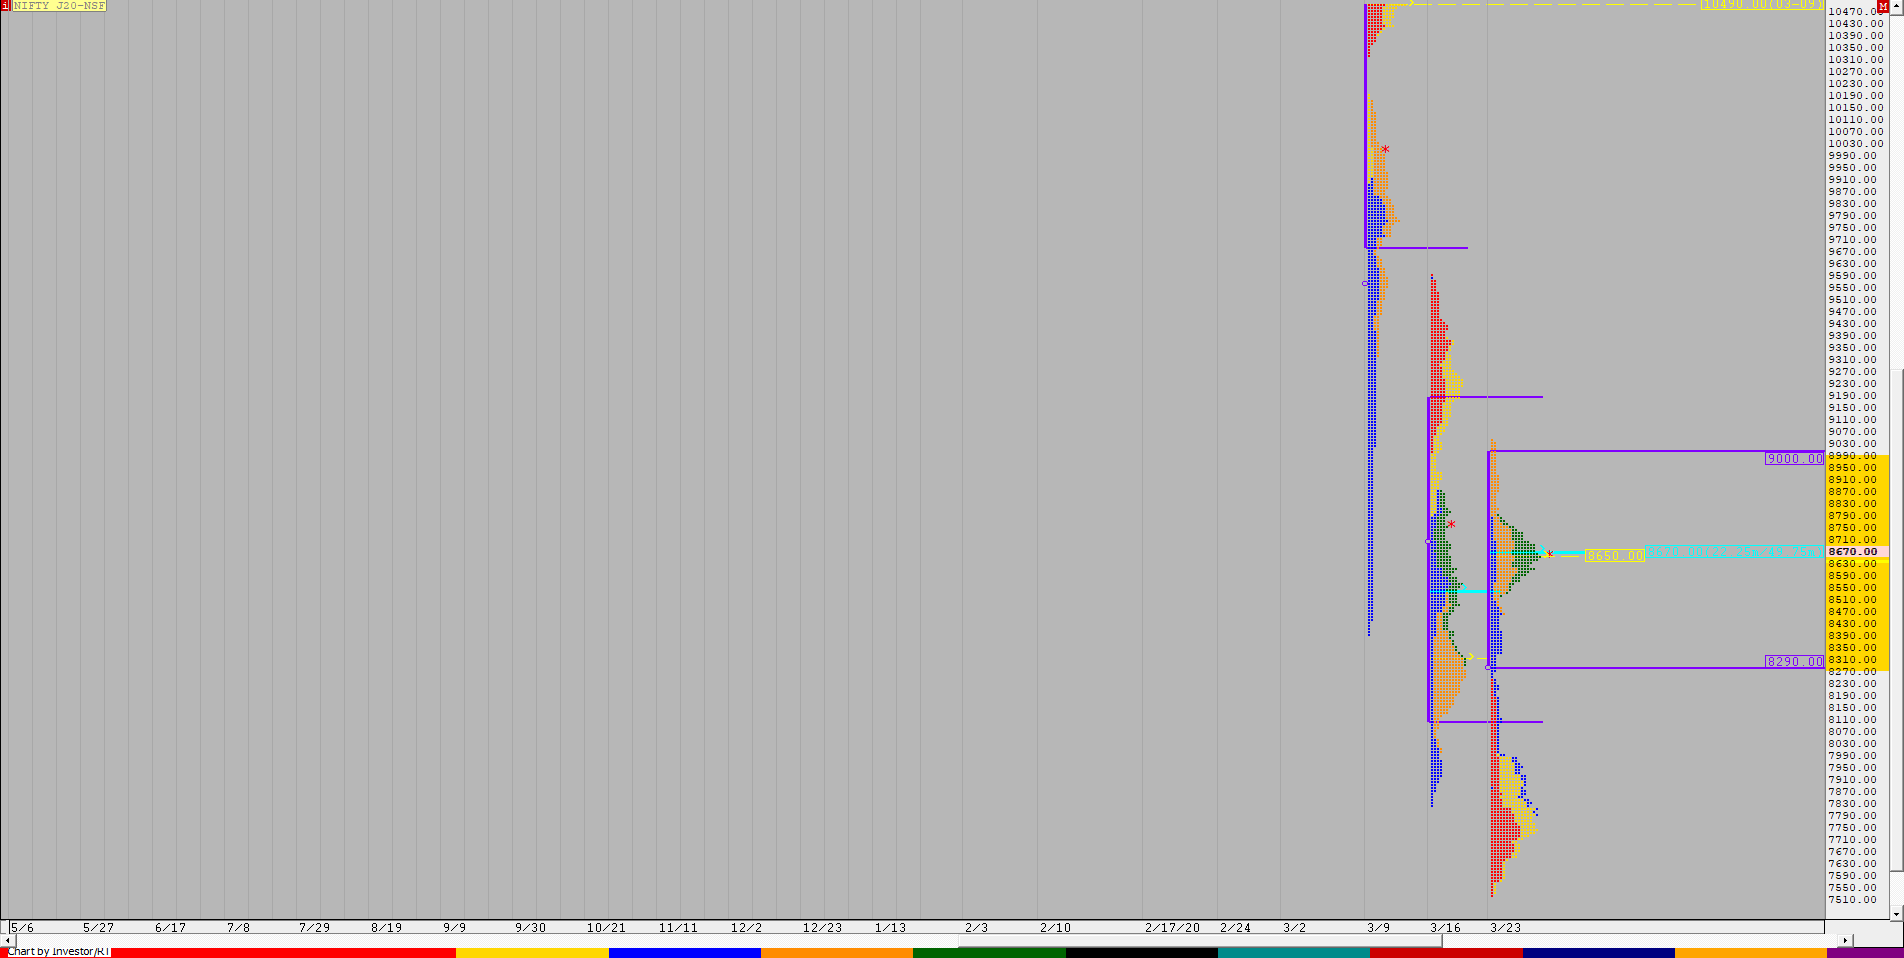
NF opened the week with a huge gap down continuing the imbalance from previous week’s FA of 9384 and probed lower as it left lows of 7521 on Tuesday and confirming a FA there which ended the downside probe. The auction then left a big 750 point Trend Day Up on Wednesday as it made new highs for the week at 8482 and completed the 2 ATR objective of the FA which was at 8563 on Thursday and made highs of 8780 leaving a ‘p’ shape profile for the day which indicated short covering. Friday saw a big gap open but the probe seemed to be exhausting on the upside as was seen in similar highs of 9038 & 9044 in the first 2 periods and this led to a good long liquidation move for the rest of the day as NF not only closed the gap but went on test yVAL while making a low of 8525 before closing the week at 8651 which is also the prominent POC of the 2-day composite 3-1-3 profile. The weekly profile resembles a Double Distribution Trend Up with Value at 8290-8650-9000 and a low volume zone from 8460 to 8000. Value for the week was completely inside previous week’s Value.
BankNifty Spot Weekly Profile (23rd to 27th Mar 2020)
Spot Weekly – 19969 [ 21462 / 16116 ]
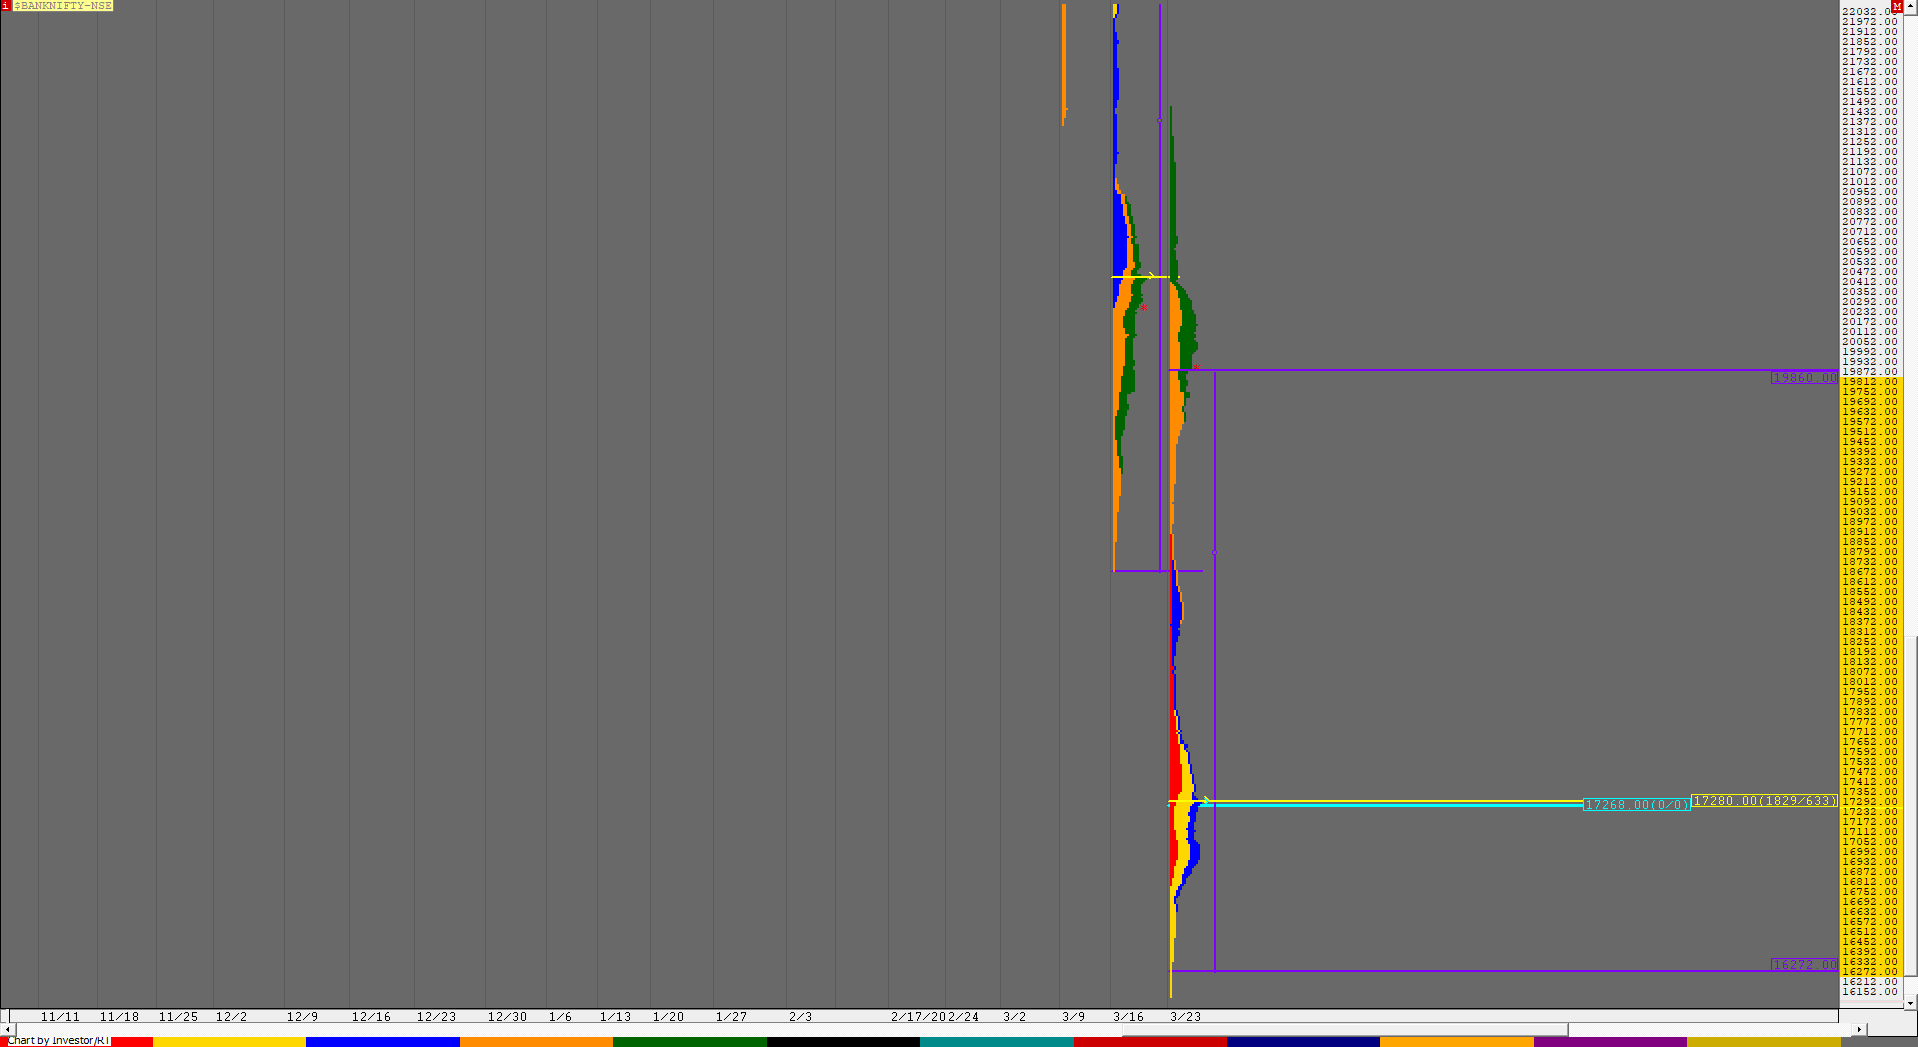
BankNifty also opened the week with a HUGE Gap Down of over 2000 points as it moved away from previous week’s Value to leave a Trend Day Down on Monday falling by a further 1500 points as it made a low of 16791. This 3500 point imbalance to the downside in a single day then led to a big gap up opening on Tuesday of almost 800 points as it made a freak high of 17841 in the opening minute but also saw the auction getting rejected from above Monday’s VAH and this led to a fresh move to the downside as BankNifty broke below PDL (Previous Day Low) forming the biggest ever IB range of 1500 points and even went on to make a C side extension to the downside as it fell by another 200 points tagging lows of 16116 but was swiftly rejected back into the IB and even left a buying tail from 16338 to 16116. This tail at new lows was an indication that the downside probe could be over as the auction made a slow probe to the upside for the rest of the day as it remained inside the IB forming a balanced profile. Wednesday then saw a lower opening as BankNifty continued to probe down in the IB while making a low 16635 in the ‘B’ period and left a contrasting range of just 652 points in the first hour which was the lowest in the last 8 sessions since the fall in BankNifty expedited from 13th March. The relatively narrow IB range meant that there could be a multiple RE move coming up as the auction coiled for the next 2 periods taking support at yVAL of 16854 in both the C & D periods indicating that the downside was getting limited. The ‘E’ period then made a RE to the upside which was the more confirmation that the PLR was now firmly to the upside and after a subdued ‘F’ period which remained inside ‘E’, BankNifty changed gears from the ‘G’ period onwards as it left an extension handle at 17327 and went on to complete the 3 IB objetive in the ‘I’ period itself as it made highs of 18740. Having hit the 3 IB target so early in the day, the auction then formed a small balance at the top of the day’s profile as the dPOC also shifted higher to 18450 which would be the important reference for the next day. The auction left a buying tail in the IB at this 18450 level on Thursday from 18966 to 18364 and even confirmed an extension handle at 19072 as it not only made new highs for the week but went on to close the weekly gap down as it made highs of 20409 but saw good profit booking there as it retraced the entire rise from the ‘A’ period and took support at 19096 just above the morning extension handle as it left a PBL there and went on to close at 19614 leaving a ‘p’ shape profile for the day with completely higher Value which meant that the PLR was still up. BankNifty then opened with a big gap up of almost 1200 points on Friday and continued to probe higher in the IB as it made highs of 21462 in the ‘B’ period but not only retraced the entire day’s move but went on to make new lows for the day at 20620 as it left a selling tail from 21287 to 21462 which was a sign that the upside probe for the week could be done. The auction then made a RE to the downside in the ‘C’ period and followed it up with another RE in the D period as it closed the gap and stayed below the IBL forming a balance for the rest of the day leaving a ‘b’ shape long liquidation profile with a close around the 2-day composite POC of 19995 which would be the immediate reference for the coming week. The weekly profile is an elongated one with excess at both ends as BankNifty completed a hat-trick of 5000+ point range with Value at 16272-17280-19860. The first low volume zone is from 19430 to the weekly extension handle of 18895 below which there is the HVN of 18450 which would be important levels on the downside.
Click here to view the 2 balances formed this week
Main Weekly Hypos for Bank Nifty (Spot):
A) BankNifty needs to get above 20023 & sustain for a probe to 20094-165 / 20235-310 / 20375 / 20450-488 & 20521 and acceptance above 20521 could go for 20593-665 / 20735 / 20800-810 / 20880 & 20955-21026
B) Immediate support is at 19950 below which the auction could test 19881-860 / 19800 / 19717-670 / 19600-580 & 19524-461 and staying below 19461 could further fall to 19429-390 / 19321-252 / 19200-183 / 19114-096 / 19045 & 18976-966
Extended Weekly Hypos
C) Above 21026, BankNifty can probe higher to 21098-120 / 21171-245 / 21287-317 / 21390-463 & 21515-535
D) Below 18966, lower levels of 18905-895 / 18835-770 / 18701-675 / 18633-565 & 18497-481 could come into play
Additional Hypos*
E) Above 21535*, BankNifty could start a new leg up to 21610-685 / 21831-845 / 21910 / 21979-999 & 22055
F) Below 18481*, the auction can go down to 18429-361 / 18288-225 / 18175-155 / 18090-024 & 17956-890
BNF (Weekly Profile)
19778 [ 21273 / 16020 ]
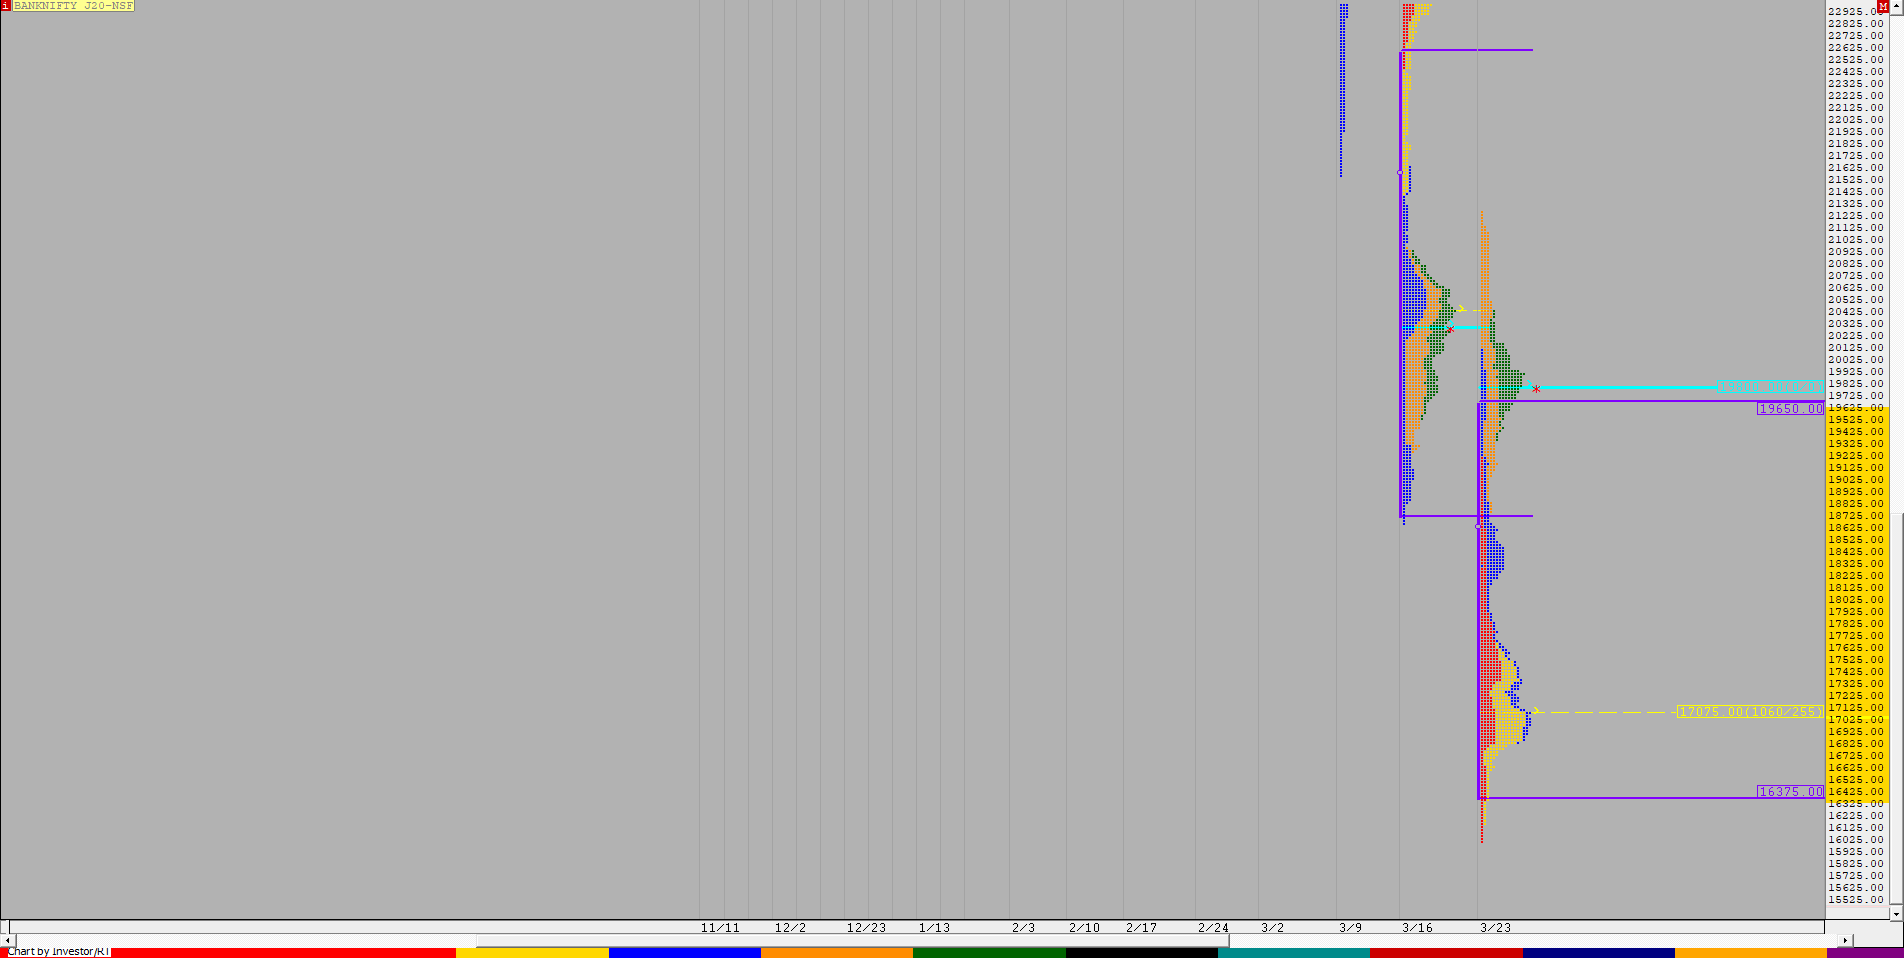
BNF has made an elongated weekly profile with a range of 5253 points with 2 big distributions at both extremes with HVNs at 19800 & 17075 in the upper & lower distributions respectively. The weekly Value is at 16375-17075-19650 which contains a low volume zone from 19350 to 17920.


