Nifty Spot Weekly Profile (30th September to 4th October)
Spot Weekly 11175 [ 11554 / 11158 ]
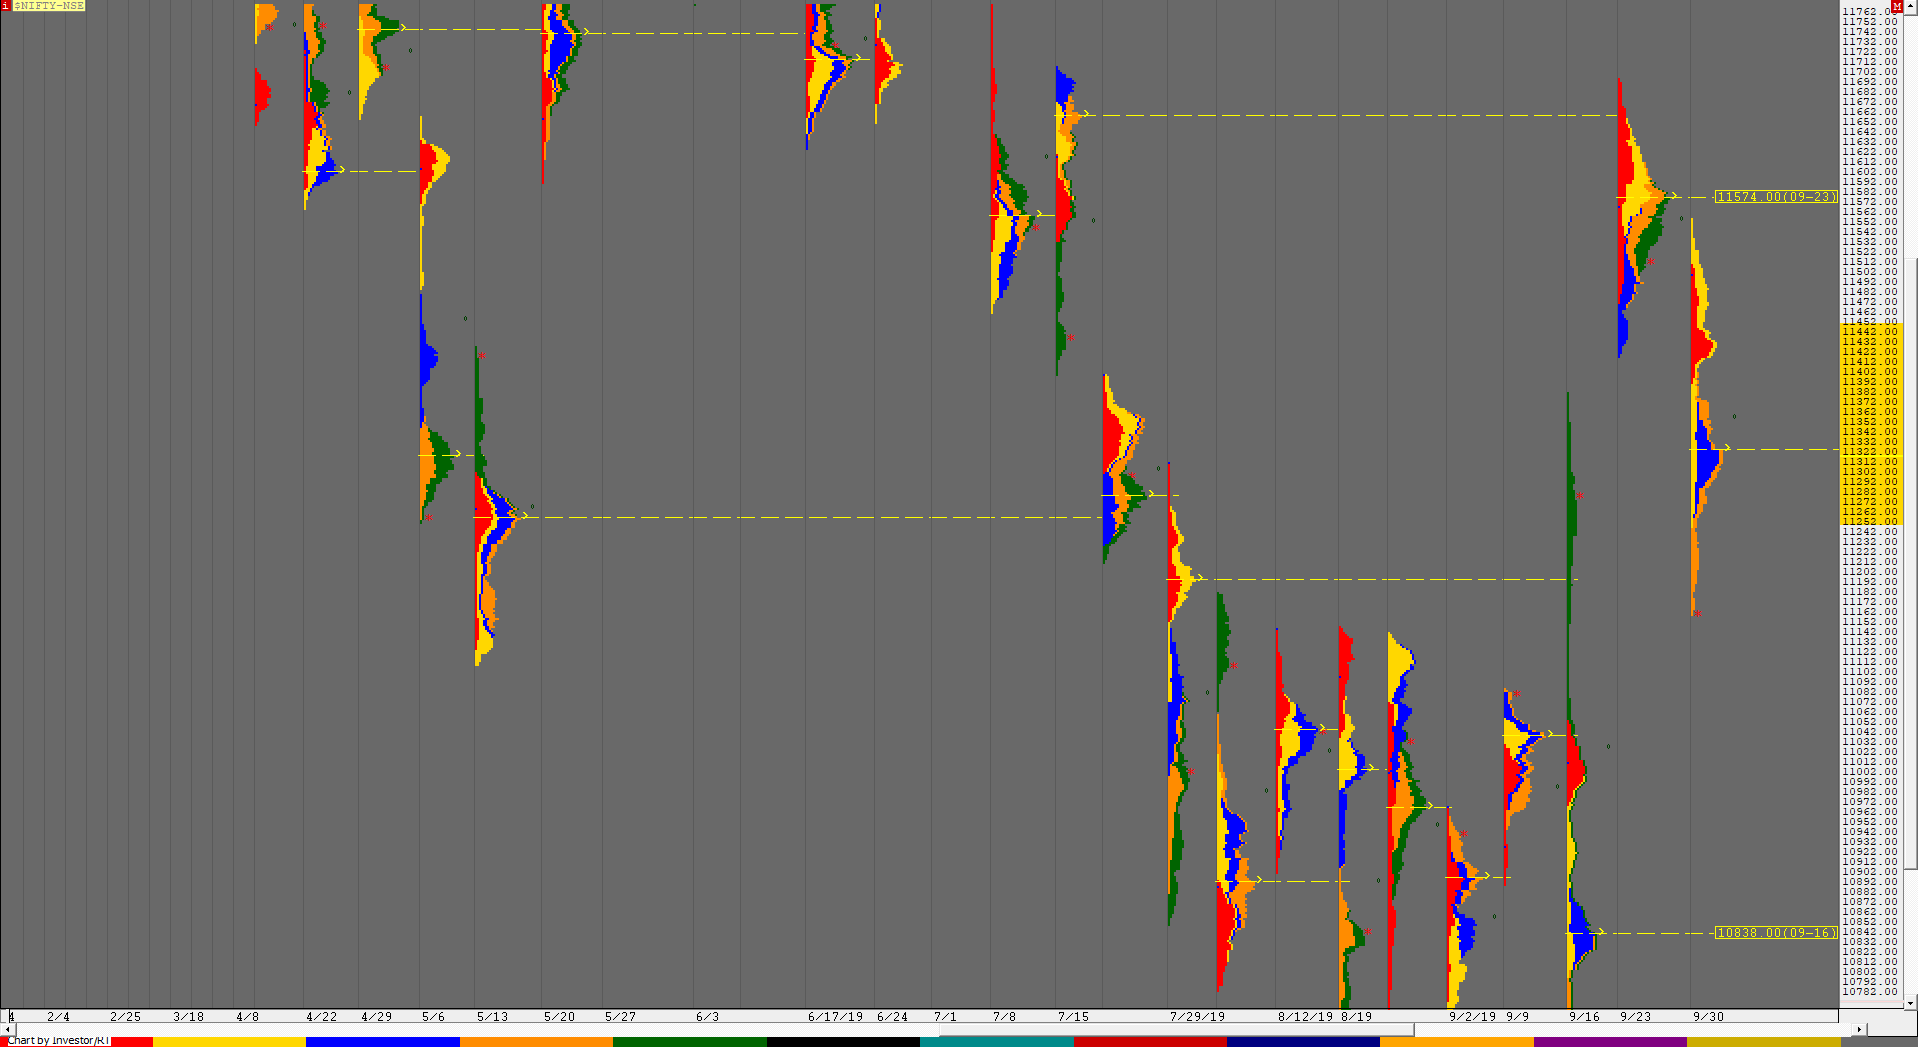
Nifty gave a Open Rejection Reverse (ORR) start on Monday as it opened lower & then got rejected from 11505 on a probe into Friday’s range as well as the weekly Value from where it went on to break previous week’s low of 11416 tagging 11391 but could not sustain the new lows and went on to form a ‘b’ shape profile for most part of the day before spiking higher in the last hour is it made new highs of 11508 for the day leaving a Neutral Day. The auction then gave a gap up on Tuesday to get back in the weekly Value and probed higher to tag 11554 but was not able to test previous week’s POC of 11574 that too of a well balanced weekly profile which indicated that the move to the upside is struggling. This got further confirmation as Nifty not only closed the gap but went on to make a steep fall in the second half making new lows for the week and in the process confirmed a weekly FA (Failed Auction) at 11554 as it made lows of 11248 completely negating the weekly singles of 11421 to 11274 and falling just short of the 1 ATR objective of 11222. The imbalance of 300 points on Tuesday then led to a narrow range day on Thursday as the auction made a balance in the lower part of Tuesday’s profile leaving a nice Bell Curve on the daily time frame. Friday saw a big gap up open as Nifty opened above PDH (Previous Day High) and tested the weekly extension handle of 11390 but was swiftly rejected after making a high of 11400 giving yet another ORR start and this time it gave a trending move of 242 points to close the week with a Trend Day Down profile and in the process completed the 1 ATR objective of the weekly FA and closed around the lows suggesting that the imbalance could continue in the next session. The weekly profile is an elongated Double Distribution (Down) with completely lower Value at 11252-11325-11442 and the PLR for the coming week would be down if the auction breaks below 11152 which was the low of the weekly buying tail below which the next reference would be the extension handle of 11073. On the upside, Nifty will have to scale above 11248-252 for a probable test of 11325 which could act as important resistance in the coming week(s).
Weekly Hypos for Nifty (Spot):
A) Nifty needs to get above 11237-252 & sustain for a move to 11290 / 11325-343 & 11395-400
B) Immediate support is at 11151-127 below which the auction could test 11078-73 / 11025-04 & 10973-960
C) Above 11400, Nifty can probe higher to 11450 / 11503 & 11554-574*
D) Below 10960, lower levels of 10890-869 & 10838*-817 could come into play
E) If 11574 is taken out & sustained, Nifty can have a fresh leg up to 11611-630 / 11665 & 11707-719
F) Break of 10817 could bring lower levels of 10765-745 / 10713-708 & 10670-661
NF (Weekly Profile)
11215 [11607 / 11201]
NF has made a trending Double Distribution profile down on the weekly with completely lower Value and a close at lows. The week began with an ORR (Open Rejection Reverse) start on Monday as the auction opened with a small gap down and got rejected from just below the weekly Value as it made an attempt to probe higher after which it broke below previous week’s low and went on to make a RE to the downside making a low of 11445 (which was the weekly extension handle) but could not extend further which led to a short covering bounce in the last hour resulting in new day highs of 11579 before closing at 11535 leaving a Neutral profile on the first day of the week. NF opened higher on Tuesday & went on to make new highs for the week at 11607 where it was swiftly rejected after which it made a balance for the first half of the day but gave a big move down in the second half as it broke below the PDL to confirm a weekly FA at 11607 and went on to make lows of 11310 and in the process tagged the 20th Sep vPOC of 11330 before giving a retracement as it closed the day at 11430. Thursday was a narrow range inside bar as NF stayed below 11445 leaving a Normal Day to keep the 1 ATR objective of 11283 very much alive. The auction then gave a gap up on Friday as it opened above PDH and tagged 11430 in the opening minutes but could not sustain as it got back into the previous day’s range confirming an ORR and led to a Trend Day down as NF completed the 1 ATR (weekly) objective and closed the week in an imbalance mode around the lows of 11201. The weekly Value is at 11307-11362-11529.
BankNifty Spot Weekly Profile (30th September to 4th October)
29877 [ 30801 / 29470 ]
Previous week’s report ended with this ‘The close has been near the VAL so BankNifty could continue to balance in the coming week before starting the next phase of imbalance.’
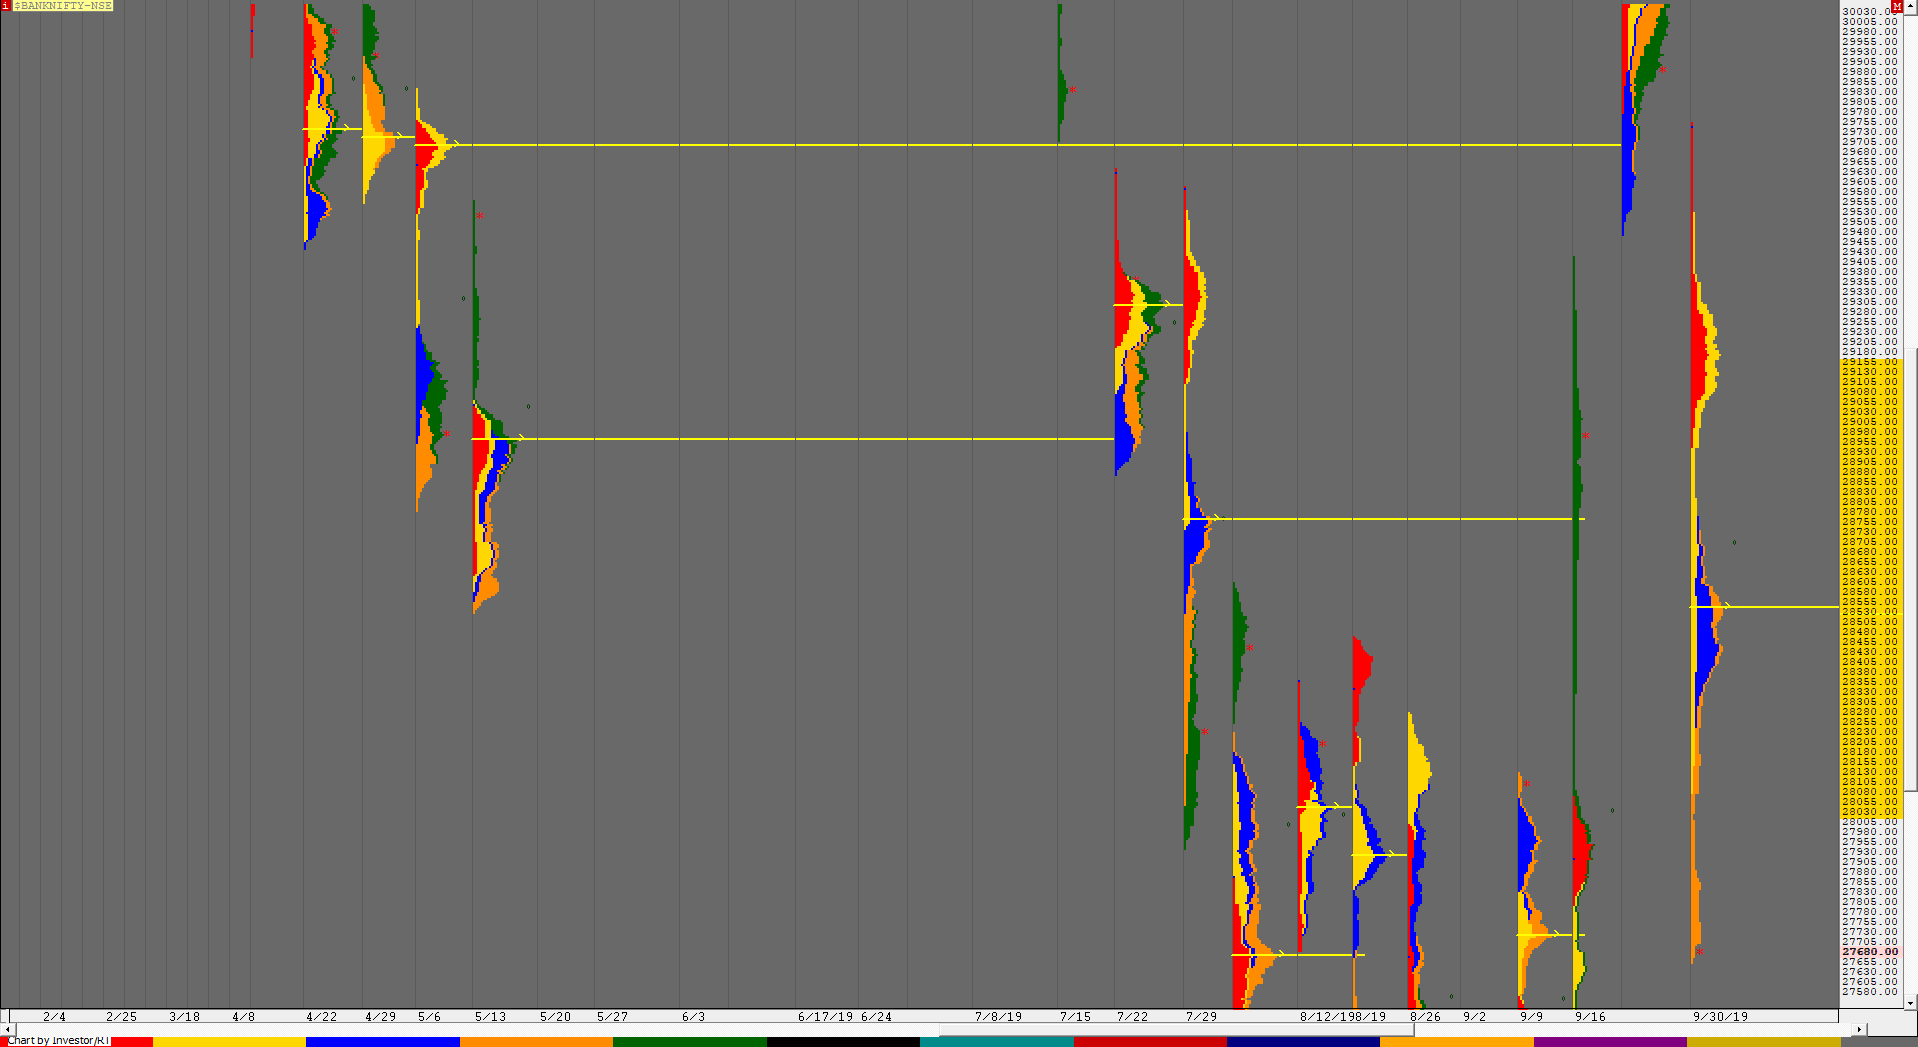
The expectation was a balance being formed this week but the open on Monday changed this view as BankNifty gave a gap down & the attempt to probe higher was rejected exactly at the weekly VAL of 29755 and a ORR (Open Rejection Reverse) start on a weekly that too from previous Value was a ominous sign as BankNifty fell by 811 points making a low of 28943 as it negated the weekly singles from 28981. It however found support in this zone and gave a bounce to close at 29103 leaving a ‘b’ shape profile on the daily with a long selling tail from 29370 to 29754. The auction then gave a gap up on Tuesday and continued to probe higher as it entered the previous day’s selling tail but got rejected at 29526 which led to a big liquidation in the IB (Initial Balance) as BankNifty made new lows for the week at 28822 leaving a big IB range of 705 points inside which it balanced for the first half of the day and gave a fresh RE (Range Extension) lower in the second half as it left an extension handle at 28822 and gave a huge move lower doubling the day’s range in just an hour as it made lows of 28077 in the ‘J’ period stopping just above the weekly extension handle of 28066 but recovered this entire fall as it got back to 28818 by close stalling just below the extension handle of 28821 which meant that the PLR was still down & this move was just a retracement. Thursday then gave an OAIR (Open Auction In Range) start after the holiday mid week and remained in the holiday mood as it gave the narrowest range of the week making an inside bar on the daily making a nice balance below 28822 which meant that Value continued to form lower. BankNifty then gave a big gap up of 250+ points on Friday but could not get above the PDH leaving a narrow IB of just 219 points but as had been the case on all the days this week, it had left a tail at top in the IB which is considered to be an initiative activity and with the week’s ORR open setting up the auction to the downside for the week it was only apt that we got a Trend Day Down on the last day as BankNifty gave a 5 IB Day to fall by 1000+ points from day’s high as it broke below the weekly extension handle of 28066 and entered the buying tail of 27960 to 27025 while making a low of 27654 before close the week at 27732 leaving an elongated Double Distribution profile with a spike close of 28077 to 27654 with completely lower Value at 28030-28530-29155.
Weekly Hypos for Bank Nifty (Spot):
A) BankNifty needs to sustain above 27725 for a move to 27785-805 / 27890 & 27973-984
B) Staying below 27725, the auction could test 27650-640 / 27560-550 & 27495-475
C) Above 27984, BankNifty can probe higher to 28030-77 / 28141 & 28225-240
D) Below 27475, lower levels of 27405-390 / 27310 & 27225* could come into play
E) If 28240 is taken out, BankNifty could rise to 28310-321 / 28396-416 & 28465-475
F) Break of 27225 could trigger a move lower to 27160-143 / 27060-25 & 26979-963
G) Sustaining above 28475, the auction can tag higher levels of 28530-562 / 28618-645 & 28731
H) Staying below 26963, BankNifty can probe down to 26895-880 / 26835-815 & 26733-721
BNF (Weekly Profile)
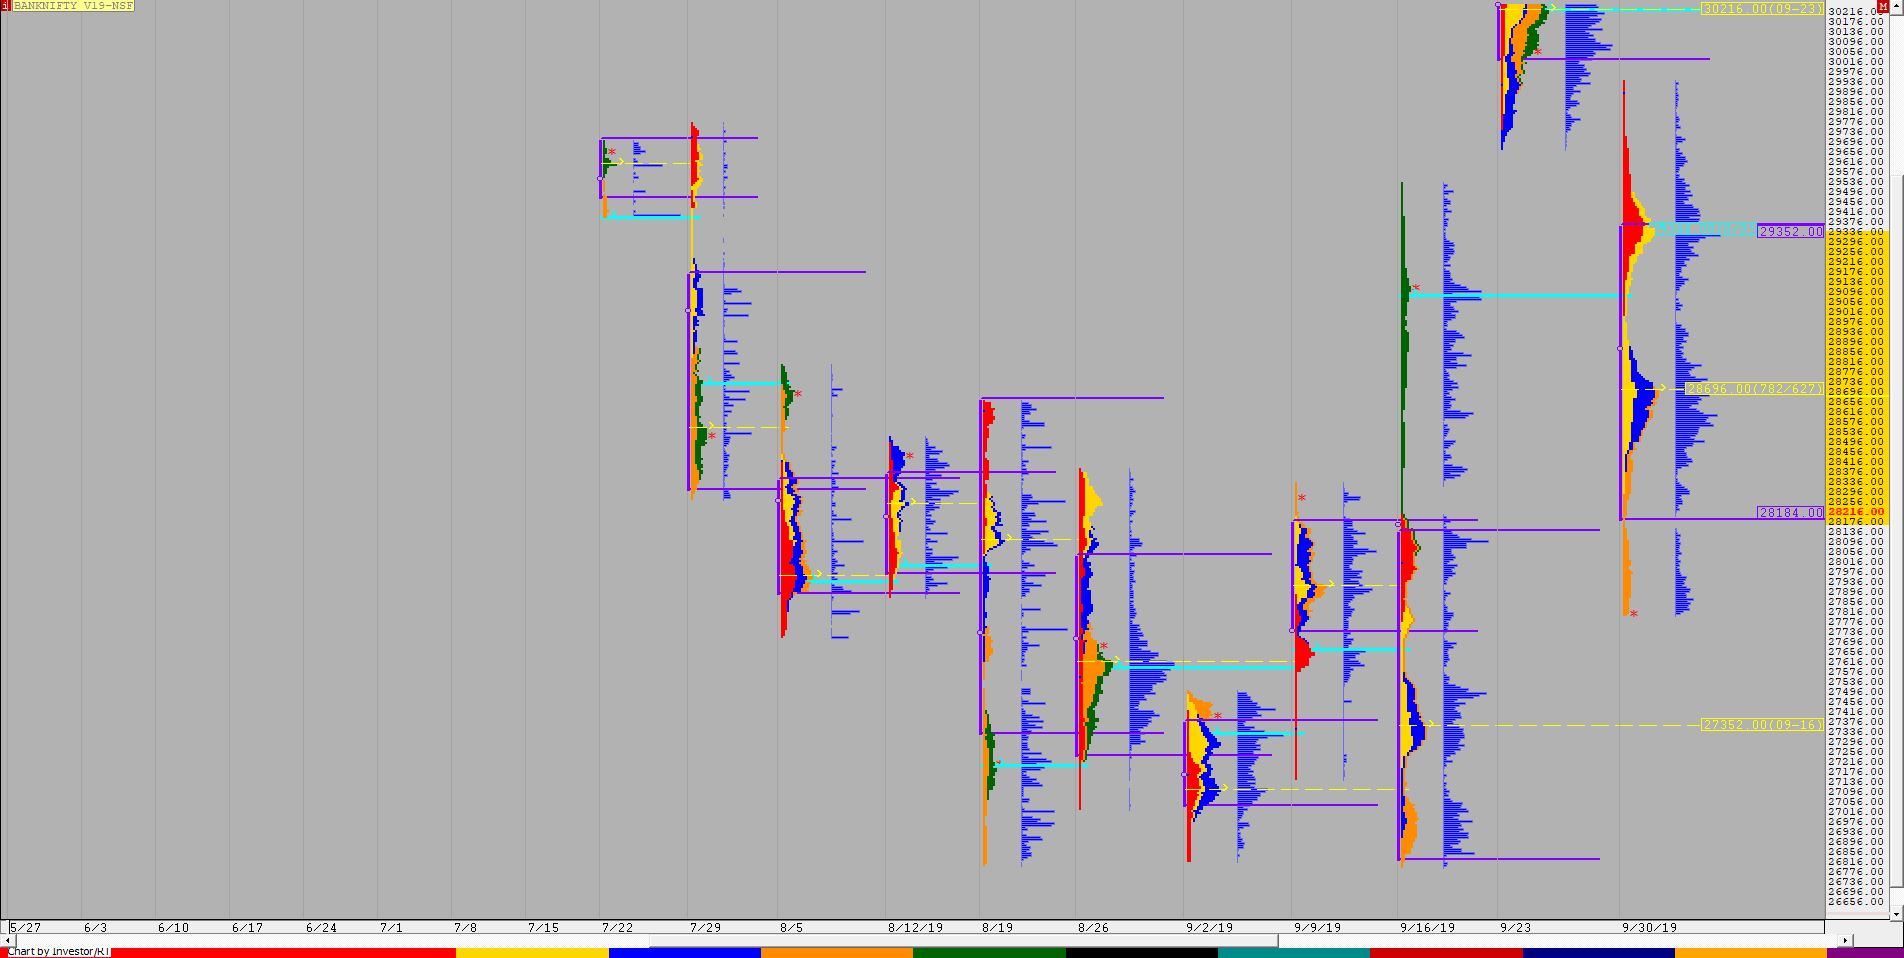
27854 [ 29956 / 27778 ]
Last week’s report ended with this ‘On the dowside, immediate support would be at 30024 and a break of this level on volumes could bring a move lower to 29538 & 29100 in the coming week.’
BNF opened lower on Monday below the support of 30024 and gave an initiative move down as it left a selling tail from 30080 to 29554 and went on to tag the objective of 29100 making lows of 29103 on Monday after which it made a balance building volumes at 29350 till Tuesday afternoon when it gave the second initiative move down and went on to make lows of 28218 almost tagging the 20th Sep extension handle of 28188 as it began to form another balance this time building volumes around the 28580 level. Thursday was a narrow range inside day and on Friday BNF opened higher to stay above this 28600 level for the first couple of hours leaving a very narrow IB range of just 193 points which hinted at a big move happening and later went on to give the third initiative move of the week once it broke below 28580 in the afternoon leaving a weekly extension handle at 28218 as it trended lower into the close to fall by almost 900 points as it made lows of 27778 leaving an elongated Double Distribution profile down with a spike close. The weekly Value was completely lower at 28184-28696-29352.


