Nifty Spot Weekly Profile (3rd to 6th September)
Spot Weekly 10946 [ 10967 / 10746 ]
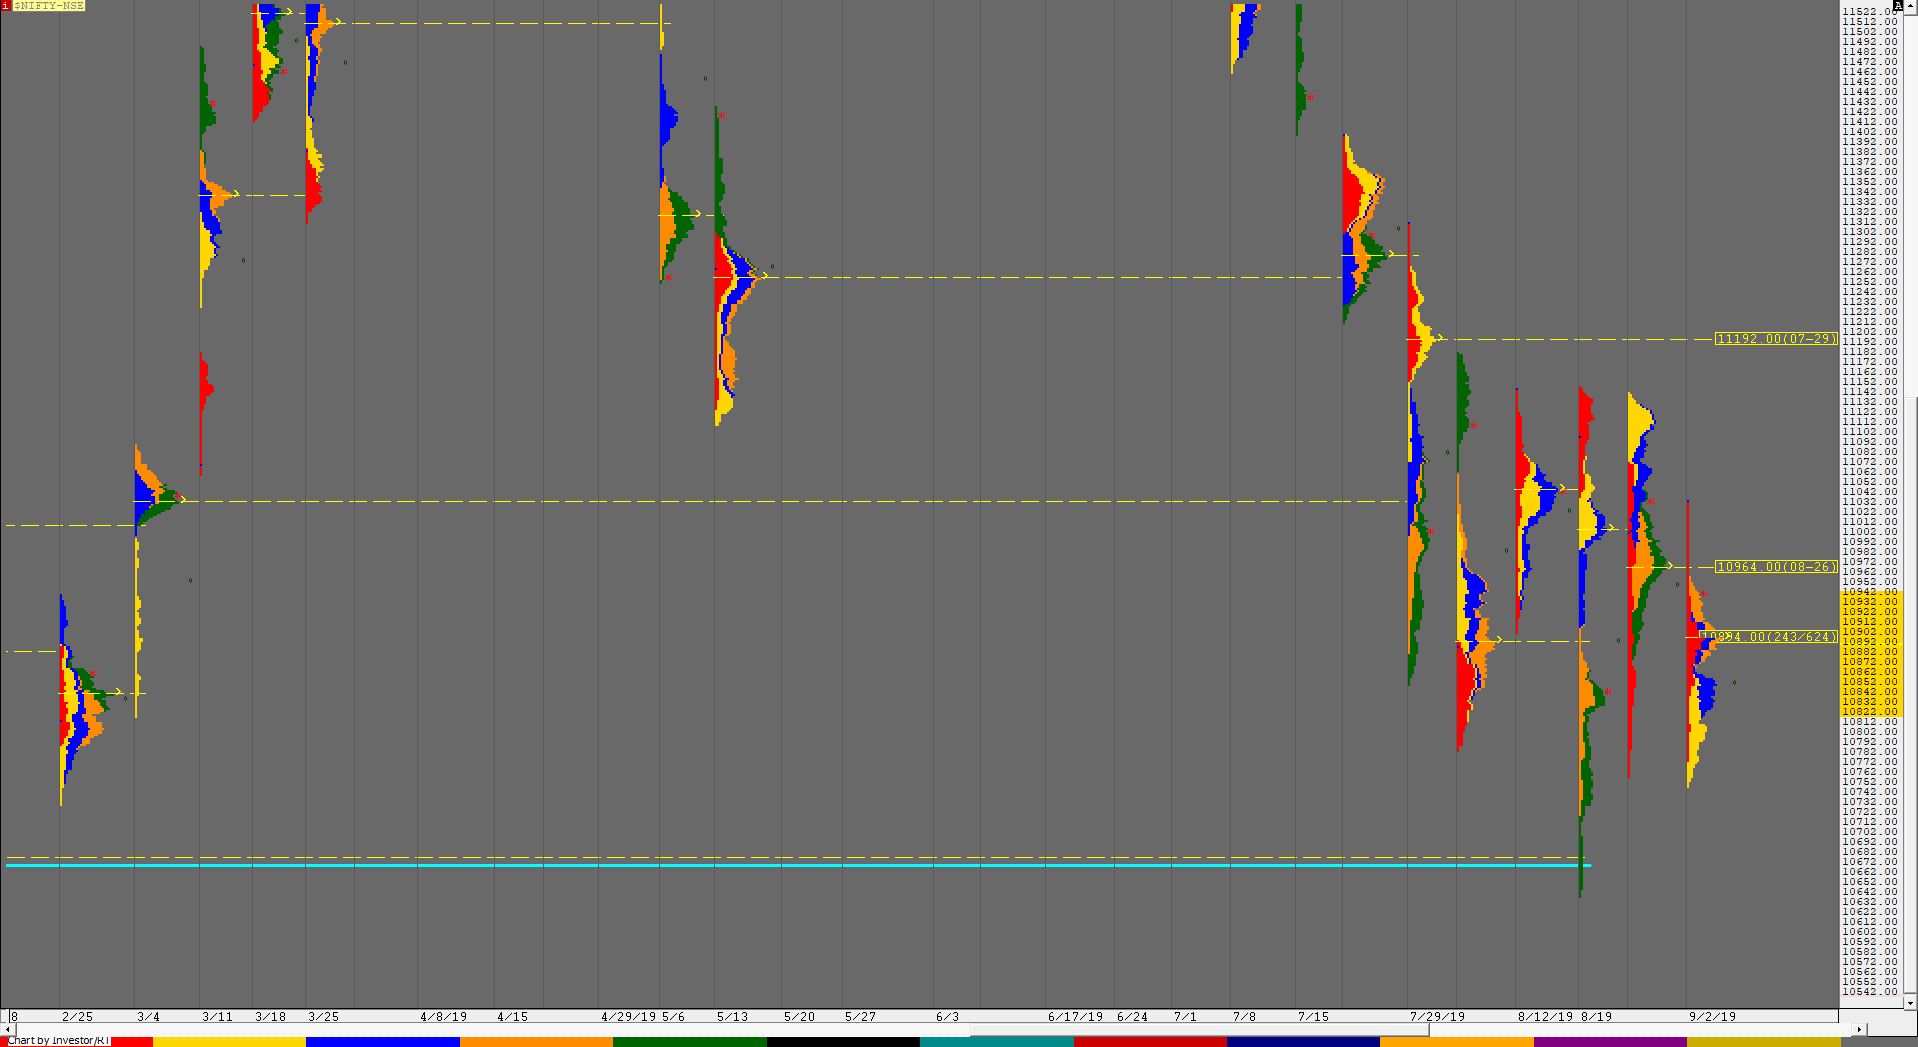
Nifty not only opened the week with a Gap down rejecting the spike close of Friday but also drove lower as it breaking below the weekly VAL and trending all day on Tuesday as it closed in a spike down from 10839 to 10772. Wednesday open saw the auction accepting the spike and then making a Range Extension (RE) lower as it broke previous week’s low of 10756 tagging 10746 but was swiftly rejected and went on to confirm a FA on daily time frame at lows which meant that the PLR (Path of Least Resistance) had turned to the upside. Nifty then went on to complete the 1 ATR move of 10909 from the FA inside the IB (Initial Balance) on Thursday after which it attempted a RE to the upside but got rejected from 10920 after which it probed lower confirming a FA at highs this time as it got back below the weekly VAL and seemed headed to tag the 1 ATR move of 10766 as it made a low of 10816 for the day. Friday however saw the auction open higher and after resisting at the weekly VAL of 10902 for the first couple of hours broke higher giving a slow OTF move on the upside as it negated the FA of 10920 but got stalled just below the Tuesday highs of 10967 before confirming a hat-trick of FAs and this time was at the lows of 10867 as it closed the week at 10946 leaving the narrowest weekly range of 5 weeks indicating that the composite balance it has been forming since then may be close to completion as Nifty gave yet another week of overlapping but lower Value this week at 10822-10894-10942. Nifty has formed a nice 3-1-3 profile on a 25 day composite starting from 31st July with Value at 10836-10974-11072 (click here to view the composite chart) and an attempt this week to move away from this balance to the downside was rejected so can expect a probe higher in the coming week with 11014 & 11072-74 being the first objectives if the auction manages to stay above the HVZ (High Volume Zone) of 10964-10984.
Weekly Hypos for Nifty (Spot):
A) Nifty needs to sustain above the zone of 10964-984 for a move to 11014-25 & 11064-78
B) Immediate support zone is at 10921-894 below which the auction could test 10867-856 & 10822-816
C) Above 11078, Nifty can probe higher to 11107-131 / 11160 & 11184-192
D) Below 10816, lower levels of 10772-765 & 10728-713 could come into play
E) If 11192 is taken out & sustained, Nifty can have a fresh leg up to 11237 / 11267-290 & 11310-320
F) Break of 10713 could bring lower levels of 10661 & 10637-610
NF (Weekly Profile)
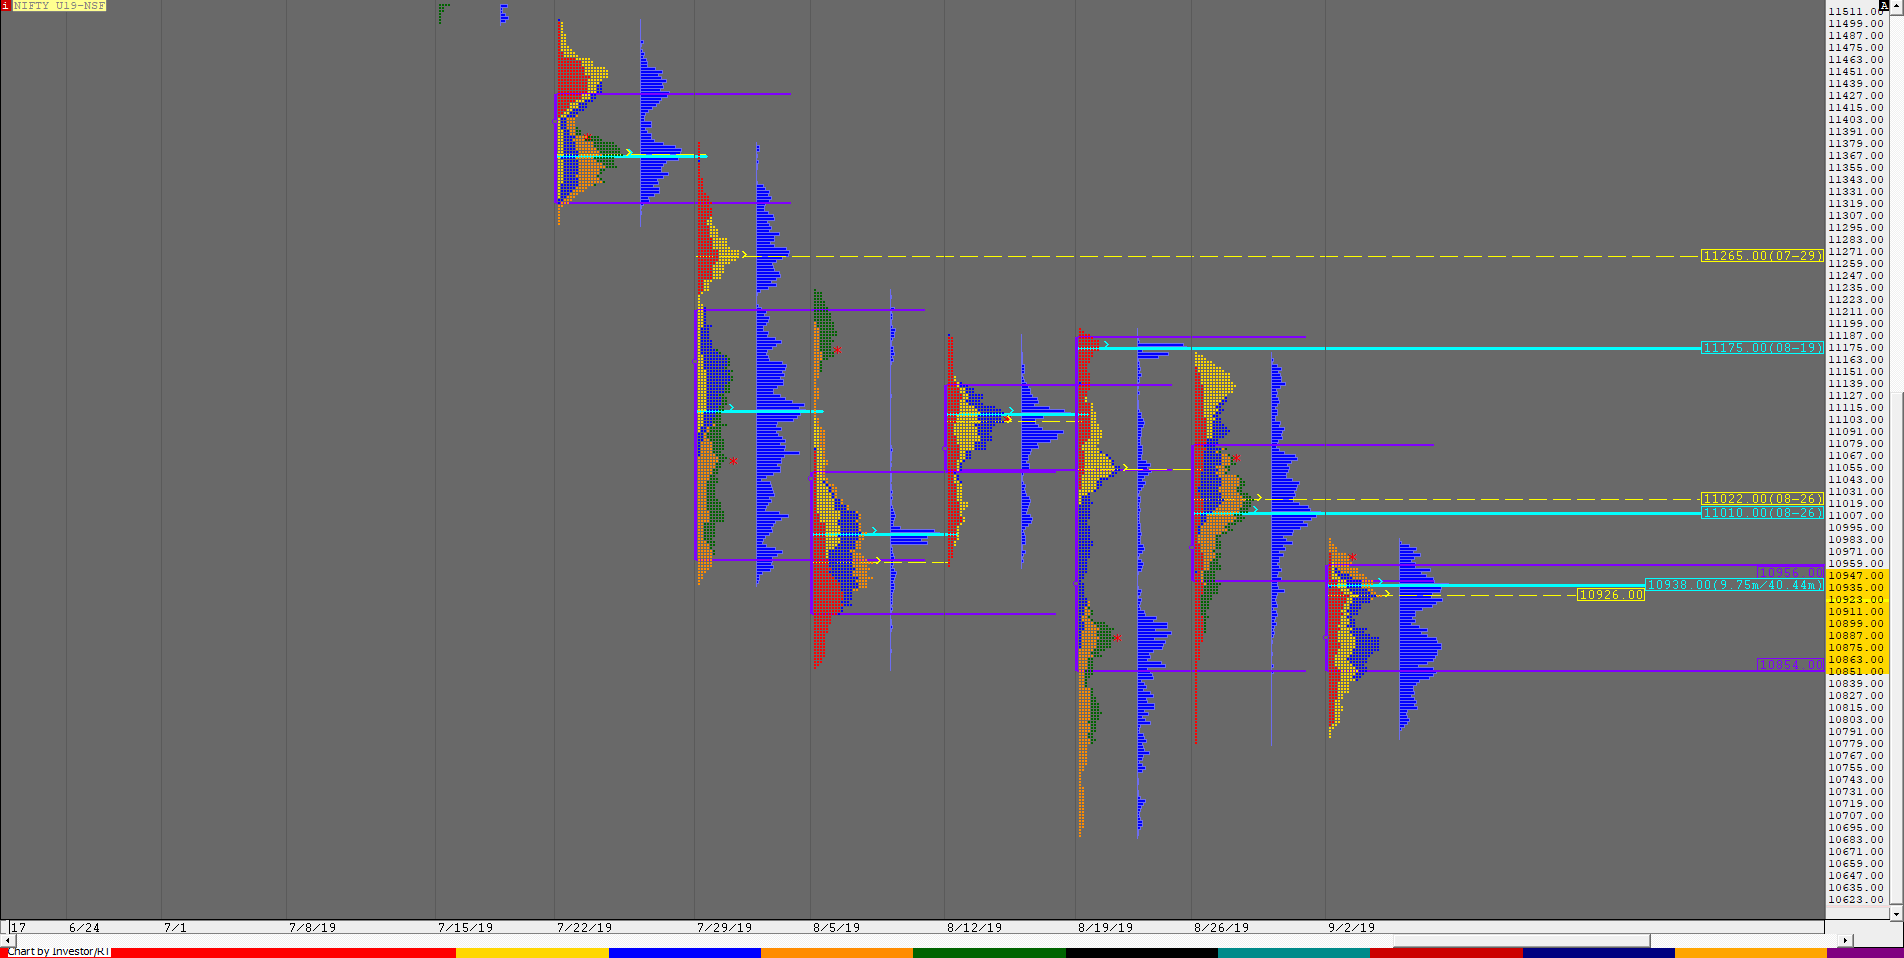
10974 [10984 / 10785]
The weekly Value was mostly lower at 10854-10926-10956 and has made an even more narrow range of just narrow range of just 102 points as compared to the previous week indicating poor trade facilitation and hence could give a move away in the coming week.
BankNifty Spot Weekly Profile (3rd to 6th September)
27248 [ 27311 / 26641 ]
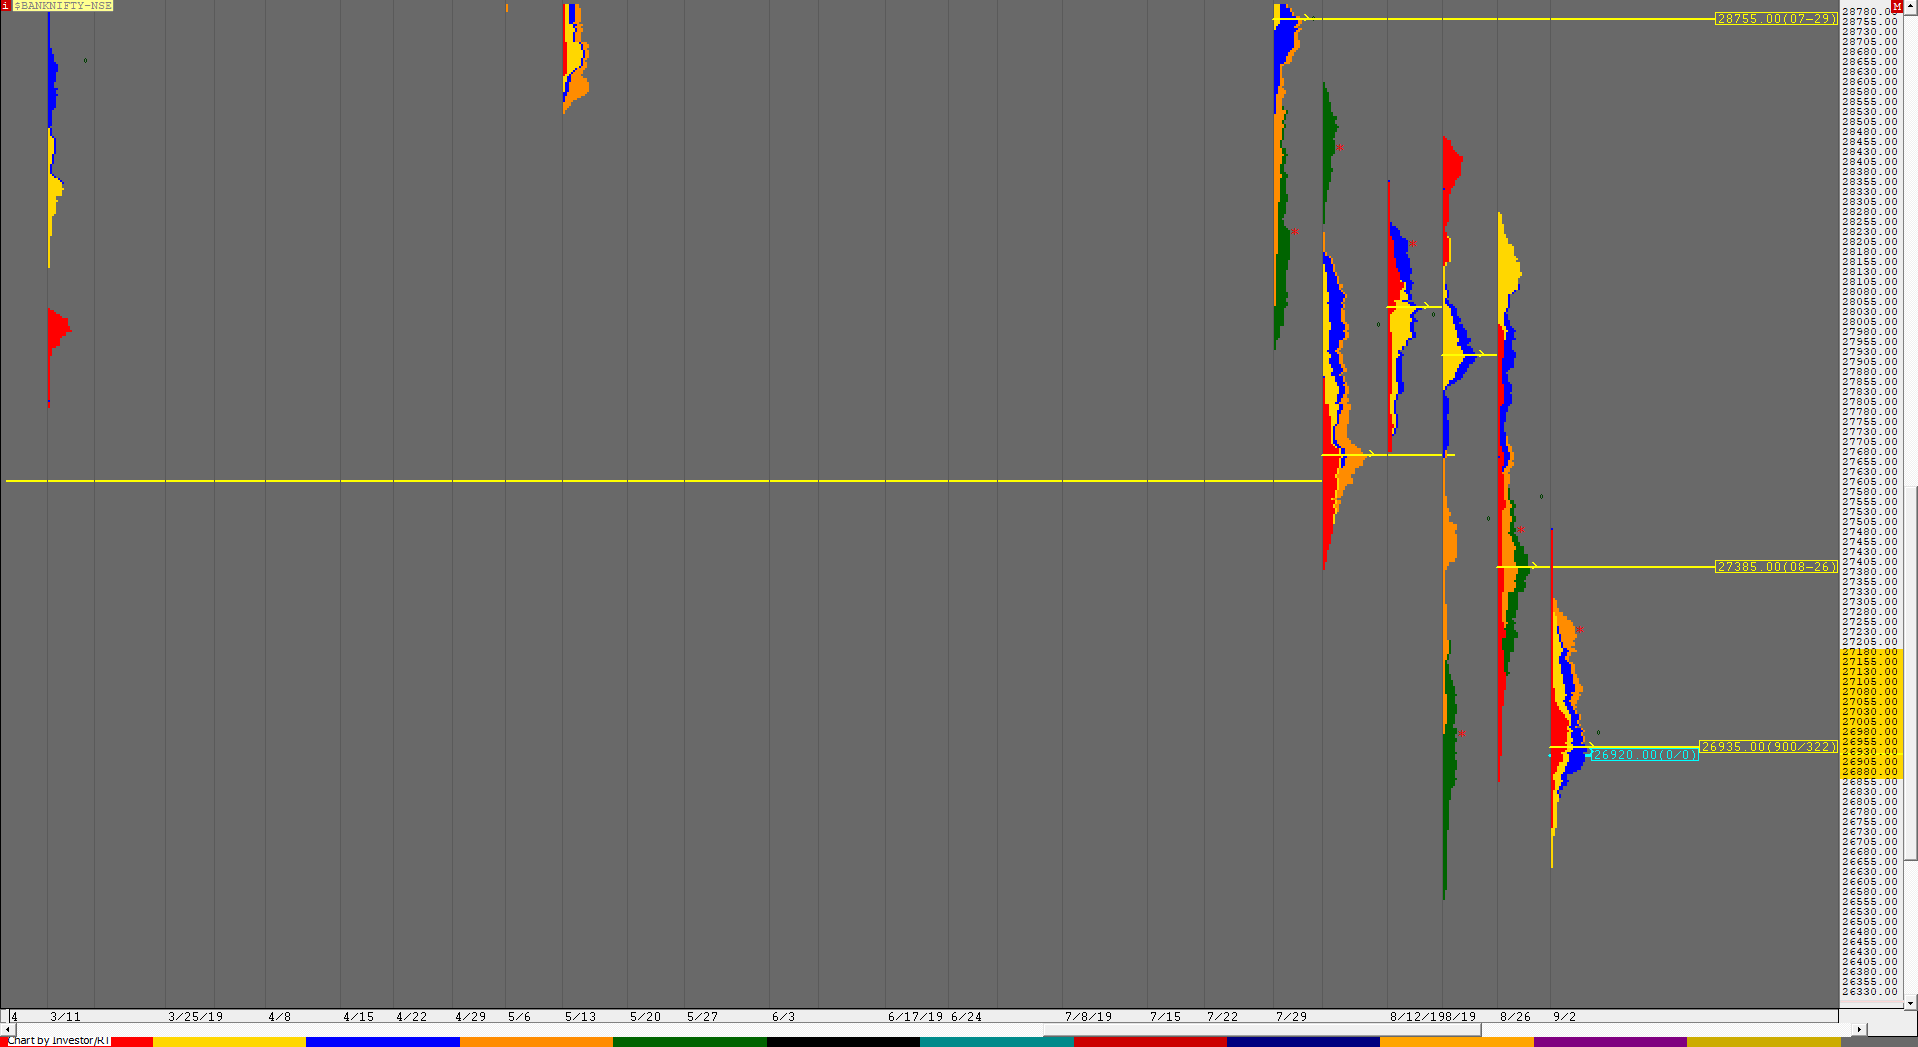
BankNity opened the week with a gap down and seemed to give a drive away from the 4 week composite Value of 27395-27975-28225 as it broke below the weekly VAL of 27080 in the first hour itself and continued this imbalance to the downside on the next day as it made a low of 26641 in the ‘A’ period but was rejected as it left a tail at lows indicating that the auction has completed this leg to the downside. BankNifty then formed a balance for the rest of the week leaving a nice 3-1-3 profile with the selling tail from 27428 to 27311 and the buying tail from 26721 to 26641. The weekly Value was lower but the range was the lowest in 10 weeks indicating that trade facilitation is getting poorer to the downside and that BankNifty may probe higher to check for supply with the first reference being the weekly VPOC of 27385. This week’s Value is 26880-26935-27180.
Weekly Hypos for Bank Nifty (Spot):
A) BankNifty needs to sustain above 27308-311 for a move to 27395 / 27474 & 27536-558
B) Immediate support is at 27221-195 below which the auction can test 27149-143 / 27061-44 & 26979-935
C) Above 27558, BankNifty can probe higher to 27596 / 27640-655 & 27720-725
D) Below 26935-920, lower levels of 26880-875 / 26815 & 26733-721 could come into play
E) If 27725 is taken out, BankNifty could rise to 27804 / 27890-896 & 27960-975
F) Break of 26721 could trigger a move lower to 26651-641 / 26570-545 & 26495-488
BNF (Weekly Profile)
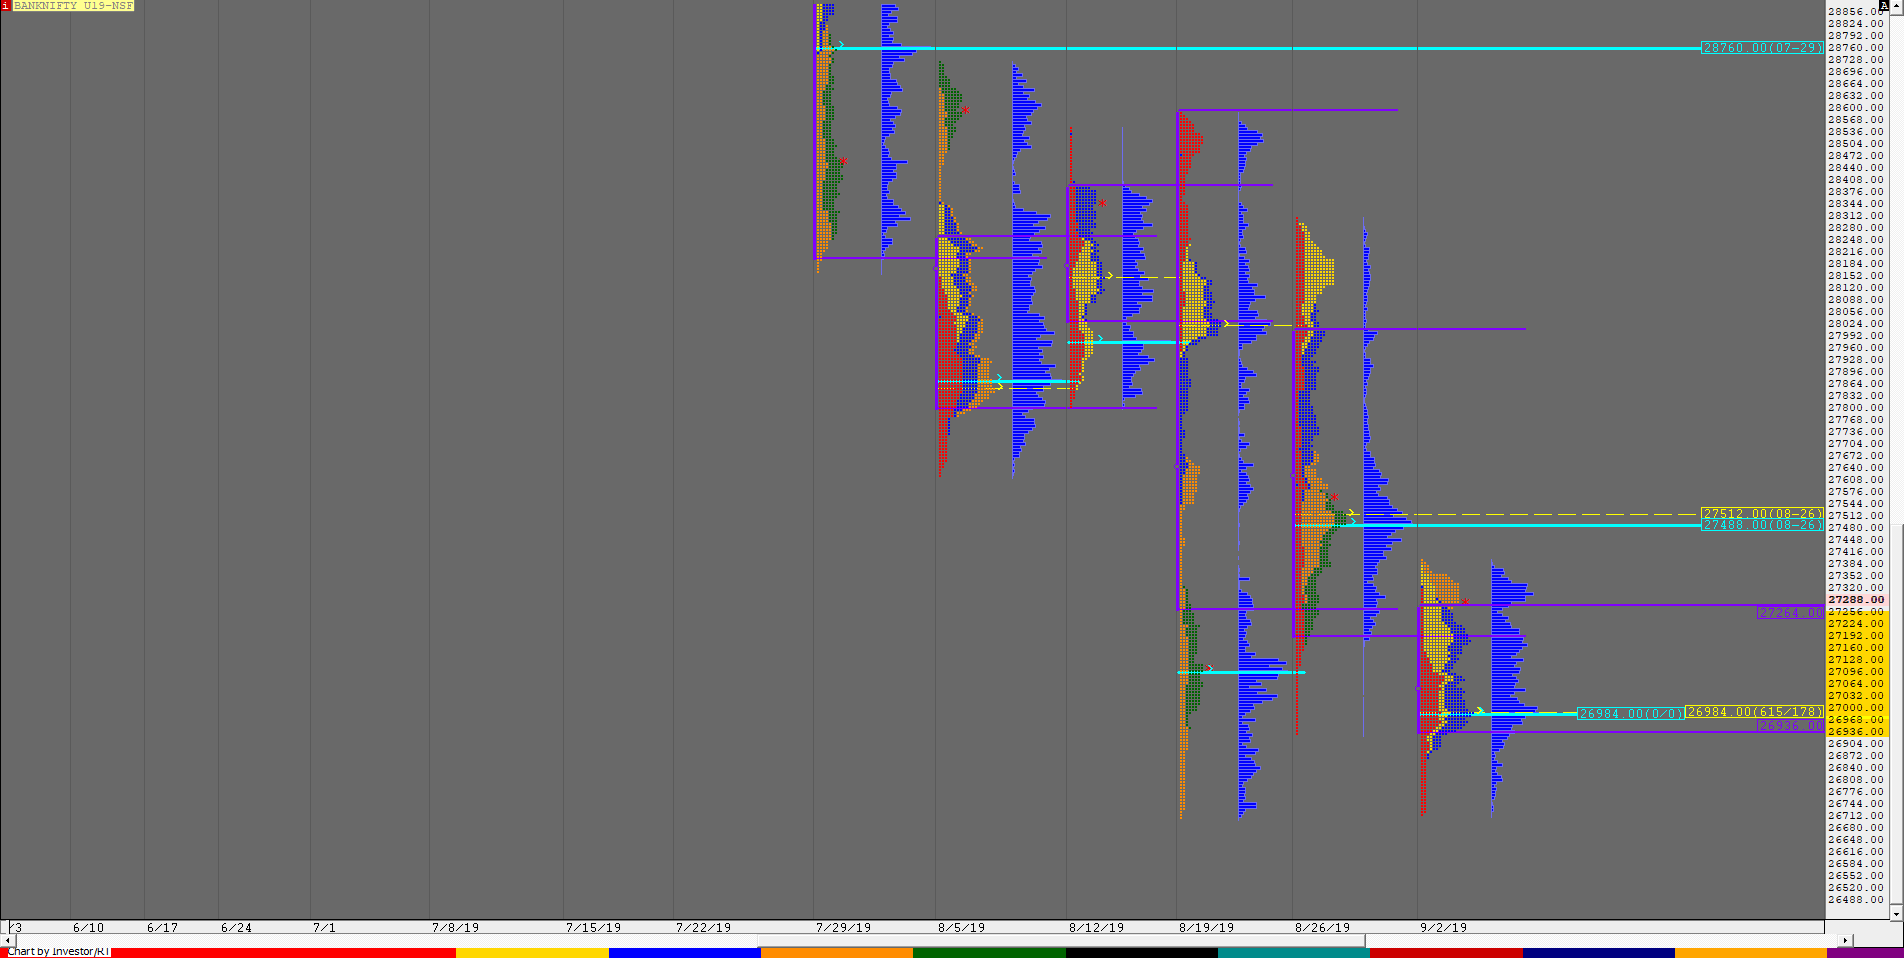
27306 [ 27398 / 26712 ]
BNF made lower Value for the week but remained in a very narrow range of just 686 points with Value at 26936-26984-27264


