Nifty Spot Weekly Profile (9th to 13th December)
Spot Weekly 12087 [ 12099 / 11832 ]
Previous week’s report ended with this ‘the PLR would remain down for the coming week with immediate reference at 11935 above which 11976 & 12046 would be the supply levels to watch out for.‘
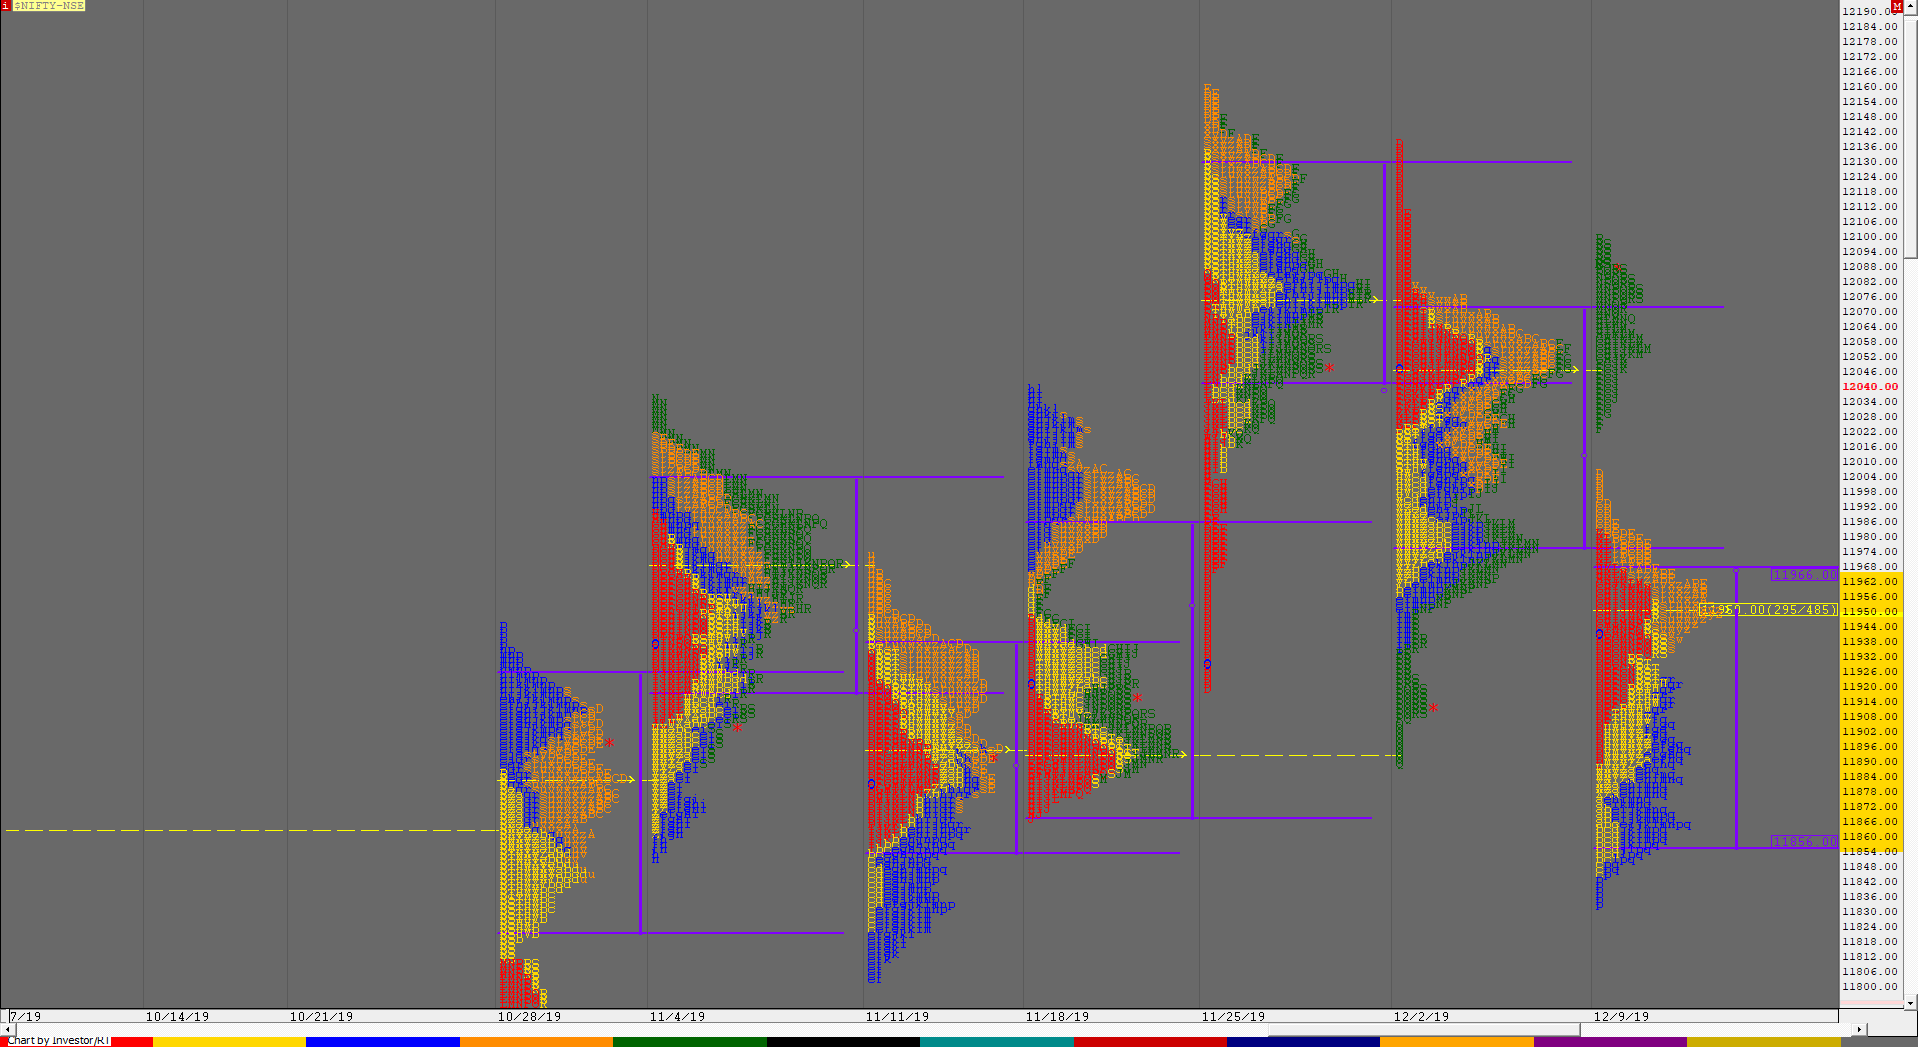
Nifty opened this week around the 11935 level where it got stalled and probed lower in the IB (Initial Balance) on Monday to hit 11888 matching the previous week’s low but did not break below it which indicated that there was no new selling coming in and this caused the auction to reverse the probe to the upside as it made multiple REs (Range Extension) to test the weekly VAL of 11976 as it made a high of 11982 but was swiftly rejected which confirmed that the initiative supply of the 6th Dec Trend Day were still active after which Nifty started a new leg to the downside as it retraced the entire move move higher to close at 11937 on Monday and gave a Trend Day down on Tuesday as it broke below previous week’s low giving a 2.5 IB extension down to 11845 before closing around the lows indicating that the imbalance to the downside is still not over. Wednesday however opened higher & began to form a balance in a narrow range staying below the IBL of 11910 of previous day in the IB and went on to make multiple attempts to break below the IBL but was unable to break below the PDL (Previous Day Low) for most part of the day which meant that the supply was being absorbed and distribution was taking place and though Nifty finally managed to make new lows for the week in the ‘K’ period as it tagged 11832 once again there was a swift rejection similar to the one at 11982 but this time it came at the lows as the auction went on to make a RE to the upside giving a Neutral Extreme Day which was a signal that the trend on the larger time frame was changing. More confirmation of this came on Thursday as Nifty opened with a gap up & took support exactly at that 11935 level but once again stalled at previous week’s VAL as it made a high of 11977 in the IB and remained in this narrow 43 point range till the ‘J’ period and once again saw action in the ‘K’ period as it made a RE on the upside and went on to make new high for the week at 12005 but saw a quick retracement towards the dPOC of 11962 into the close. Nifty opened higher once again on Friday giving a bigger gap up of more than 50 points and probed higher all day as it tagged the previous week’s POC of 12046 and competed the 80% Rule in the weekly Value after which it even tagged the FA of 12081 on exactly ‘T+6’ days making new highs of 12099 before closing the week at 12086 leaving a Neutral Extreme profile on the weekly with lower Value at 11856-11950-11966 but the close has been far away from Value so will need to see if Value comes to meet the price or the price goes to meet the Value in the coming week where the Neutral Extreme reference would be from 11982 to 12099 with a buying tail from 12024 to 11982. On the upside, we have the selling tail from 12108 to 12137 as the immediate reference which if taken out could pave the way for new All Time Highs before the year 2019 ends.
Weekly Hypos for Nifty (Spot):
A) Nifty needs to get above 12101-108 & sustain for a move to 12155 & 12208-211
B) Immediate support is at 12060-45 below which the auction could test 11991-982 / 11950-936 & 11910-881
C) Above 12211, Nifty can probe higher to 12240-265 & 12320
D) Below 11881, lower levels of 11856-830 & 11794-772 could come into play
E) If 12320 is taken out & sustained, Nifty can have a fresh leg up to 12377-380 & 12433
F) Break of 11772 could bring lower levels of 11719 & 11665
NF (Weekly Profile)
12142 [12152 / 11872]
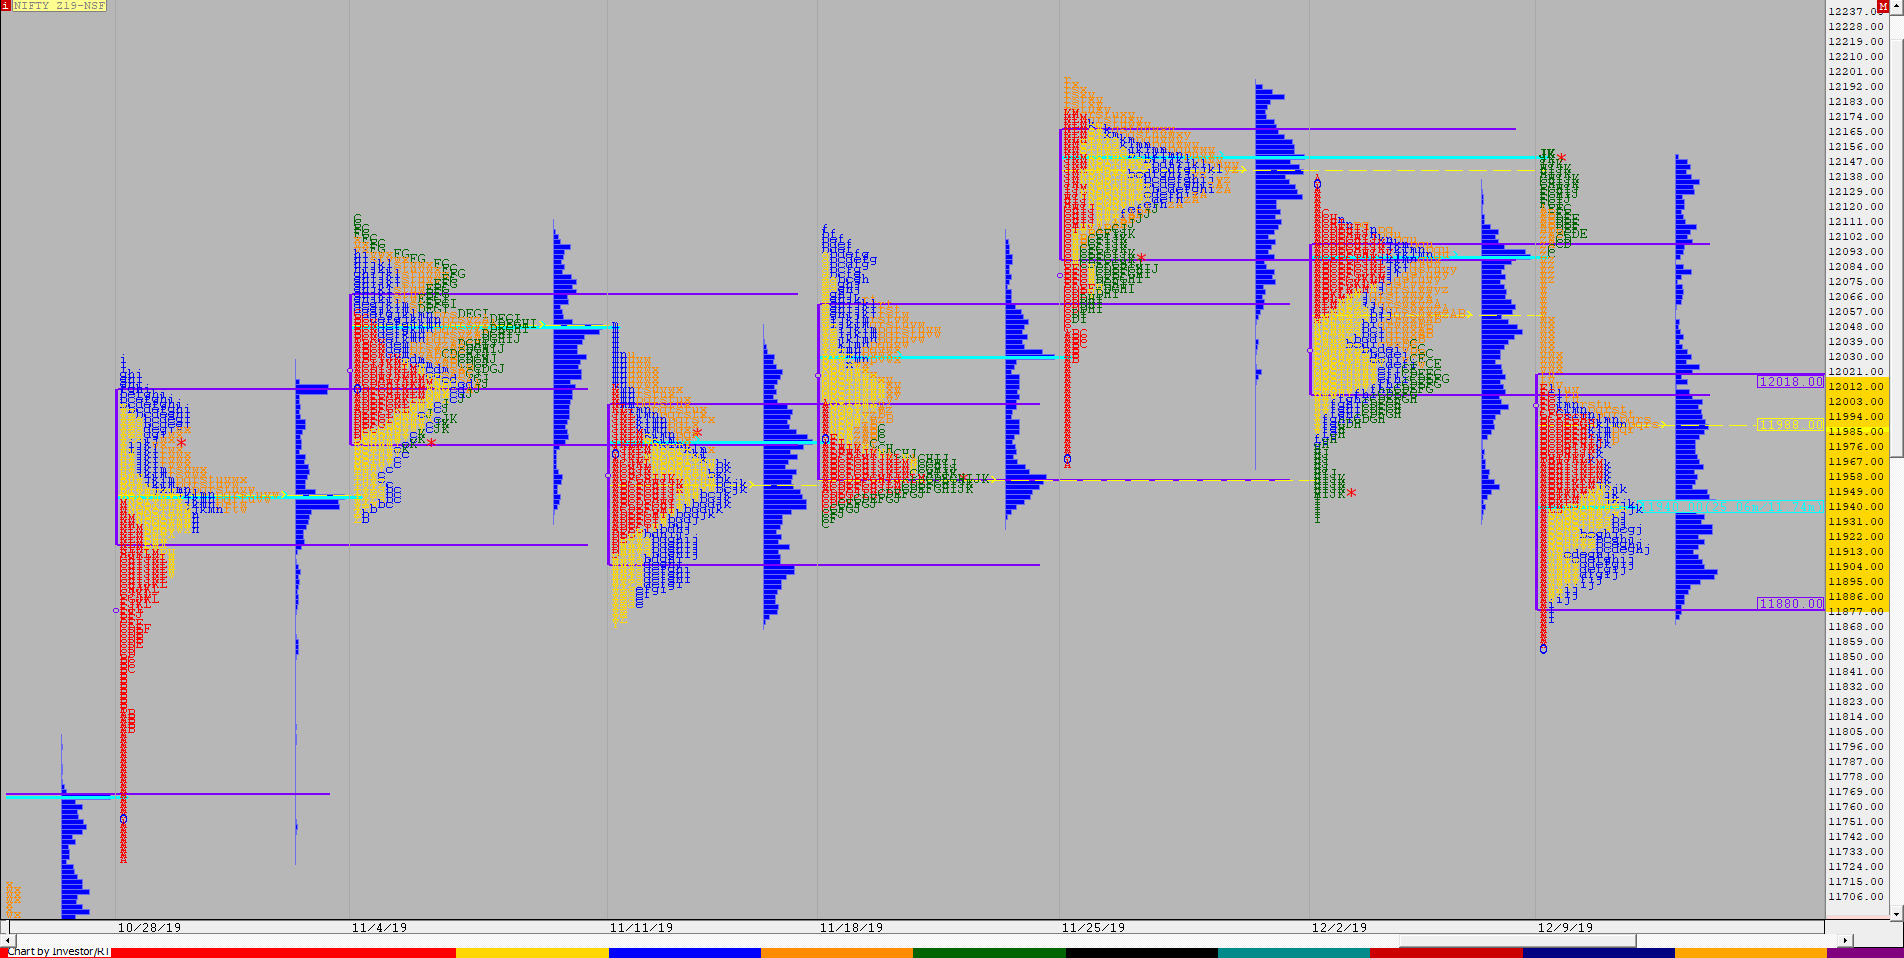
NF opened the week with a freak OL tick at 11855 which never got tagged again in the entire week as it made a balance in the first half below previous week’s Value but gave an extension handle at 12054 leaving a Neutral Extreme profile for the week as it closed near the highs of 12152. This week’s Value is at 11880-11940-12018 with prominent TPO POC at 11988 which will be the important references on the downside in the coming week.
BankNifty Spot Weekly Profile (9th to 13th December)
32014 [ 32105 / 30996 ]
Previous week’s report had ended with this ‘BankNifty has made a weekly inside bar though the profile is that of a Neutral Extreme Down with the Value overlapping to lower at 31550-31775-31905 with the Neutral Extreme reference at 31444 to 31250. The PLR remains down for the coming week with immediate support at the weekly buying tail of 31215 to 31049 below which the weekly VPOC of 30880 could come into play’
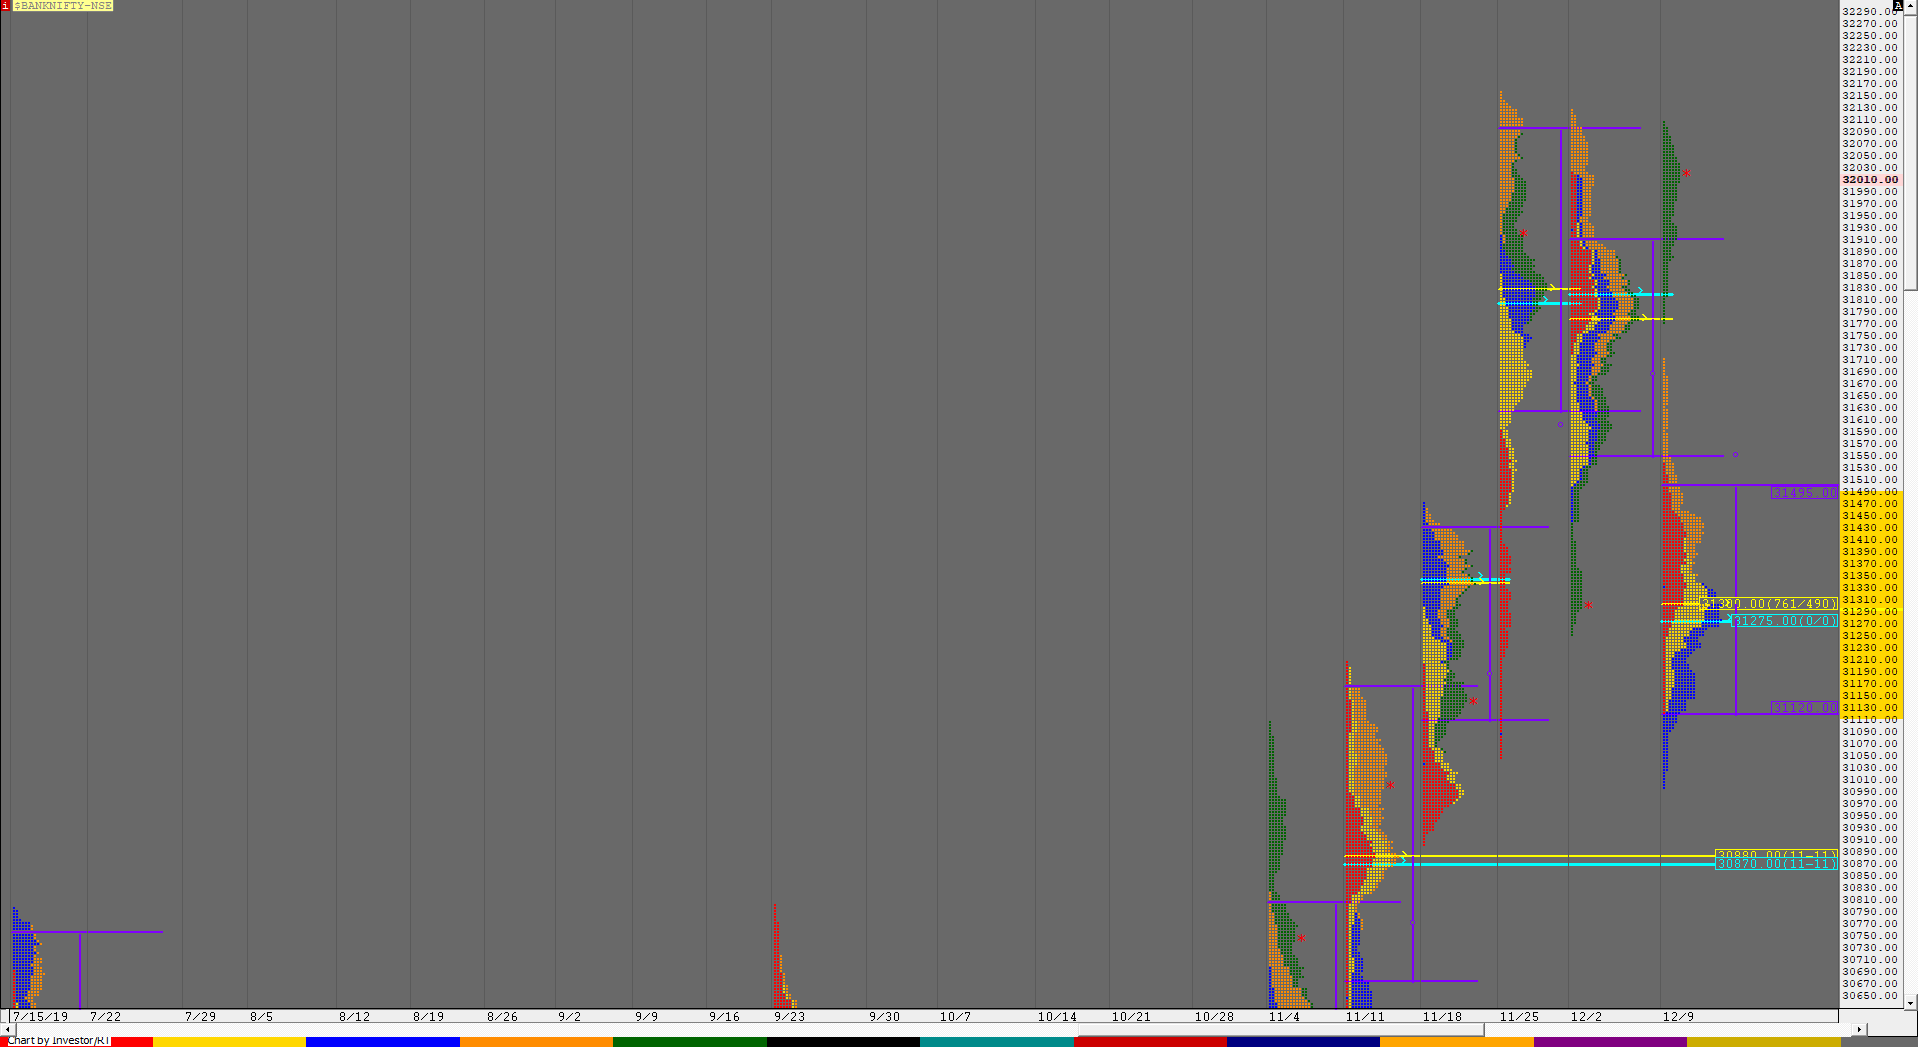
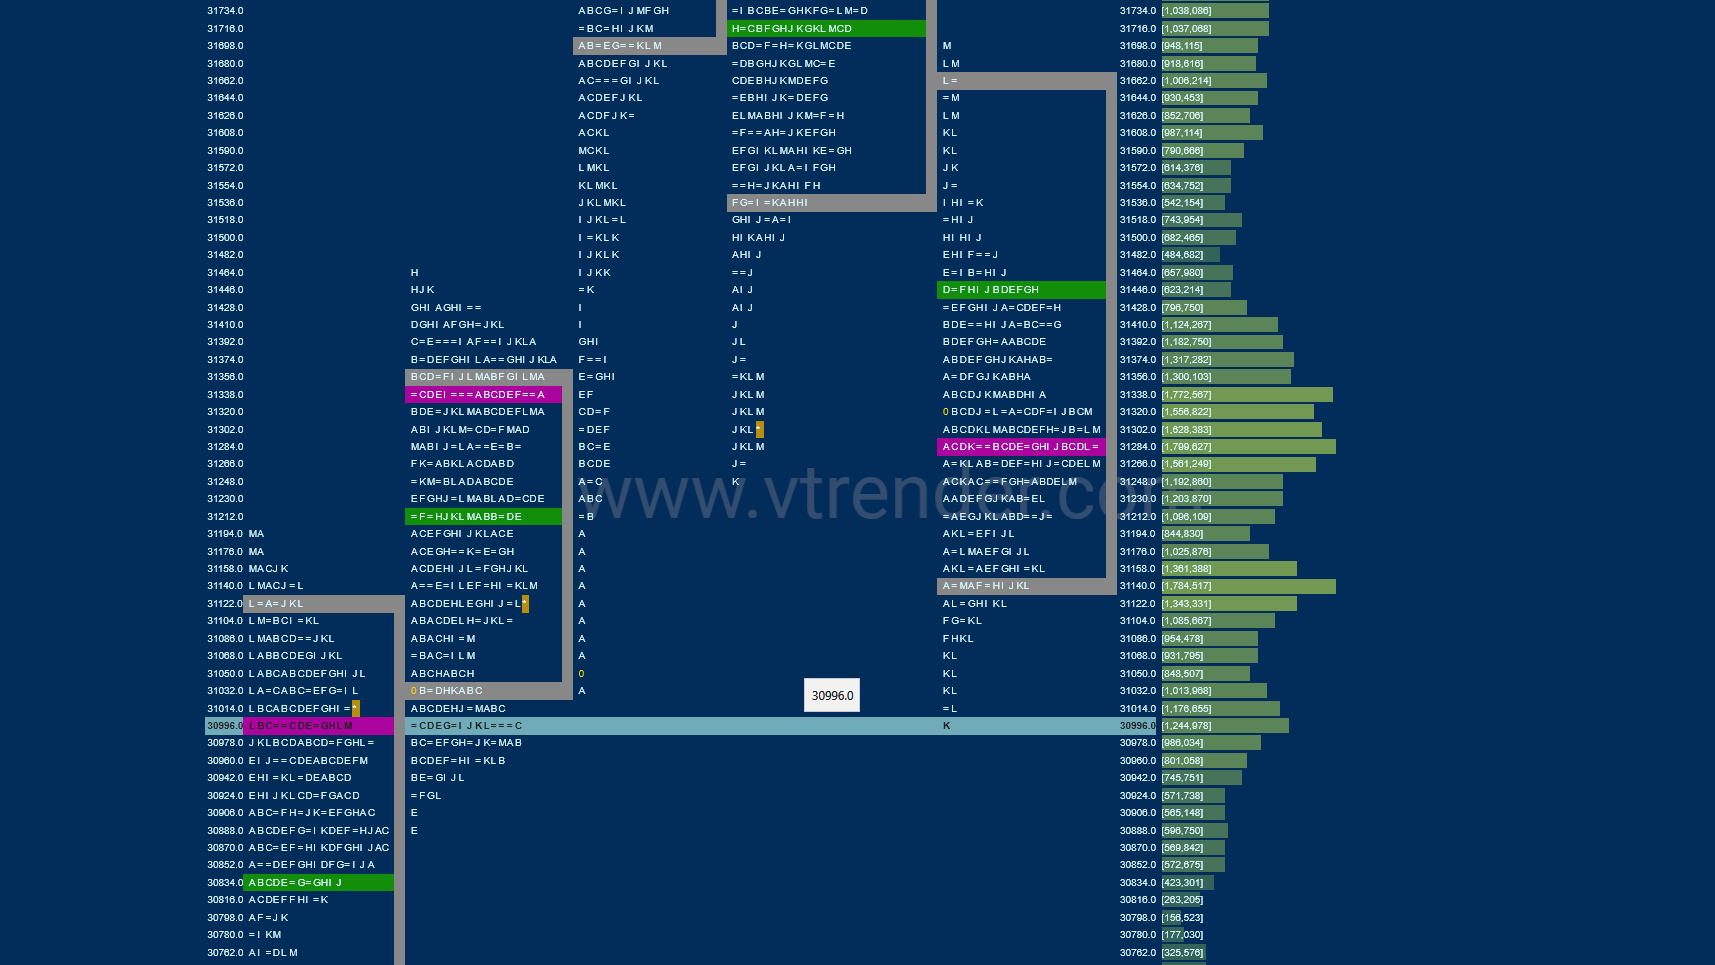
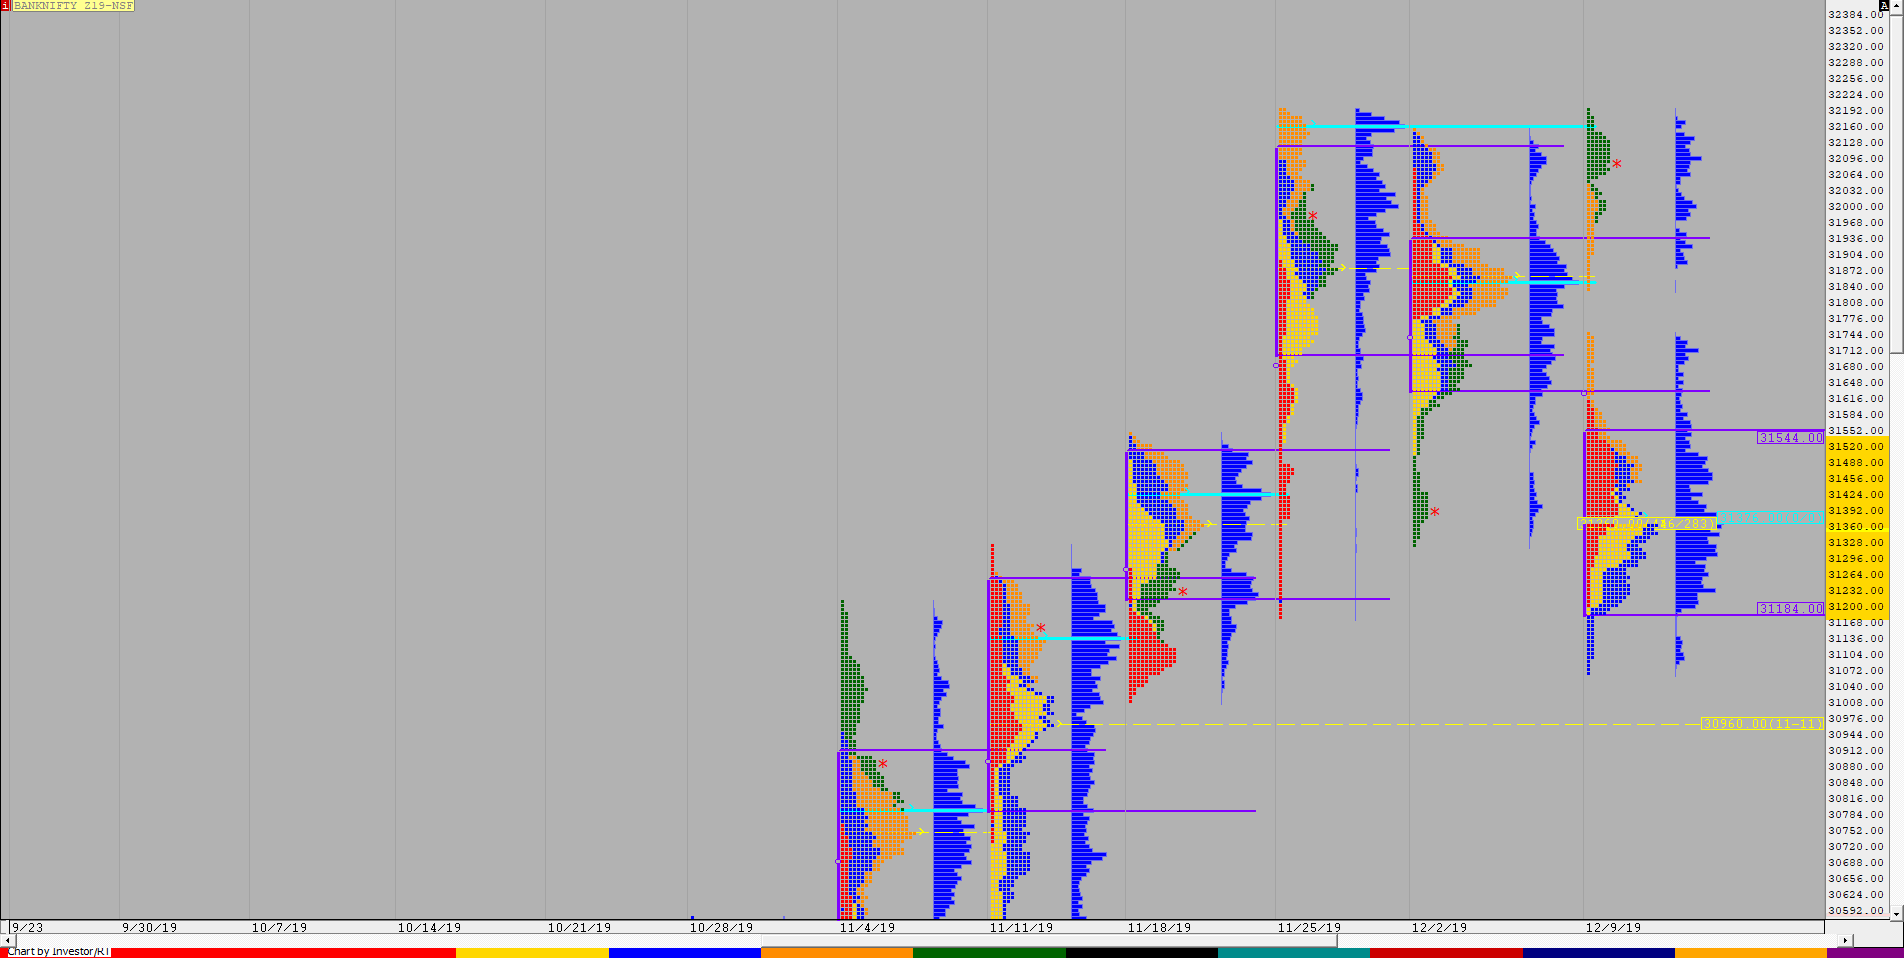
BankNifty opened the week at 31321 which was right in the middle of the Neutral Extreme reference of 31250 to 31444 and made the first probe lower as it not only broke below 31250 but also got into that weekly tail of 31215 to 31049 as it made a low of 31122 where it was swiftly rejected as it left another buying tail from the 31250 zone in the IB (Initial Balance) and in the process reversed the auction to the upside as it went on get above the Neutral Extreme reference but similar to what happened in Nifty, got stalled around the weekly VAL of 31550 as it made a high of 31538 which was a sign that the upside probe is completed as BankNifty once again probed lower almost tagging the buying tail of 31250 before closing the day at 31316. Tuesday was an inside day along with a balanced profile as the auction started getting accepted in the buying tail of 31250 to 31122 which was a bearish sign and this was followed by a break on the downside on Wednesday as BankNify made multiple REs lower to make new lows for the week as it completely traversed the previous week’s buying tail of 31250 to 31049 and went on to make lows of 30996 which was an important reference as it was a HVN (High Volume Node) from the weekly profiles of 11th to 15th Nov & 18th to 22nd Nov (image attached below) and the auction gave a quick rejection from there as it bounced by more than 250 points to close the day at 31257 suggesting that the lows were secure. This view got more confirmation the next day as BankNifty opened with a gap up of more than 100 points and was almost an OL (Open = Low) start at 31356-31352 and continued to probe higher as it got accepted in previous week’s Value which also confirmed a weekly FA at 30996 as it closed in a spike of 31620 to 31711. This imbalance continued on Friday as the auction gave yet another gap up open of 110 points and once again it was almost an OL at 31775-31770 indicating that the buyers were in complete control as they continued to probe higher getting above the weekly VAH in the IB itself after which it made multiple REs to the upside to almost tag the previous week’s high & FA of 32127 as it made a high of 32105 before closing the week at 32014 giving an elongated profile which was once again a Neutral Extreme but this week on the upside with an extension handle at 31711 and a buying tail from 31620 to 31812 which will be the important reference on the downside in the coming week. This week’s Value was completely lower at 31120-31300-31495 but the close was the highest ever in BankNifty so the PLR would be to the upside for the coming week.
Weekly Hypos for Bank Nifty (Spot):
A) BankNifty needs get above 32050 & sustain for a move to 32127-168 / 32221 & 32310-330
B) Immediate support is at 31980-952 zone below which the auction could test 31874-865 / 31810-774 & 31685
C) Above 32330, BankNifty can probe higher to 32401 / 32490 & 32581-609
D) Below 31685, lower levels of 31620-595 / 31505-495 & 31424*-418 could come into play
E) If 32609 is taken out, BankNifty could rise to 32671 / 32753-762 & 32850
F) Break of 31418 could trigger a move lower to 31330-300* / 31240 & 31155-120
G) Sustaining above 32850, the auction can tag higher levels of 32940 / 33000-035 & 33125
H) Staying below 31120, BankNifty can probe down to 31065 / 30996-950 & 30889-870*
BNF (Weekly Profile)
32004 [ 32200 / 31178 ]
BNF probed lower for the first 3 days this week as it made a balance below previous week’s Value after getting rejected from 31612 on Monday and went on to make lows of 31065 on Wednesday where it was swiftly rejected after which it made a quick probe higher over the rest of the week confirming a weekly FA at 31065 after which it went on to make new all time highs of 32230 on Friday leaving an extension handle at 31745 and has a buying tail in the weekly profile from 31911 to 31745. The weekly profile is a Neutral Extreme one with Value at 31184-31360-31544 but the PLR remains to the upside.

