Nifty Spot: 24323 [ 24401 / 23992 ]

Monday – 24142 [ 24164 / 23992 ] – Normal Variation (Up)
Tuesday – 24123 [ 24236 / 24056 ] – Normal (b shape)
Wednesday – 24286 [ 24309 / 24207 ] – Normal (p shape)
Thursday – 24302 [ 24401 / 24281 ] – Normal Variation (Down)
Friday – 24323 [ 24363 / 23168 ] – Normal Variation (Up + spike)
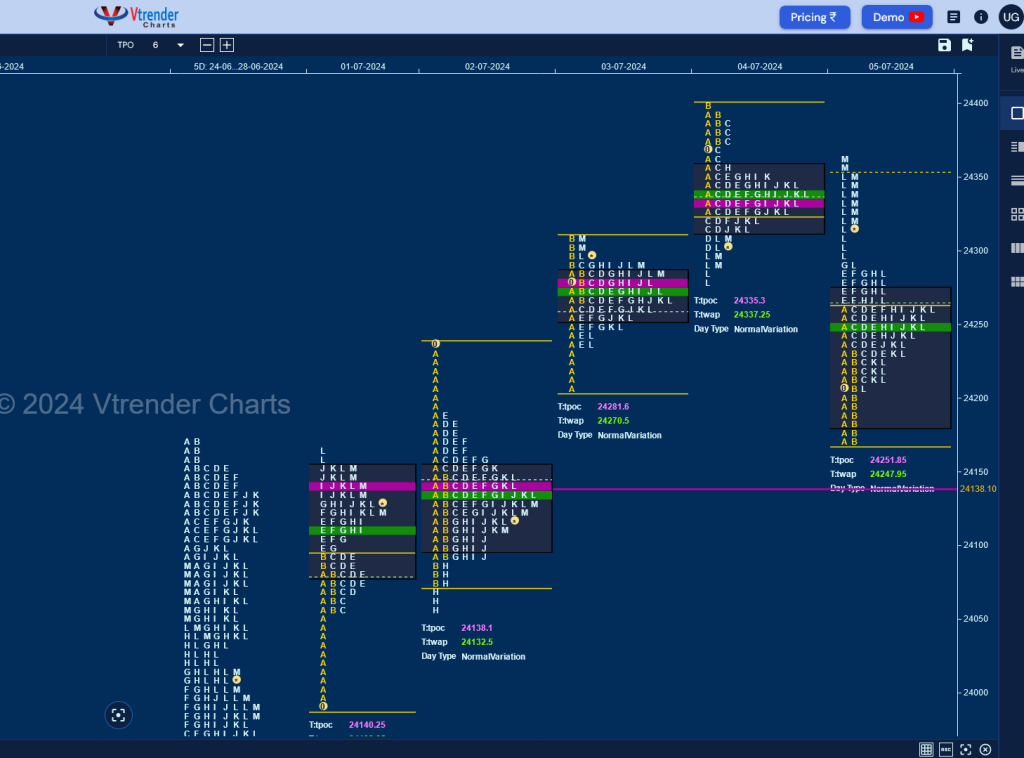
Nifty opened the week with an initiative buying tail from 24054 to 23992 on Monday but formed a ‘p’ shape profile stalling just below ATH of 24174 which was taken out with a higher open on Tuesday which it failed to sustain leaving an A period selling tail from 24236 to 24190 and taking support at Monday’s VAL establishing a nice 2-day composite (3-1-3 profile) with a prominent POC at 24137.
The auction signalled a move away from this balance with yet another gap up on Wednesday but could only form a Normal Day in a narrow 102 point range with a close near the prominent POC of 24281 and made it a hat-trick of higher opens on Thursday where it recorded new ATH of 24401 in the IB (Initial Balance) where it formed a narrow range of 82 points indicating exhaustion to the upside and made multiple REs (Range Extension) for the first time in the week confirming that the shorter term PLR (Path of Least Resistance) was now to the downside resulting in a lower open on Friday where it assembled similar lows of 24170 & 24168 in the IB taking support right above the 2-day composite Value of the first 2 days of the week suggesting that the downmove was done as it formed a balance for most part of the day creating a prominent POC at 24251 before giving a spike higher into the close from 24288 to 24363.
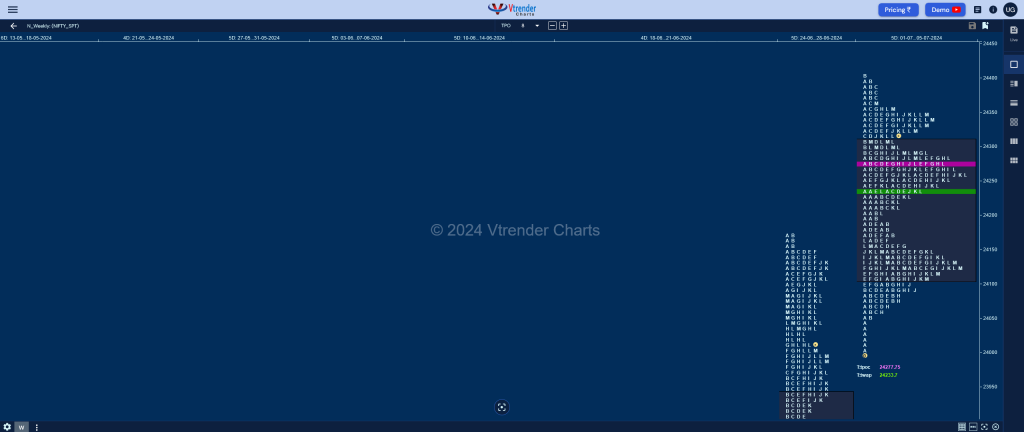
The weekly profile is a Normal Variation one to the upside with completely higher Value at 24104-24277-24309 though the range was relatively narrow at 408 points and has 3 important HVNs at 24351, 24277 & 24137 which will be on watch in the coming week for continuation of the uptrend or a start of a new balance.

Click here to view this week’s MarketProfile of Nifty on Vtrender Charts
Hypos for 08th July – 24323 [ 24363 / 23168 ] – Normal Variation (spike)
| Up |
| 24341 – 04 Jul H/B 24372 – SOC (04 Jul) 24437 – 1 ATR (yPOC 24251) 24474 – 1 ATR (EH 24288) 24527 – 1 ATR (24341) |
| Down |
| 24314 – Closing singles 24251 – POC (05 Jul) 24200 – B TPO h/b (05 Jul) 24146 – 02 Jul H/B 24110 – PBL (02 Jul) |
Hypos for 09th July – 24320 [ 24344 / 24240 ] – Neutral
| Up |
| 24338 – 08 Jul IBH 24372 – SOC (04 Jul) 24427 – 1 ATR (FA 24240) 24475 – 1 ATR (yPOC 24292) 24521 – 1 ATR (24338) |
| Down |
| 24309 – VAH (08 Jul) 24240 – FA (08 Jul) 24200 – B TPO h/b (05 Jul) 24146 – 02 Jul H/B 24110 – PBL (02 Jul) |
Hypos for 10th July – 24433 [ 24443 / 24332 ] – Double Distribution
| Up |
| 24427 – M TPO halfback 24477 – 1 ATR (yPOC 24292) 24535 – Weekly 3 IB 24589 – 1 ATR (EH 24404) 24628 – 1 ATR (PDH 24443) |
| Down |
| 24404 – Ext Handle (09 Jul) 24360 – C TPO h/b (09 Jul) 24329 – 4-day VAH (03-08 Jul) 24277 – 4-day VPOC (03-08 Jul) 24239 – 4-day VAL (03-08 Jul) |
Hypos for 11th July – 24324 [ 24461 / 24141 ] – Outside Day (b shape)
| Up |
| 24346 – Mid-profile tail (10 Jul) 24383 – Ext Handle (10 Jul) 24421 – A TPO h/b (10 Jul) 24471 – 1 ATR (yPOC 24281) 24535 – Weekly 3 IB 24573 – 1 ATR (EH 24383) |
| Down |
| 24310 – M TPO low (10 Jul) 24281 – POC (10 Jul) 24229 – SOC (10 Jul) 24173 – Buy tail (10 Jul) 24137 – 3-day VPOC (28Jun-02Jul) 24075 – 3-day VAL (28Jun-02Jul) |
Hypos for 12th July – 24315 [ 24402 / 24193 ] – Normal Variation
| Up |
| 24338 – 2-day VAH (10-11 Jul) 24383 – Ext Handle (10 Jul) 24421 – A TPO h/b (10 Jul) 24471 – 1 ATR (hvn 24281) 24535 – Weekly 3 IB 24573 – 1 ATR (EH 24383) |
| Down |
| 24312 – L TPO h/b (11 Jul) 24262 – 2-day POC (10-11 Jul) 24228 – 2-day VAL (10-11 Jul) 24173 – Buy tail (10 Jul) 24137 – 3-day VPOC (28Jun-02Jul) 24075 – 3-day VAL (28Jun-02Jul) |
BankNifty Spot: 52660 [ 53357 / 51996 ]

Monday – 52574 [ 52656 / 52166 ] Normal (p shape)
Tuesday – 52168 [ 52828 / 51996 ] – Normal (b shape)
Wednesday – 53089 [ 53256 / 52482 ] – Normal (p shape)
Thursday – 53103 [ 53357 / 52816 ] – Normal Variation (Down)
Friday – 52660 [ 52817 / 52290 ] – Normal
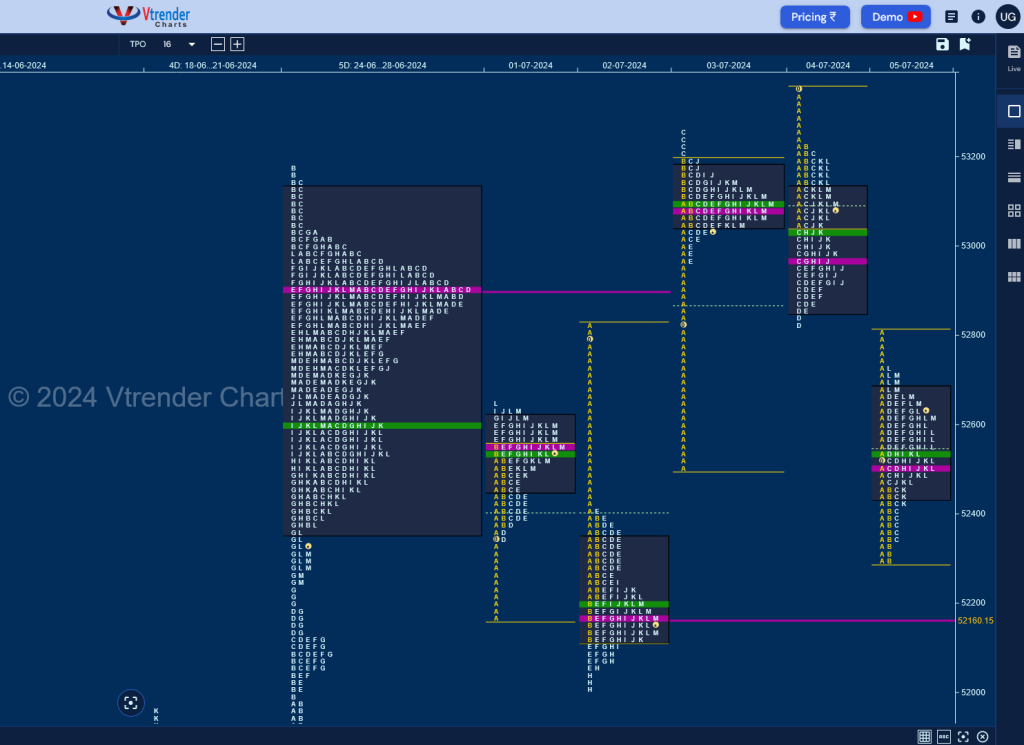
BankNifty opened the week with a probe below previous value but left an initiative buying tail from 52338 to 52166 and formed a ‘p’ shape profile for the day with a close around the prominent POC of 52558 making marginal REs to the upside and followed it up with a higher open on Tuesday which got rejected right below the RO point of 52830 as it left a long initiative selling tail from 52828 to 52412 resulting in new lows for the week at 51996 putting in place an Outside Day and a ‘b’ shape profile holding just above the monthly swing reference of 51957 from June and closing around the prominent POC of 52160.
The auction then not only rejected the lower Value of Tuesday with a huge gap up of 704 points on Wednesday but left a long A period buying tail from 52967 to 52482 in the probe lower which helped it to make marginal new ATH of 53201 in the B TPO after which it made the dreaded C side extension to 53256 which marked the end of the upside for the day which coiled for the rest of the TPOs leaving a perfect ‘p’ shape profile with a prominent POC at 53100 from where it made another higher open on Thursday recording new ATH of 53357 but assembled an OH (Open=High) start signalling lack of demand triggering a probe back in previous day’s value and tested the buying tail while making a low of 52815 as it seemed to take support at the RO point giving a retracement back to 53100 into the close leaving a ‘b’ shape profile.
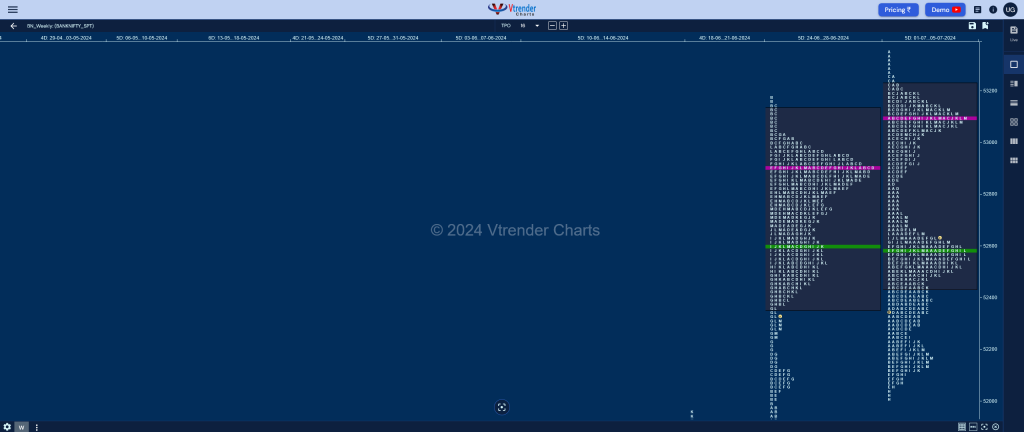
Friday saw a lower open as BankNifty negated the A TPO singles of Wednesday and got into the Value of Tuesday but casted exact lows of 52290 in the IB displaying exhaustion to the downside and formed a Normal Day with a probe back to 52715 into the close validating a Neutral set up for the week with mostly overlapping value at 52436-53100-53225 with a close near the HVN of 52558 which will be the immediate support for the coming week staying above which it could fill up the zone upto 53100 before giving a move away from this balance.

Hypos for 08th July – 52660 [ 52817 / 52290 ] – Normal
| Up |
| 52668 – M TPO h/b 52832 – Gap mid (05 Jul) 52961 – VPOC (04 Jul) 53100 – 2-day VPOC (03-04 Jul) 53256 – Jul Sell tail 53357 – ATH (04 Jul) |
| Down |
| 52558 – Weekly HVN 52432 – C TPO h/b (05 Jul) 52290 – PDL 52160 – VPOC (02 Jul) 52057 – Buy tail (02 Jul) 51957 – Daily Ext Handle |
Hypos for 09th July – 52425 [ 52710 / 52246 ] Normal
| Up |
| 52442 – M TPO h/b 52574 – C TPO h/b 52732 – Sell Tail (05 Jul) 52832 – Gap mid (05 Jul) 52961 – VPOC (04 Jul) 53100 – 2-day VPOC (03-04 Jul) |
| Down |
| 52411 – POC (08 Jul) 52246 – PDL 52160 – VPOC (02 Jul) 52057 – Buy tail (02 Jul) 51957 – Daily Ext Handle 51784 – Ext Handle (25 Jun) |
Hypos for 10th July – 52568 [ 52626 / 52293 ] – Normal (p shape)
| Up |
| 52605 – 3-day VAH (05-09 Jul) 52732 – Sell Tail (05 Jul) 52832 – Gap mid (05 Jul) 52961 – VPOC (04 Jul) 53100 – 2-day VPOC (03-04 Jul) 53256 – Jul Sell tail |
| Down |
| 52545 – 3-day POC (05-09 Jul) 52407 – 3-day VAL (05-09 Jul) 52246 – Swing Low (08 Jul) 52160 – VPOC (02 Jul) 52057 – Buy tail (02 Jul) 51957 – Daily Ext Handle |
Hypos for 11th July – 52189 [ 52528 / 52075 ] – Normal (b shape)
| Up |
| 52197 – M TPO h/b (10 Jul) 52295 – 10 Jul H/B 52406 – 3-day VAL (05-09 Jul) 52545 – VPOC (09 Jul) 52732 – Sell Tail (05 Jul) 52832 – Gap mid (05 Jul) |
| Down |
| 52160 – M TPO low (10 Jul) 52057 – Buy tail (02 Jul) 51957 – Daily Ext Handle 51784 – Ext Handle (25 Jun) 51635 – VPOC (24 Jun) 51506 – D TPO h/b (24 Jun) |
Hypos for 12th July – 52270 [ 52400 / 51749 ] – Normal Variation
| Up |
| 52295 – M TPO h/b (11 Jul) 52406 – 3-day VAL (05-09 Jul) 52545 – VPOC (09 Jul) 52732 – Sell Tail (05 Jul) 52832 – Gap mid (05 Jul) 52961 – VPOC (04 Jul) |
| Down |
| 52237 – L TPO h/b (11 Jul) 52072 – 11 Jul H/B 51926 – POC (11 Jul) 51768 – Buy tail (11 Jul) 51635 – VPOC (24 Jun) 51506 – D TPO h/b (24 Jun) |
Click here to view this week’s MarketProfile of BankNifty on Vtrender Charts
