Nifty Spot: 22493 [ 22525 / 22224 ]

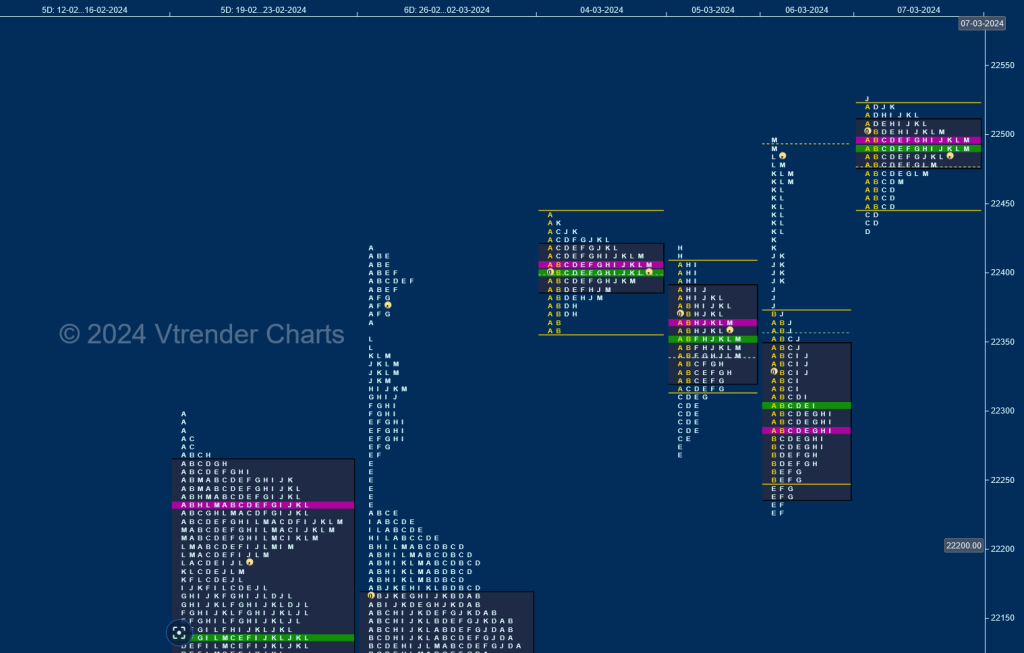
Nifty recorded new ATH of 22440 on Monday but settled down into an Open Auction as it remained in the narrow 83 point A period range all day displaying poor trade facilitation and probed lower over the next 2 days making lower lows of 22269 & 22224 stalling right above 01st Mar’s extension handle of 22222 where it left poor lows on Wednesday marking the end of the downside as it was also rejecting entry into previous month’s VAH.
The auction then went on to leave a Neutral Extreme profile to the up on the daily timeframe hitting new ATH of 22497 on Wednesday and followed it up with new highs of 22524 at open on Thursday but turned back into balance mode leaving a narrow 96 point range Neutral Centre Day with a close right at the ultra prominent POC of 22494 which will be the opening reference for the coming week.
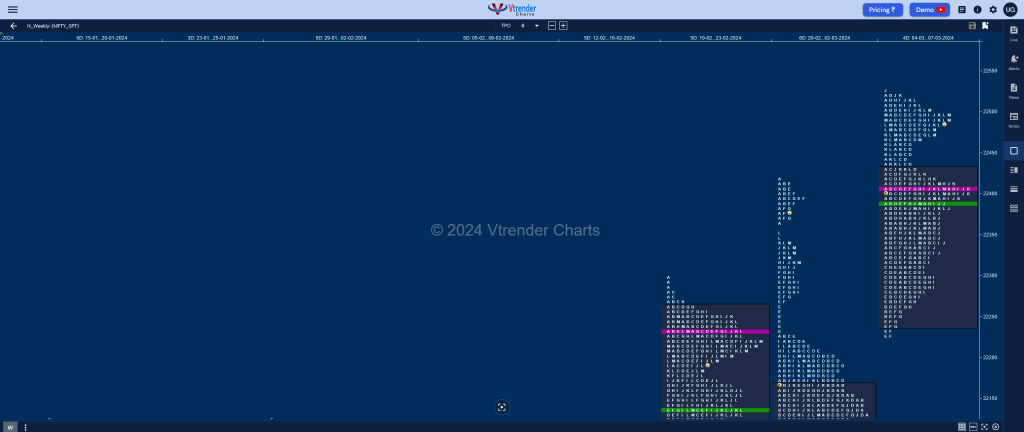
Value for this week was completely higher at 22240-22405-22431 as Nifty formed a Neutral Extreme profile to the upside with a closing TPO HVN at 22494 staying above which it would be on for the higher objective of 22750 in the coming week whereas on the downside, the first major support would be the developing monthly POC at 22395 and a break of that could bring in a test of the 06th Mar’s VPOC of 22286.

Click here to view this week’s MarketProfile of Nifty on Vtrender Charts
Weekly Hypos
| Up |
| 22524 – IBH (07 Mar) 22585 – 1 ATR (MPOC 22395) 22620 – 1 ATR (FA 22430) 22666 – 2 ATR (VPOC 22286) 22716 – 1 ATR (PDH 22525) 22750 – 1 ATR (WFA 22229) |
| Down |
| 22464 – M TPO low 22412 – Ext Handle (06 Mar) 22369 – Ext Handle (06 Mar) 22306 – I TPO h/b 22266 – SOC (06 Mar) 22222 – Ext Handle (01 Mar) |
BankNifty Spot: 47835 [ 48161 / 47191 ]

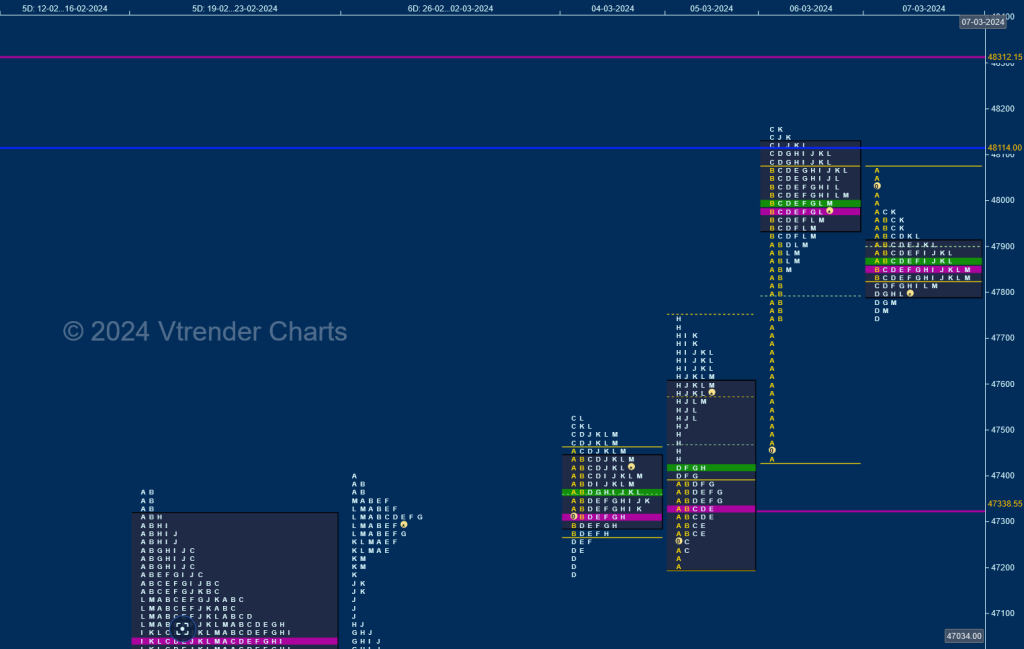
BankNifty started the week with a narrow range balance on Monday and first half of Tuesday taking support just above previous week’s higher extension handle of 47174 while making a low of 47191 and built a prominent POC at 47320 before giving a move away with a fresh extension handle at 47429 as it made new highs of 47737.
The auction then gave a retracement back to 47442 at open on Wednesday where it saw demand defending the level of 47429 and this in turn triggered a fresh imbalance to new highs of 48074 in the IB (Initial Balance) which was followed by a typical C side extension tagging Jan’s VPOC of 48119 while making a high of 48155 after which it turned back into a balance mode for the rest of the day forming a ‘p’ shape profile with a prominent POC at 47987 where it left an A period selling tail on Thursday forming a narrow range ‘b’ shape profile making a low of 47747 taking support right above Wednesday’s singles from 47739 leaving yet another prominent POC at 47855.
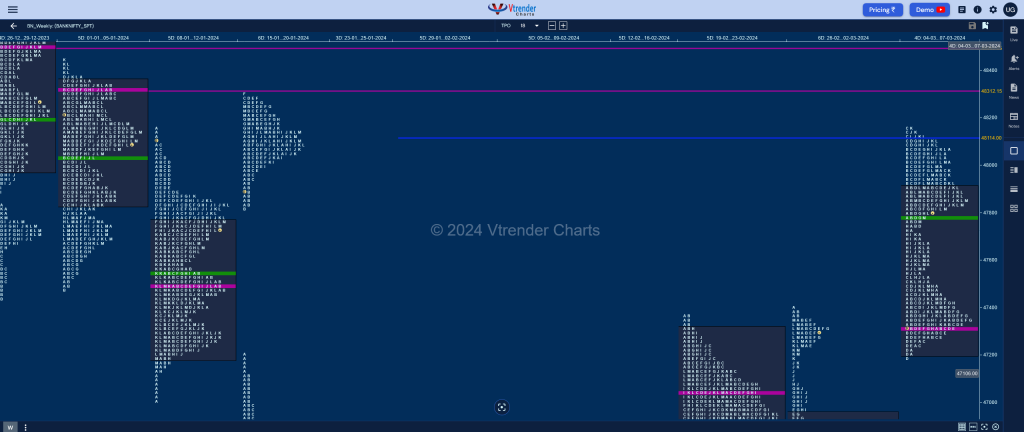
BankNifty has formed a Double Distribution Trend Up weekly profile with completely higher Value at 47196-47320-47915 closing near the upper distribution TPO HVN of 47855 which will be the opening reference for the coming week and will need to take out the level of 47987 on the upside to continue towards the weekly VPOCs of 48312 & 48492 whereas on the downside, break of 47739 could bring about a test of 47475 & 47320.

Click here to view this week’s MarketProfile of BankNifty on Vtrender Charts
Weekly Hypos
| Up |
| 47855 – POC (07 Mar) 47987 – POC (06 Mar) 48155 – Sell tail (06 Mar) 48312 – Weekly VPOC (01-05 Jan) 48492 – Weekly VPOC (26-29 Dec) 48614 – Selling tail (28 Dec) |
| Down |
| 47792 – 2-day VAL (06-07 Mar) 47619 – 3-day Anomaly (02-05 Mar) 47475 – 2-day VAH (04-05 Mar) 47338 – VPOC (05 Mar) 47174 – Ext Handle (01 Mar) 47029 – VPOC (01 Mar) |
