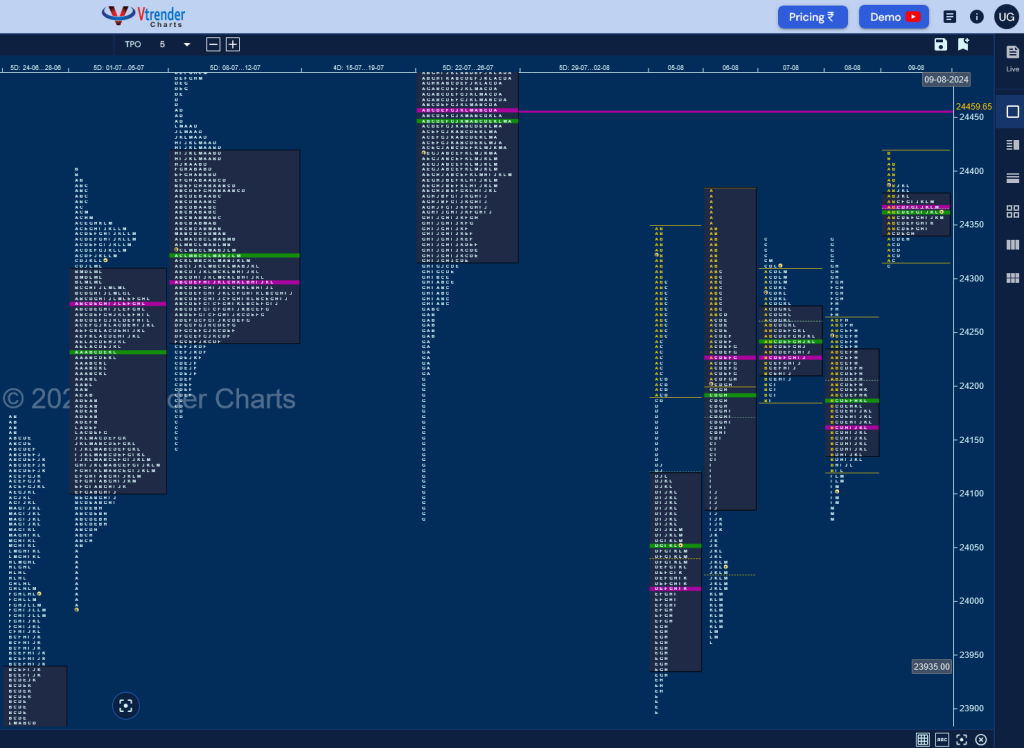
Nifty Spot: 24365 [ 24419 / 23893 ] Normal (Gaussian Curve)
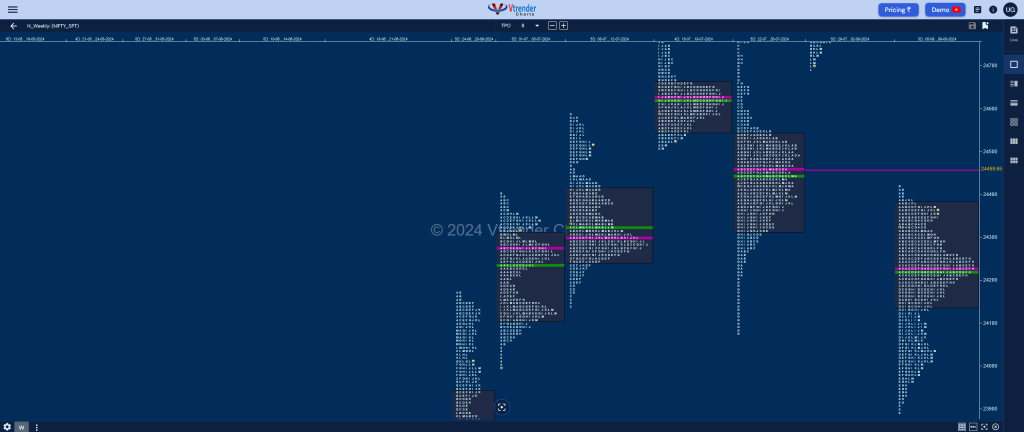
Previous week’s report ended with this ‘The weekly profile is a Neutral Extreme profile to the downside but with completely higher Value at 24782-24935-24963 and is a rare case when the NeuX is also giving a nice Gaussian Curve so has a very good chance to give a follow down and completing the 80% Rule in previous week’s Value from 24548 to 24319 with the final objective on the downside for the coming week being at 24137 which is the 1 ATR downside objective from the negated weekly FA of 24774 which is now a Swing supply point‘

Monday – 24055 [ 24350 / 23893 ] – Trend (Down)
Tuesday –23992 [ 24382 / 23960 ] – Trend (Down)
Wednesday – 24297 [ 24337 / 24185 ] – Normal (Inside Bar)
Thursday – 24117 [ 24340 / 24079 ] – Neutral Extreme (Down)
Friday – 24365 [ 24419 / 24311 ] – Normal
Nifty not only opened the week with a big 415 point gap down but continued to trend lower for the first half of Monday as it broke below 24137 and went on to test the 27th Jun VPOC of 23950 while making a low of 23893 taking support just above June’s closing extension handle of 23887 marking the end of the downside as it turned back into balance mode closing the day at 24055 which was followed by an uncharacteristic gap up and a look up above Monday’s high in the A period on Tuesday which was swiftly rejected from just below the daily VPOC of 24391 (25 Jul) as the auction formed yet another Trend Day Down dropping lower to 23960 into the close.
The rare occurrence of 2 back to back elongated profiles was calling for a balance which came in form of a narrow 153 point range Inside Bar & a Normal profile on Wednesday where it formed overlapping POC at 24228 and was followed by an Outside Bar on Thursday which was also a Neutral Extreme (NeuX) Day Down which got rejected in the look up above PDH recording a high of 24340 in the G TPO and went on to drop by 260 points in the second half making a low of 24079 but on the higher timeframe had formed a nice balance with Value at 24139-24229-24284.
Friday open saw a re-confirmation of the fact that NeuX rarely give a follow up as Nifty opened with another big gap up of 269 points confirming a move away from the balance and went on to scale above 24391 while making new highs for the week at 24419 but could not extend any further post the Initial Balance closing the week with a mere 109 point range Normal Day closing right at the prominent POC of 24365. The weekly profile is also a well balanced Normal one but has an initiative selling tail from 24409 to 24696 due to the gap down open and has formed completely lower Value at 24138-24229-24379 with a close near the VAH so will be interesting to watch how the auction shapes up in the coming sessions with the weekly VPOC of 24459 being the upside reference above 24409 whereas on the downside, 24284 will be the important support level on watch.

Click here to view this week’s MarketProfile of Nifty on Vtrender Charts
Hypos for 12th Aug – 24365 [ 24419 / 24311 ] – Normal
| Up |
| 24365 – POC (09 Aug) 24409 – Sell Tail (09 Aug) 24459 – Weekly VPOC (22-26 Jul) 24510 – Gap mid (05 Aug) 24566 – 1 ATR (PDL 24311) 24620 – 1 ATR (yPOC 24365) |
| Down |
| 24356 – M TPO low 24311 – PDL 24263 – SOC (08 Aug) 24229 – 3-day VPOC (06-08 Aug) 24161 – VPOC (08 Aug) 24113 – Spike high (08 Aug) |
Hypos for 13th Aug – 24347 [ 24472 / 24212 ] – Normal Variation (Up)
| Up |
| 24361 – 2-day POC (09-12 Aug) 24426 – 2-day VAH (09-12 Aug) 24472 – Weekly IBH 24510 – Gap mid (05 Aug) 24558 – 1 ATR (PBL 24302) 24617 – 1 ATR (24361) |
| Down |
| 24338 – 2-day VAH (09-12 Aug) 24278 – SOC (12 Aug) 24212 – Weekly IBL 24161 – VPOC (08 Aug) 24113 – Spike high (08 Aug) 24057 – J TPO h/b (06 Aug) |
Hypos for 14th Aug – 24139 [ 24360 / 24116 ] – Trend (Down)
| Up |
| 24144 – M TPO high (13 Aug) 24196 – J TPO Ext Handle 24237 – 13 Aug Halfback 24275 – G TPO h/b (13 Aug) 24324 – POC (13 Aug) 24361 – 2-day VPOC (09-12 Aug) |
| Down |
| 24120 – Buy tail (13 Aug) 24092 – Buy tail (08 Aug) 24057 – J TPO h/b (06 Aug) 24012 – 2-day POC (05-06 Aug) 23960 – Buy tail (Aug) 23893 – Swing Low (05 Aug) |
Hypos for 16th Aug – 24143 [ 24196 / 24099 ] – Normal (Gaussian)
| Up |
| 24157 – POC (14 Aug) 24196 – J TPO Ext Handle (13 Aug) 24237 – 13 Aug Halfback 24275 – G TPO h/b (13 Aug) 24324 – POC (13 Aug) 24361 – 2-day VPOC (09-12 Aug) |
| Down |
| 24121 – PBL (14 Aug) 24092 – Buy tail (08 Aug) 24057 – J TPO h/b (06 Aug) 24012 – 2-day POC (05-06 Aug) 23960 – Buy tail (Aug) 23893 – Swing Low (05 Aug) |
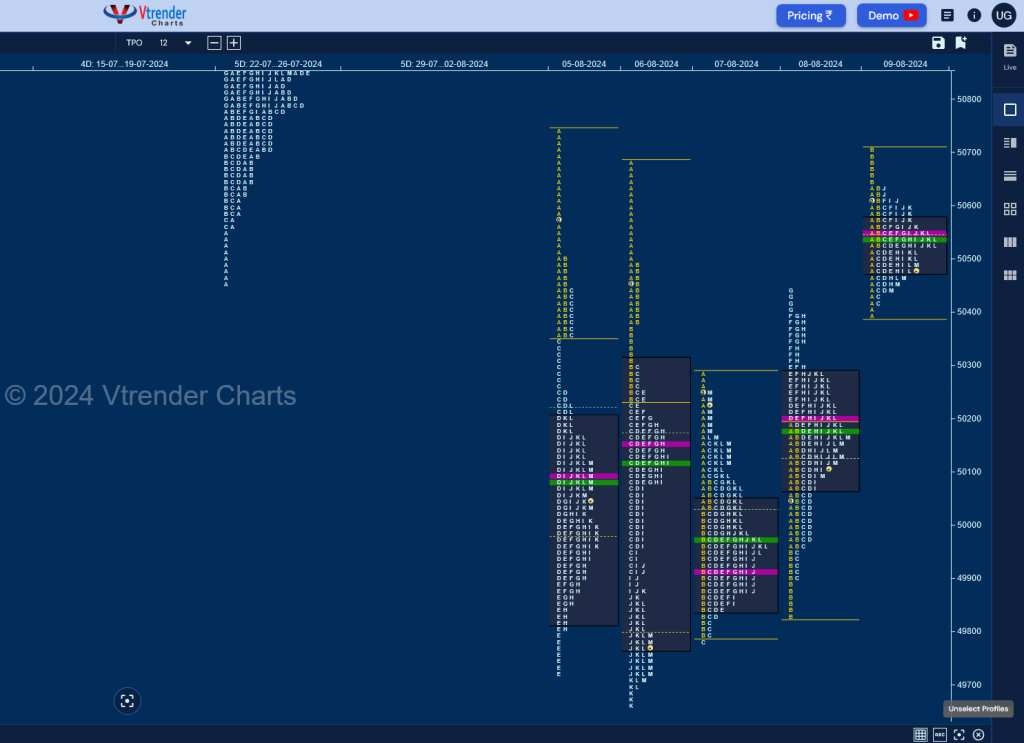
BankNifty Spot: 50484 [ 50747 / 49659 ] Normal
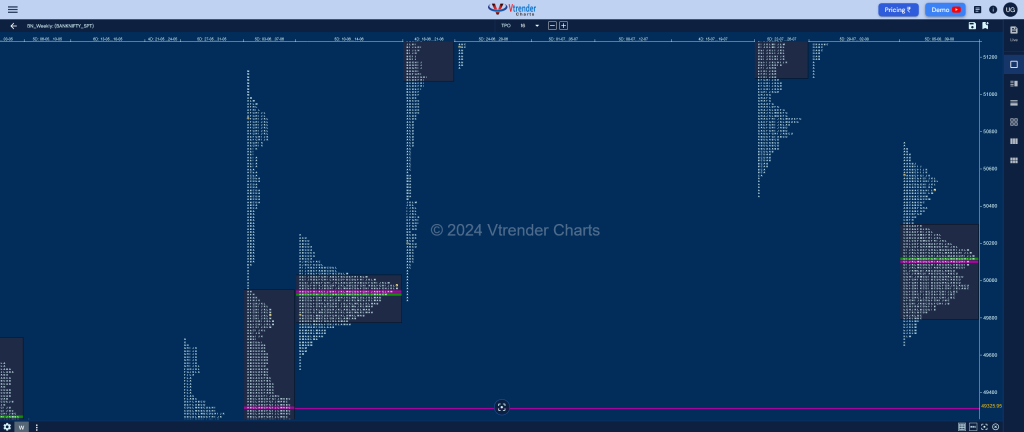
Previous week’s report ended with this ‘The weekly range & value was completely inside previous week at 51406-51486-51762 and the close below value suggests that the PLR would be to the downside but the sellers will need to negated the singles from 51189 to 51087 for a probe towards the TPO HVN of 50856 & weekly tail from 50559 to 50438 (22-26 Jul) in the coming week‘

Monday – 50092 [ 50747 / 49719 ] Trend (Down)
Tuesday – 49748 [ 50688 / 49659 ] – Trend (Down)
Wednesday – 50119 [ 50292 / 49782 ] – Normal (Inside Bar)
Thursday – 50156 [ 50440 / 49829 ] – Normal Variation (Up)
Friday – 50484 [ 50707 / 50386 ] – Normal
BankNifty continued previous week’s closing imbalance with a big gap down of 763 points forming an elongated ‘b’ shape profile of 1028 points as it broke below the weekly VPOC of 49947 and went on to make a low of 49719 before closing right at the POC of 50092 indicating shorts booking profits and made a higher open on Tuesday right in previous selling singles where the supply came back strongly to force yet another long liquidation profile of 1030 points hitting new lows for the month at 49659 forming back to back Trend Down profiles which were also ‘b’ shape ones.
The auction then formed an inside day on Wednesday forming a nice Gaussian Curve in the 2-day overlapping Value area signalling the end of the downside and a start of a balance as it formed higher value on Thursday in spite being in the range of Monday & Tuesday completing a well balanced 4-day composite with Value at 49876-50098-50240. Friday then saw a move away from this balance in form of a big gap up of 455 points but could not scale above Monday’s high forming a narrow range 3-1-3 profile with a prominent POC at 50551 and closed well below it at 50484. The weekly profile is a Normal One with completely lower Value at 49796-50098-50296 with an initiative selling tail from 50707 to 51189 which will be the supply zone above 50551 for the coming week whereas on the downside, Friday’s singles from 50420 to 50386 will be the immediate demand zone below which BankNifty has a good chance to complete the 80% Rule in the 4-day composite from 50240-50098-49876 and test the swing lows of 49659.

Click here to view this week’s MarketProfile of BankNifty on Vtrender Charts
Hypos for 12th Aug – 24365 [ 24419 / 24311 ] – Normal
| Up |
| 50490 – M TPO high (09 Aug) 50638 – Sell Tail (09 Aug) 50838 – 2-day VPOC (25-26 Jul) 50968 – Gap mid (05 Aug) 51087 – Monthly Ext Handle 51189 – Weekly Tail (05-09 Aug) |
| Down |
| 50472 – VAL (09 Aug) 50350 – SOC (08 Aug) 50240 – 4-day VAH (05-08 Aug) 50098 – Aug POC 49950 – 4-day HVN (05-08 Aug) 49794 – Buy tail (07 Aug) |
Hypos for 13th Aug – 50578 [ 50830 / 50149 ] – Double Distribution (Up)
| Up |
| 50607 – M TPO high (12 Aug) 50732 – POC (12 Aug) 50838 – 2-day VPOC (25-26 Jul) 50968 – Gap mid (05 Aug) 51087 – Monthly Ext Handle 51189 – Weekly Tail (05-09 Aug) |
| Down |
| 50578 – Previous Close 50490 – 12 Aug Halfback 50305 – SOC (12 Aug) 50201 – Buy Tail (12 Aug) 50098 – Aug VPOC 49950 – 4-day HVN (05-08 Aug) |
Hypos for 14th Aug – 49831 [ 50559 / 49785 ] – Trend (Down)
| Up |
| 49868 – M TPO high (13 Aug) 49992 – J TPO Ext Handle 50171 – 13 Aug Halfback 50344 – PBH (13 Aug) 50497 – Sell Tail (13 Aug) 50607 – M TPO high (12 Aug) |
| Down |
| 49794 – Buy tail (07 Aug) 49659 – Swing Low (06 Aug) 49515 – 07 Jun Halfback 49326 – Weekly VPOC (03-06 Jun) 49193 – L TPO h/b (06 Jun) 49047 – Jun RO point |
Hypos for 16th Aug -49727 [ 49956 / 49654 ] – Normal
| Up |
| 49733 – POC (14 Aug) 49885 – Sell Tail (14 Aug) 49992 – J TPO Ext Handle (13 Aug) 50171 – 13 Aug Halfback 50344 – PBH (13 Aug) 50497 – Sell Tail (13 Aug) |
| Down |
| 49681 – Buy Tail (14 Aug) 49515 – 07 Jun Halfback 49326 – Weekly VPOC (03-06 Jun) 49193 – L TPO h/b (06 Jun) 49047 – Jun RO point 48948 – M TPO h/b (05 Jun) |
