Nifty Spot: 21782 [ 22053 / 21629 ]
Previous week’s report ended with this ‘The weekly profile was an elongated 697 point range with completely higher Value at 21523-21700-21773 but has left seller footprints at 21910 / 21963 & 22003 apart from 22051 & 22102 which will be the important references for the coming week whereas on the downside, break of 21765 could trigger the 80% Rule towards 21640‘

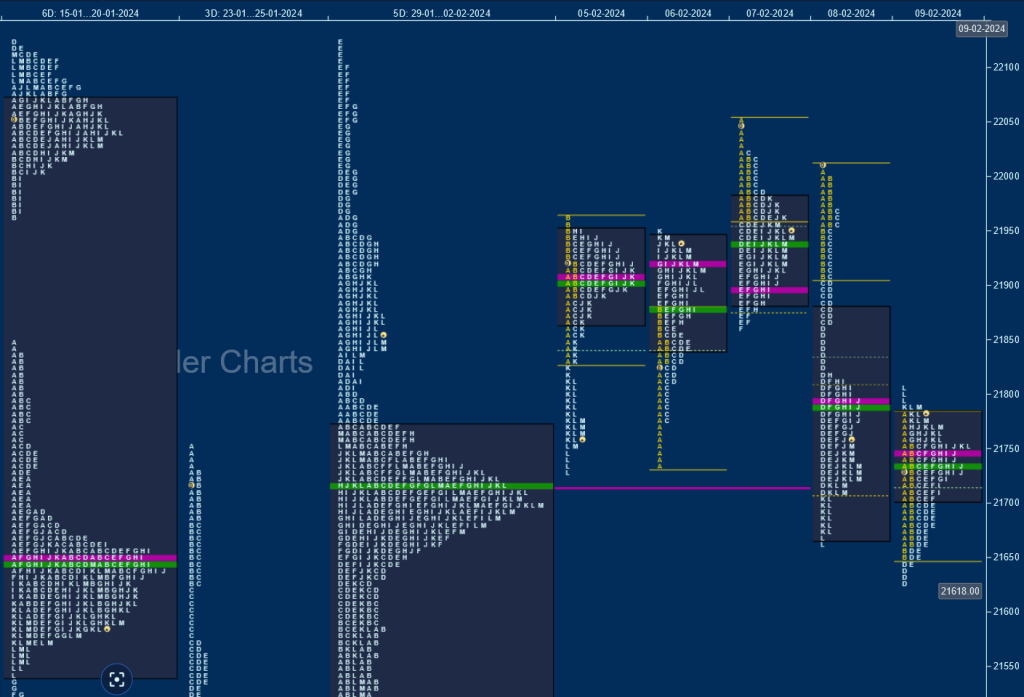
Nifty opened the week with a gap up taking out the first selling reference of 21910 but stalled right at the next one of 21963 as it hit 21964 and saw supply coming back forcing a probe back into previous week’s Value as it made a low of 21726 and took support just above 01st Feb’s VPOC of 21718 after which it got initiative buying coming back on Tuesday as it left an initiative buying tail and went on to make a high of 21951 leaving an inside day and a 2-day balance.
The auction continued the upside imbalance with a higher open on Wednesday one again taking out the first of the higher seller footprint of 22003 from previous week but got rejected right from the upper one at 22051 as it made new highs of 22053 but left A period singles marking the end of the upmove and formed a ‘b’ shape long liquidation profile with lows of 21860 and a close around the prominent POC of 21930 from where it made an attempt to move higher on Thursday, (08 Feb) with a higher open but once again left an initiative selling tail from 21998 to 22011 as sellers took complete control affecting couple of extension handles at 21910 & 21866 and leaving another zone of singles till 21820 after which it broke below 21765 and almost completed the 80% Rule as mentioned above forming a Trend Day Down while hitting new lows for the week at 21665.
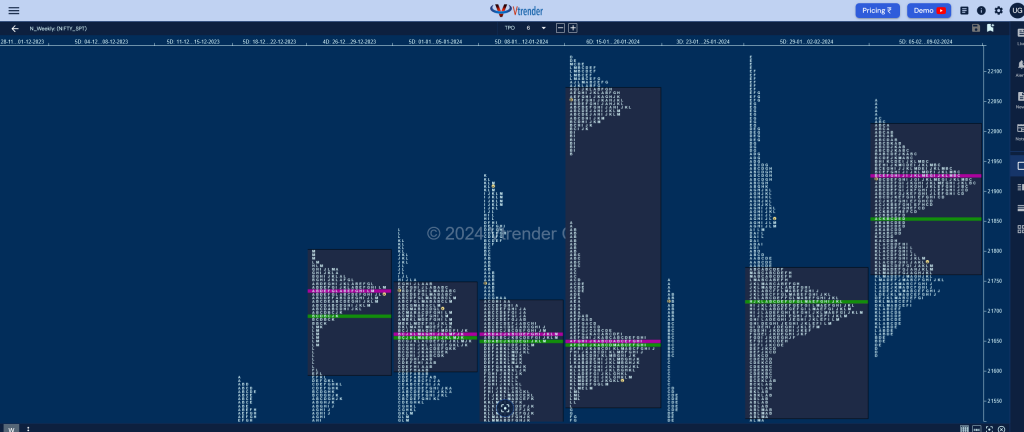
Nifty did go on to hit that 21640 objective on Friday after making an OAIR start while making a low of 21629 as it tested January’s POC of 21635 but got rejected leaving a small responsive buying tail and then went on to form a Neutral Extreme Day Up confirming a FA (Failed Auction) at lows. The weekly profile is also a Neutral Extreme one but to the downside with clear rejection at 22053 which is now a swing reference as it made a trending move down of 423 points to 21629 but has left a FA there to indicate strong presence of demand in this zone as even the weekly Value was mostly higher at 21764-21926-22009 with a low volume zone between 21730 to 21930 which could get filled in the coming session(s) before making a move away from here.

Click here to view this week’s MarketProfile of Nifty on Vtrender Charts
Hypos for 12th Feb 2024
| Up |
| 21790 – Closing tail (09 Feb) 21866 – Ext Handle (08 Feb) 21910 – Ext Handle (08 Feb) 21954 – SOC from 08 Feb 21998 – Selling Tail (08 Feb) |
| Down |
| 21780 – IBL from 09 Feb 21744 – dPOC from 09 Feb 21688 – E TPO haldback 21629 – FA from 09 Feb 21581 – Jan Series VWAP |
Hypos for 13th Feb 2024
| Up |
| 21641 – POC from 12 Feb 21697 – PBH from 12 Feb 21738 – Ext Handle (12 Feb) 21784 – A TPO halfback (12 Feb) 21831 – Selling Tail high (12 Feb) |
| Down |
| 21585 – Buying tail (12 Feb) 21531 – Buying Tail (31 Jan) 21489 – IB tail mid (31 Jan) 21448 – Buy tail (29 Jan) 21399 – 3-day VAH (23-25 Jan) |
Hypos for 14th Feb 2024
| Up |
| 21752 – 3-day VAH (09-13 Feb) 21804 – 3-day Sell Tail (09-13 Feb) 21866 – Ext Handle (08 Feb) 21910 – Ext Handle (08 Feb) 21954 – SOC from 08 Feb |
| Down |
| 21742 – 3-day POC (09-13 Feb) 21705 – PBL from 12 Feb 21642 – 3-day VAL (09-13 Feb) 21595 – Buying tail (13 Feb) 21543 – PDL |
Hypos for 15th Feb 2024
| Up |
| 21856 – Sell tail (14 Feb) 21910 – Ext Handle (08 Feb) 21954 – SOC from 08 Feb 21998 – Selling Tail (08 Feb) 22053 – Weekly FA (Failed Auction) |
| Down |
| 21829 – M TPO h/b (14 Feb) 21765 – K TPO h/b (14 Feb) 21720 – Ext Handle (14 Feb) 21684 – J TPO h/b (14 Feb) 21634 – PBL from 14 Feb |
Hypos for 16th Feb 2024
| Up |
| 21926 – Monthly HVN 21954 – SOC from 08 Feb 21998 – Selling Tail (08 Feb) 22053 – Weekly FA (Failed Auction) 22102 – Selling Tail (02 Feb) |
| Down |
| 21903 – Anamoly (15 Feb) 21861 – POC from 15 Feb 21823 – PBL from 15 Feb 21765 – K TPO h/b (14 Feb) 21720 – Ext Handle (14 Feb) |
BankNifty Spot: 45634 [ 46181 / 44859 ]
Previous week’s report ended with this ‘The weekly profile is also a NeuX one but to the upside with mostly higher Value at 45089-45431-45998 and has a low volume zone between the 2 TPO HVNs of 45431 to 46007 which could see some filling up in the coming week if it remains below Friday’s extension handle of 46130‘

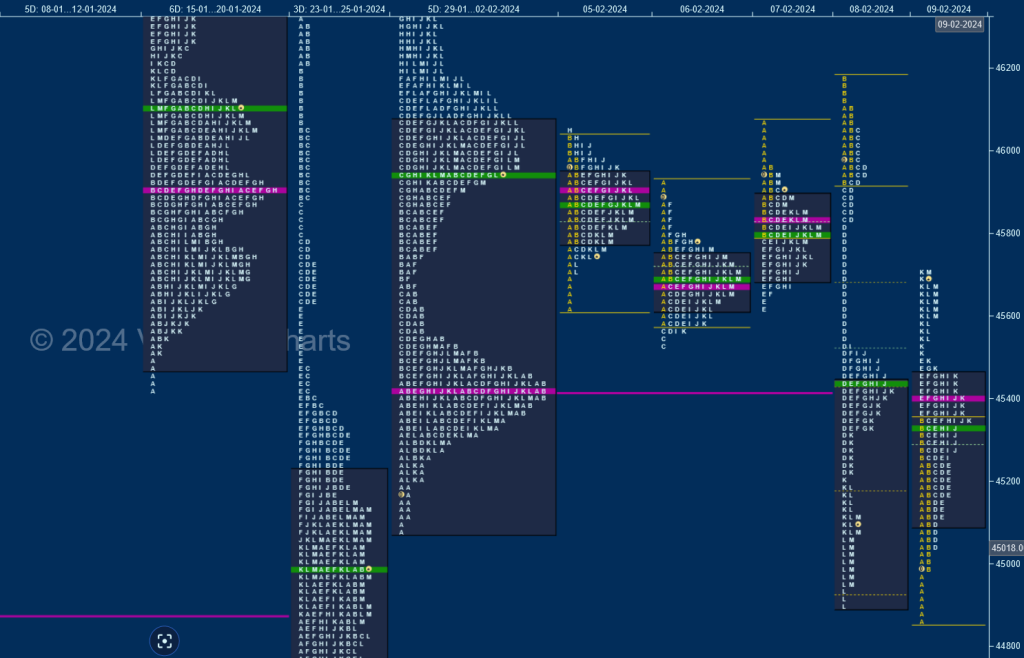
As expected, BankNifty formed a nice balance between the 2 above mentioned HVNs of 46007 & 45431 over the first 3 days of the week forming a Gaussian Curve with value at 45662-45726-45916 and made a look up above this zone a open on Thursday but got rejected as it not only completed the 80% Rule in the 3-day composite but left a zone of mid-profile singles from 45829 to 45333 in the D period and formed a Trend Day Down breaking below previous week’s low.
The auction continued the imbalance with a lower open on Friday where it hit new lows for the month at 44859 but left an important A period buying tail from the SOC (Scene Of Crime) of 44864 marking the end of the downside and went on to probe higher for the rest of the day leaving couple of important PBLs at 45052 & 45263 before leaving an extension handle at 45489 and probing into previous session’s D period singles but could only manage similar highs at 45718.
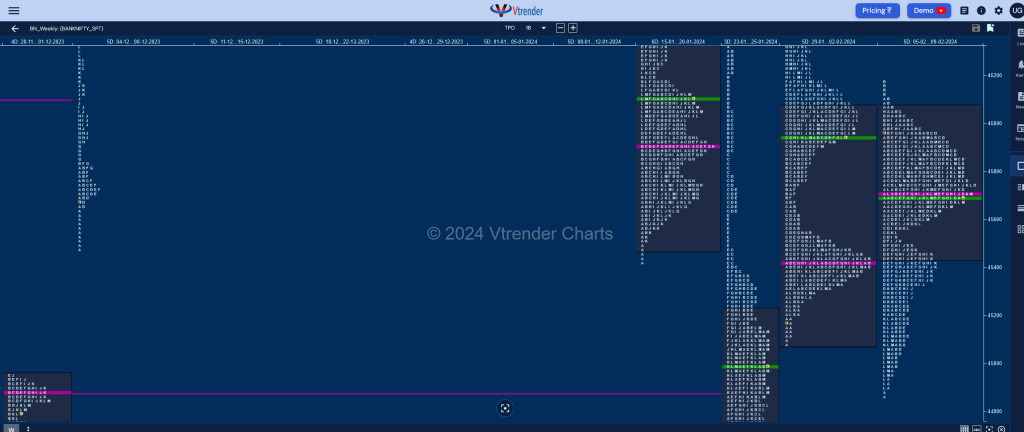
BankNifty has formed a Neutral Centre weekly profile with completely inside Value at 45447-45719-46062 with the auction doing a good job of filling up previous week’s low volume zone and could give a move away from here provided it either negates this week’s selling tail from 46109 to 46181 on the upside and has immediate support at the TPO LVN (Low Volume Node) of 45540 below which it turns weak for a probe lower towards 44995 and a break of which could result in a further drop down to the VPOC of 44572 from 22nd to 26th Jan.

Click here to view this week’s MarketProfile of BankNifty on Vtrender Charts
Hypos for 12th Feb 2024
| Up |
| 45719- Weekly POC 45830 – Ext Handle (08 Feb) 45940 – C TPO halfback (08 Feb) 46051 – C TPO high (08 Feb) 46181 – Swing High (08 Feb) |
| Down |
| 45608 – M TPO low (09 Feb) 45488 – Ext Handle (09Feb) 45342 – TPO HVN (09 Feb) 45263 – PBL from 09 Feb 45052 – PBL from 09 Feb |
Hypos for 13th Feb 2024
| Up |
| 44888 – L TPO halfback (12 Feb) 44997 – PBH from 12 Feb 45146 – Ext Handle (12 Feb) 45346 – PBH from 12 Feb 45474 – Ext Handle (12 Feb) |
| Down |
| 44830 – dPOC from 12 Feb 44651 – Buy tail (12 Feb) 44572 – VPOC from 25 Jan 44444 – Buying Tail (25 Jan) 44284 – PBL from 30 Nov |
Hypos for 14th Feb 2024
| Up |
| 45512 – POC from 13 Feb 45645 – J TPO halfback 45750 – PDH 45830 – Ext Handle (08 Feb) 45940 – C TPO halfback (08 Feb) |
| Down |
| 45473 – M TPO halfback 45383 – Closing PBL (13 Feb) 45286 – 13 Feb halfback 45195 – H TPO halfback 45050 – H TPO low (13 Feb) |
Hypos for 15th Feb 2024
| Up |
| 45953 – M TPO high 46107 – Sell tail (14 Feb) 46230 – SOC from 02 Feb 46396 – 02 Feb halfback 46600 – VPOC (02 Feb) |
| Down |
| 45822 – M TPO halfback 45666 – TPO HVN (14 Feb) 45540 – POC (14 Feb) 45382 – F TPO halfback 45197 – Mid-profile singles |
Hypos for 16th Feb 2024
| Up |
| 46297 – Spike High (15 Feb) 46396 – 02 Feb halfback 46600 – VPOC (02 Feb) 46726 – SOC from 02 Feb 46892 – Swing High (02 Feb) |
| Down |
| 46168 – Spike Low (15 Feb) 46027 – PBL from 15 Feb 45890 – POC from 15 Feb 45727 – B TPO halfback 45540 – POC (14 Feb) |
