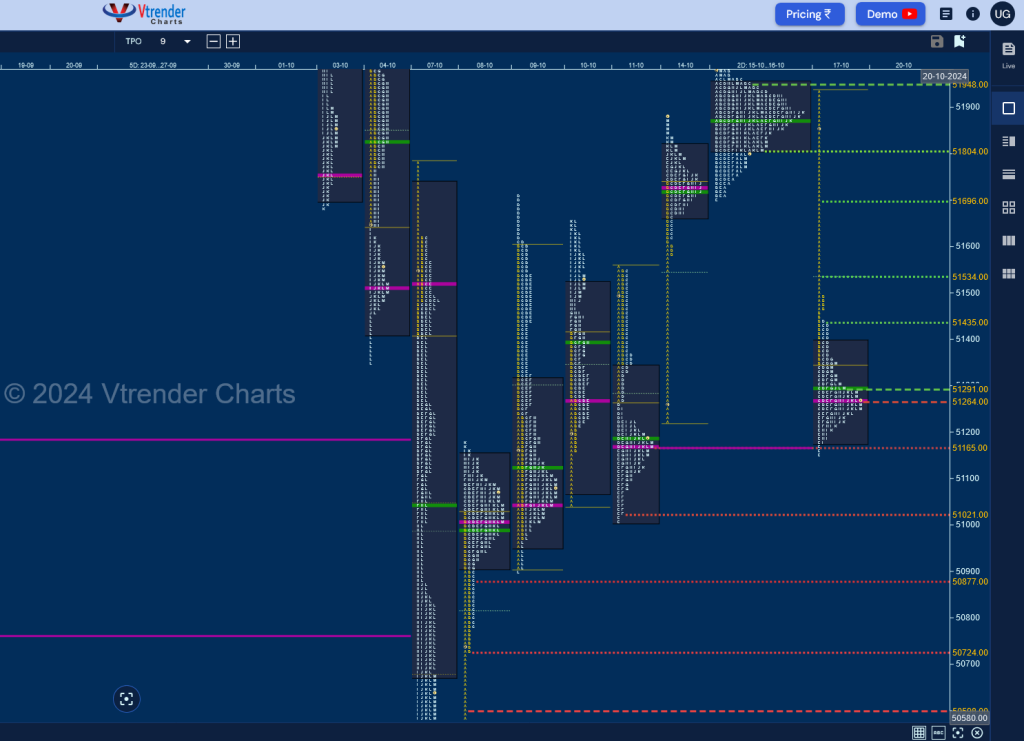
Nifty Spot: 24964 [ 25234 / 24694 ] Gaussian Curve
Previous week’s report ended with this ‘Nifty formed a Trend Down weekly profile as sellers remained in complete control on all day resulting in 2 Trend Day profiles and a Neutral Extreme forming overlapping to lower value at 25332-25810-26134 and the close around the lows suggest that this imbalance could continue in the coming week too‘
Monday – 24795 [ 25143 / 24694 ] Trend (Down)
Tuesday – 25013 [ 25044 / 24756 ] Normal Variation (Up)
Wednesday – 24982 [ 25234 / 24947 ] Neutral Extreme (Down)
Thursday – 24998 [ 25134 / 24979 ] Neutral Extreme (Down)
Friday – 24964 [ 25028 / 24920 ] – Normal
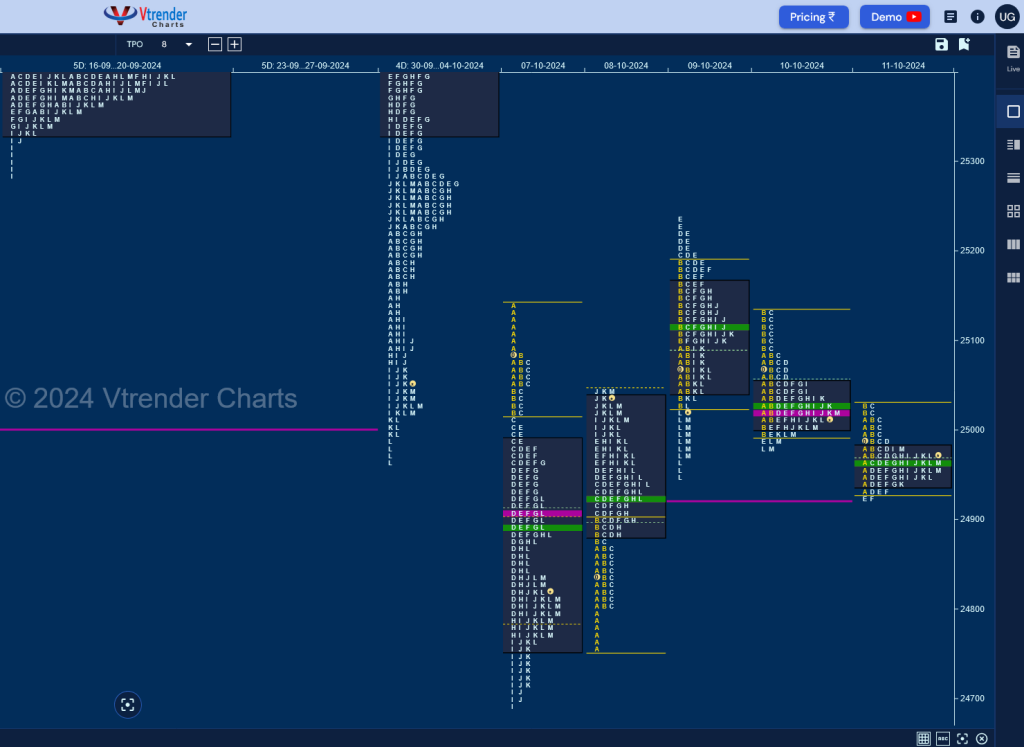
Nifty continued previous week’s imbalance with a Trend Day Down on Monday as it left an initiative selling tail from 25080 to 25143 and went on to make lows of 24694 but left a small yet important buying tail triggering a pull back to 24920 into the close and followed it up with an initiative buying tail on Tuesday from 24802 to 24756 confirming the end of the downside as it went on to scale above Monday’s high tagging 25234 allbeit with marginal REs which could not sustain leading to a Neutral Extreme (NeuX) Day Down indicating return of sellers.
The auction then left a FA at 25134 on Thursday with a typical C side play ensuing another NeuX profile with a prominent POC at 25019 and made an attempt to move away from here on Friday but could only manage a narrow 109 point range Normal Day taking support right at Tuesday’s VPOC of 24920.
The weeky profile is a nice Gaussian Curve with completely lower Value at 24891-24965-25124 with a close right at the prominent POC so has a very good chance of getting back to imbalance mode in the coming week with the immediate downside objectives being 24862-24802 zone & 24581 whereas the longer term ones at 24416 & 24149 whereas on the upside, 25088-25134 will be the first section to be taken out above which Nifty could go for 25522 & 25770
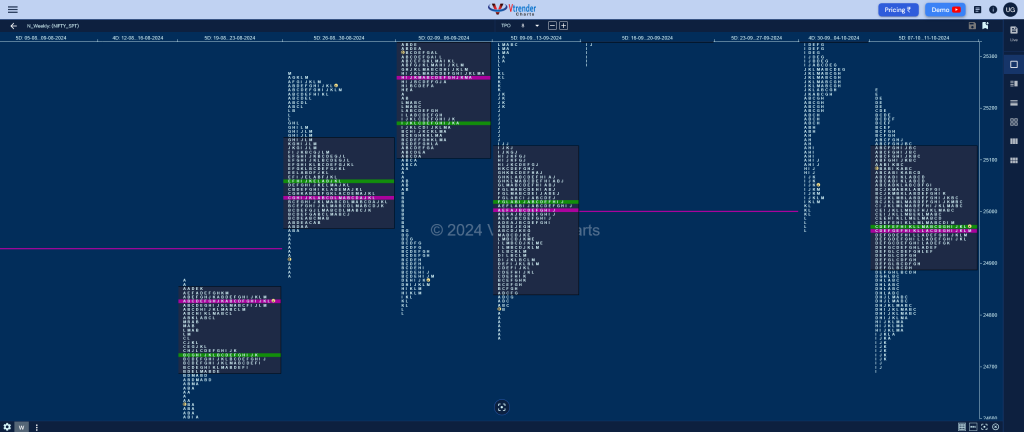
Click here to view this week’s MarketProfile of Nifty on Vtrender Charts
Hypos for 14th Oct– 24964 [ 25028 / 24920 ] – Normal
| Up |
| 24979 – PBH (11 Oct) 25024 – Sell Tail (11 Oct) 25083 – SOC (10 Oct) 25134 – FA (10 Oct) 25199 – SOC (09 Oct) 25234 – Swing High (09 Oct) |
| Down |
| 24965 – POC (11 Oct) 24910 – 2-day VPOC (07-08 Oct) 24862 – 1 ATR (FA 25134) 24802 – Buy Tail (08 Oct) 24756 – Buy tail (Oct) 24694 – Swing Low (07 Oct) |
Hypos for 15th Oct– 25128 [ 25159 / 25017 ] Normal (‘p’ shape)
| Up |
| 25148 – Closing PBH (14 Oct) 25199 – SOC (09 Oct) 25234 – Swing High (09 Oct) 25274 – SOC (04 Oct) 25316 – I TPO h/b (03 Oct) 25368 – Ext Handle (03 Oct) |
| Down |
| 25122 – POC (14 Oct) 25073 – Buy Tail (14 Oct) 25017 – Weekly IBL 24965 – VPOC (11 Oct) 24910 – 2-day VPOC (07-08 Oct) 24875 – Weekly 2 IB |
Hypos for 16th Oct– 25057 [ 25212 / 25008 ] Outside Bar (‘b’ shape)
| Up |
| 25064 – POC (15 Oct) 25110 – 15 Oct Halfback 25160 – Sell Tail (15 Oct) 25234 – Swing High (09 Oct) 25274 – SOC (04 Oct) 25316 – I TPO h/b (03 Oct) |
| Down |
| 25050 – M TPO low (15 Oct) 25017 – Weekly IBL 24965 – VPOC (11 Oct) 24910 – 2-day VPOC (07-08 Oct) 24875 – Weekly 2 IB 24802 – Buy Tail (08 Oct) |
Hypos for 17th Oct– 24971 [ 25093 / 24908 ] – Normal Variation (Down)
| Up |
| 24968 – M TPO high (16 Oct) 25001 – 16 Oct Halfback 25060 – Sell Tail (16 Oct) 25110 – 15 Oct Halfback 25160 – Sell Tail (15 Oct) 25212 – Weekly FA |
| Down |
| 24959 – M TPO h/B (16 Oct) 24910 – 2-day VPOC (07-08 Oct) 24875 – Weekly 2 IB 24802 – Buy Tail (08 Oct) 24756 – Buy tail (Oct) 24694 – Swing Low (07 Oct) |
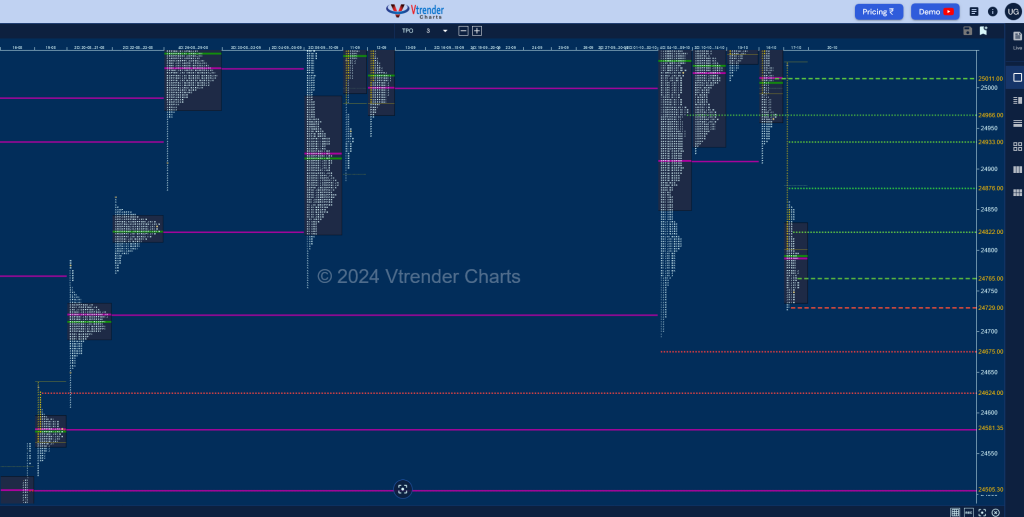
Hypos for 18th Oct– 24749 [ 25029 / 24728 ] Trend (Down)
| Up |
| 24766 – Closing PBH (17 Oct) 24822 – D TPO h/b (17 Oct) 24877 – 17 Oct Halfback 24934 – A TPO h/b (17 Oct) 24968 – M TPO high (16 Oct) 25013 – POC (16 Oct) |
| Down |
| 24730 – Buy tail (17 Oct) 24677 – 1 ATR (WFA 25212) 24625 – SOC (19 Aug) 24581 – VPOC (19 Aug) 24541 – Buy tail (19 Aug) 24505 – VPOC (16 Aug) |
BankNifty Spot: 51462 [ 53726 / 51347 ] Double Distribution Trend (Down)
Previous week’s report ended with this ‘BankNifty as expected gave an imbalance weekly profile to the downside as it not only tagged the weekly VPOC of 52221 but went on to hit lows of 51347 into the close forming completely lower value at 52099-53001-53728 and looks set to continue the downmove in the coming week towards the immediate VPOC of 51186 & the September lows of 50369‘
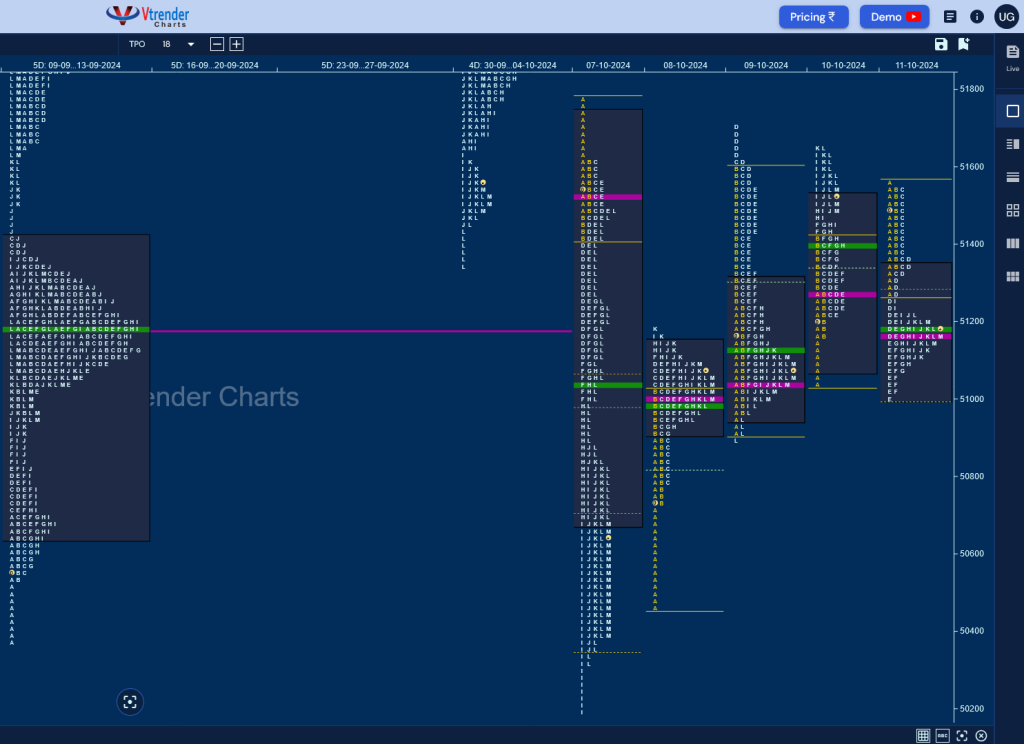
Monday – 50479 [ 51784 / 50194 ] – Trend (Down)
Tuesday – 51021 [ 51176 / 50466 ] – Normal (‘p’ shape)
Wednesday – 51007 [ 51707 / 50903 ] – Neutral
Thursday – 51531 [ 51659 / 51047 ] – Normal Variation (Up)
Friday – 51172 [ 51560 / 51005 ] – Normal Variation (Down)
BankNifty also opened the week with an elongated Trend Day Down of 1591 points as it broke below the weekly VPOC of 51186 and went on to make a look down below previous month’s low of 50369 while recording new lows of 50194 but left a responsive buying tail which was followed up with an initiative one on Tuesday resulting in a test of Monday’s A period singles but got stalled at 51707 confirming a FA there and promptly completing the 1 ATR objective of 51031 on the same day after which it remained in balance mode building a prominent at 51064 with the weekly profile also developing a bell curve with completely lower value at 50945-51064-51543 and could get back into imbalance mode with the upside objectives being 52560 & 53001 whereas on the downside the probable targets would be 49733 & 49326.
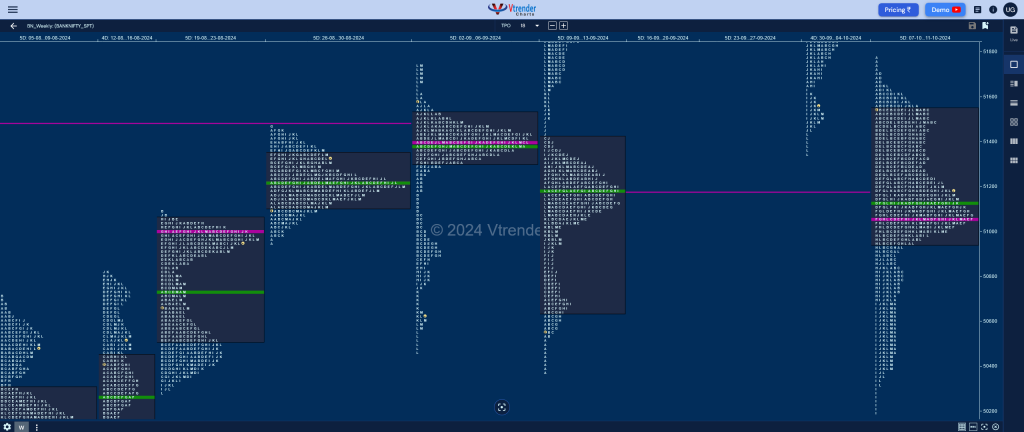
Click here to view this week’s MarketProfile of BankNifty on Vtrender Charts
Hypos for 14th Oct – 51172 [ 51560 / 51005 ] Normal Variation (Down)
| Up |
| 51194 – M TPO high (11 Oct) 51283 – 11 Oct Halfback 51435 – C TPO h/b (11 Oct) 51583 – SOC (10 Oct) 51707 – FA (09 Oct) 51799 – H TPO h/b (04 Oct) 51911 – C TPO h/b (04 Oct) |
| Down |
| 51166 – POC (11 Oct) 51064 – Weekly POC (07-11 Oct) 50905 – Tail (09 Oct) 50821 – 08 Oct Halfback 50682 – A TPO h/b (08 Oct) 50599 – IB tail mid (08 Oct) 50466 – Buy tail (Oct) |
Hypos for 15th Oct – 51817 [ 5189 / 51220 ] – Normal (‘p’ shape)
| Up |
| 51839 – Spike low (14 Oct) 51955 – G TPO tail (04 Oct) 52093 – G TPO h/b (04 Oct) 52228 – F TPO h/b (04 Oct) 52356 – Sell tail (04 Oct) 52440 – B TPO h/b (03 Oct) |
| Down |
| 51792 – M TPO low (14 Oct) 51669 – PBL (14 Oct) 51551 – 14 Oct Halfback 51413 – A TPO h/b (14 Oct) 51272 – Ext Handle (11 Oct) 51166 – VPOC (11 Oct) |
Hypos for 16th Oct – 51906 [ 52022 / 51698 ] – Normal (Gaussian)
| Up |
| 51938 – M TPO h/b (15 Oct) 52093 – G TPO h/b (04 Oct) 52228 – F TPO h/b (04 Oct) 52356 – Sell tail (04 Oct) 52440 – B TPO h/b (03 Oct) 52566 – Sell Tail (03 Oct) |
| Down |
| 51882 – POC (15 Oct) 51796 – Weekly IBH 51669 – PBL (14 Oct) 51551 – 14 Oct Halfback 51413 – A TPO h/b (14 Oct) 51272 – Ext Handle (11 Oct) |
Hypos for 17th Oct – 51801 [ 52031 / 51711 ] – Normal Variation (Down)
| Up |
| 51811 – 2-day VAL (15-16 Oct) 51951 – 2-day VAH (15-16 Oct) 52093 – G TPO h/b (04 Oct) 52228 – F TPO h/b (04 Oct) 52356 – Sell tail (04 Oct) 52440 – B TPO h/b (03 Oct) |
| Down |
| 51796 – Weekly IBH 51669 – PBL (14 Oct) 51551 – 14 Oct Halfback 51413 – A TPO h/b (14 Oct) 51272 – Ext Handle (11 Oct) 51166 – VPOC (11 Oct) |
Hypos for 18th Oct – 51288 [ 51930 / 51150 ] – Normal Variation (Down)
| Up |
| 51297 – M TPO h/b (17 Oct) 51437 – PBH (17 Oct) 51540 – 17 Oct Halfback 51699 – A TPO h/b (17 Oct) 51811 – 2-day VAL (15-16 Oct) 51951 – 2-day VAH (15-16 Oct) |
| Down |
| 51265 – POC (17 Oct) 51166 – VPOC (11 Oct) 51023 – Buy tail (11 Oct) 50878 – SOC (08 Oct) 50732 – Buy Tail (08 Oct) 50599 – IB tail mid (08 Oct) |
