Nifty Spot: 22519 [ 22775 / 22503 ]

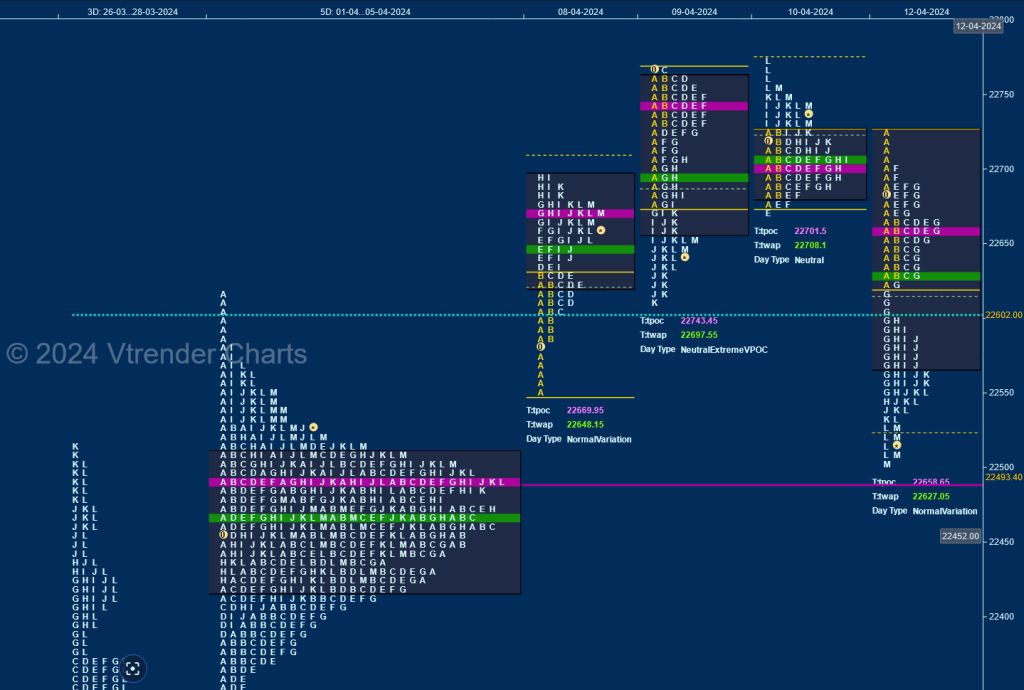
Nifty moved away from previous week’s balance to the upside negating the selling tail from 22580 to 22619 with initiative buying singles from 22586 to 22550 recording new ATH of 22697 on Monday and continued the upmove with higher highs of 22765 in the A period on Tuesday but made the dreaded C side extension to 22768 which was swiftly rejected resulting in a Failed Auction (FA) being confirmed as it dropped back lower to 22612 leaving a Neutral Extreme (NeuX) Day Down.
The auction did not give any follow up to the NeuX profile as it opened higher on Wednesday and remained above previous IBL of 22675 indicating that the FA could be re-visited and a failed attempt to extend lower in the E triggered a short covering move into the close confirming another FA at 22673 while making new ATH of 22775 but left a small and important responsive selling tail which meant that the FA of 22768 was still in force.
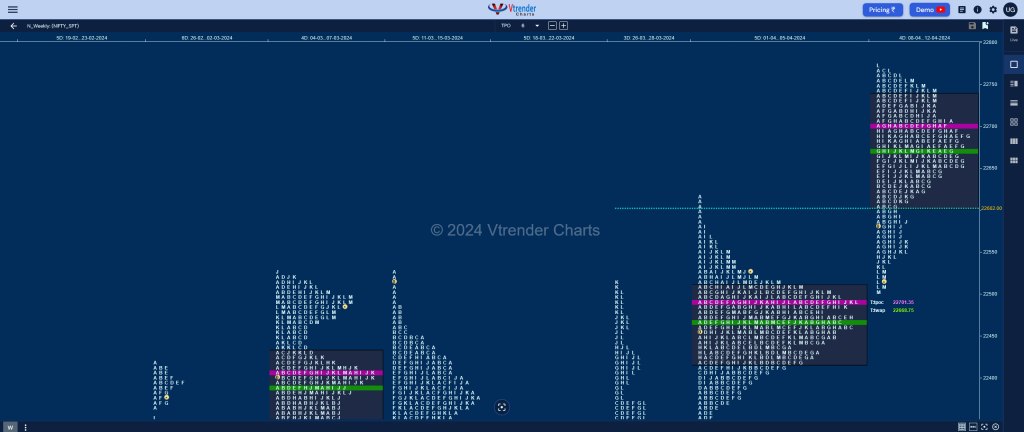
Friday saw a lower open and the negation of the FA of 22673 in the A period itself as Nifty made a low of 22624 and the pull back which lasted till the F TPO was halted right below previous POC of 22701 displaying that the sellers were gaining control and more confirmation came in form of an extension handle at 22624 in the G period paving way for a Double Distribution Trend Day Down along with new lows for the week at 22503 leaving a Neutral Extreme Weekly profile with completely higher value of 22607-22701-22734 and has previous week’s VPOC of 22493 as immediate support breaking below which it could go for a test of the VAL of 22417 & buying tail from 22350.

Click here to view this week’s MarketProfile of Nifty on Vtrender Charts
Hypos for 15th Apr
| Up |
| 22532 – Ext Handle (12 Apr) 22586 – Weekly SOC 22624 – Ext Handle (12 Apr) 22658 – POC (12 Apr) 22701 – POC (10 Apr) |
| Down |
| 22511 – Buy tail (12 Apr) 22493 – VPOC (05 Apr) 22451 – Buying Tail (05 Apr) 22417 – Weekly VAL 22350 – Buying Tail (04 Apr) |
Hypos for 16th Apr
| Up |
| 22295 – K TPO low (15 Apr) 22347 – POC (15 Apr) 22404 – Selling Tail (15 Apr) 22451 – Buying Tail (05 Apr) 22493 – VPOC (05 Apr) 22532 – Ext Handle (12 Apr) |
| Down |
| 22262 – Buy tail (15 Apr) 22213 – A TPO h/b (28 Mar) 22166 – Weekly VPOC (25-29 Mar) 22093 – Buying Tail (27 Mar) 22050 – VPOC (26 Mar) 22002 – 3D_VPOC (21-26 Mar) |
Hypos for18th Apr
| Up |
| 22166 – Mar Series VWAP 22209 – PBH (16 Apr) 22259 – Daily Ext Handle (15 Apr) 22303 – Daily Ext Handle (15 Apr) 22347 – VPOC (15 Apr) 22404 – Selling Tail (15 Apr) |
| Down |
| 22139 – L TPO h/b (16 Apr) 22099 – Buy tail (16 Apr) 22050 – VPOC (26 Mar) 22002 – 3D_VPOC (21-26 Mar) 21947 – Weekly IBL 21890 – 2D_VAH (19-20 Mar) |
Hypos for19th Apr
| Up |
| 22004 – M TPO h/b (18 Apr) 22055 – Ext Handle (18 Apr) 22113 – K TPO h/b (18 Apr) 22153 – SOC (18 Apr) 22193 – I TPO h/b (18 Apr) 22230 – SOC (18 Apr) |
| Down |
| 21961 – Poor lows (18 Apr) 21930 – Weekly ATR 21890 – 2D_VAH (19-20 Mar) 21840 – VPOC (20 Mar) 21799 – 2 ATR (FA 22153) 21755 – D TPO h/b (20 Mar) |
BankNifty Spot: 48564 [ 49057 / 48424 ]

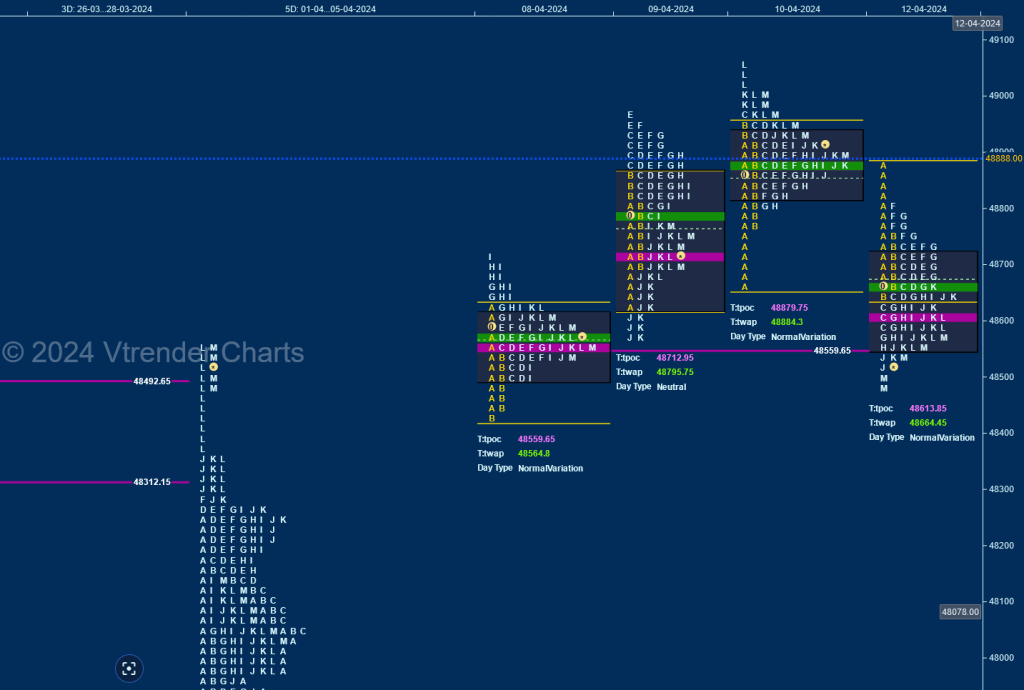
BankNifty gave a rare follow up to previous week’s Neutral Extreme profile to the upside as it took support in the spike zone of 48363 to 48557 while making a low of 48424 in the Initial Balance (IB) on Monday but remained in a narrow 292 point range hitting new ATH of 48717 forming a perfect 3-1-3 profile for the day with a close around the prominent POC of 48559 which was followed by a gap up open on Tuesday as it left an initiative buying tail from 48699 to 48622 in the IB and made couple of Range Extensions (RE) higher to 48940 & 48960 but could not extend any further hinting at inventory getting too long resulting in a drop lower and marginal REs to the downside at 48571 & 48568 as it took support at Monday’s POC of 48559 and gave a bounce back to 48771 into the close leaving a Neutral Centre Day.
The auction made an OAIR start on Wednesday but left an initiative buying tail from 48773 to 48669 and made a high of 48942 in the IB after which it recorded new ATH of 48966 but it came off the dreaded C side extension triggering a retracement down to 48808 in the H period where it left similar lows displaying exhaustion and resumed the upmove with an One Time Frame (OTF) probe till the L period where it recorded new ATH of 49057 but saw good profit booking coming in as seen in the small responsive selling tail till 49010 and a drop down to 48900 into the close.
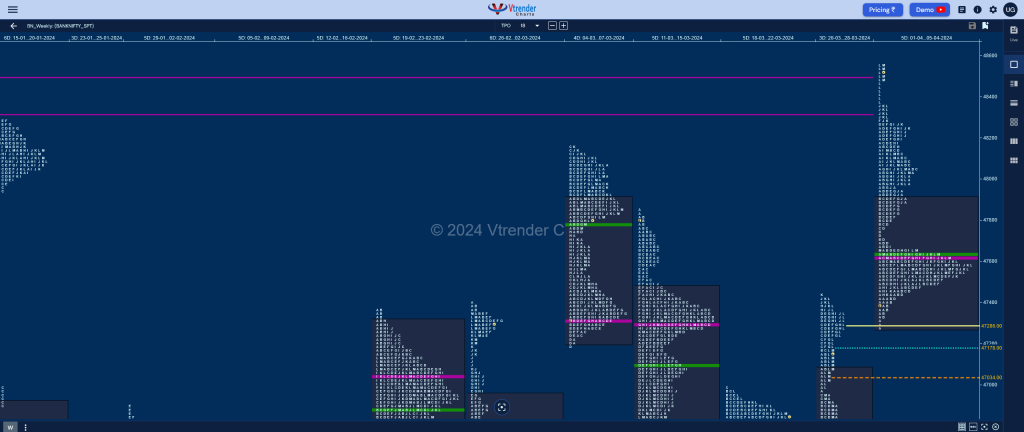
BankNifty continued the downside imbalance with a lower open on Friday and formed a ‘b’ shape kind of profile leaving an initiative selling tail from 48800 to 48914 and the POC at 48613 as it broke below Monday’s VPOC of 48559 while making lows of 48477 into the close leaving a narrow 633 point range Normal Variation Weekly profile with completely higher Value at 48605-48871-48946 but has closed below it which means that the extension handle of 48363 from previous week will be the immediate support below which it could go for a test of the lower VPOCs of 48222 & 47869 with the A period buying tail from 48043 of 05th Apr being a reference in the middle.

Click here to view this week’s MarketProfile of BankNifty on Vtrender Charts
Hypos for 15th Apr
| Up |
| 48579 – M TPO high (12 Apr) 48666 – PBH (12 Apr) 48757 – F TPO h/b (12 Apr) 48879 – POC (10 Apr) 49010 – Sell tail (10 Apr) |
| Down |
| 48527 – Buying tail (12 Apr) 48442 – Buying Tail (08 Apr) 48363 – Ext Handle (05 Apr) 48222 – POC ( 05 Apr) 48116 – C TPO h/b (05 Apr) |
Hypos for 16th Apr
| Up |
| 47825 – Spike high (15 Apr) 47904 – Ext Handle (15 Apr) 48038 – POC (15 Apr) 48120 – Selling Tail (15 Apr) 48255 – Monthly IBH 48363 – Ext Handle (05 Apr) |
| Down |
| 47745 – Buy tail (15 Apr) 47630 – 3-day VAH (01-03 Apr) 47507 – 3-day VAL (01-03 Apr) 47365 – A TPO h/b (03 Apr) 47207 – L TPO h/b (28 Mar) 47098 – M TPO h/b (28 Mar) |
Hypos for18th Apr
| Up |
| 47571 – Spike low (16 Apr) 47707 – Daily Ext Handle (15 Apr) 47825 – Spike high (15 Apr) 47904 – Ext Handle (15 Apr) 48038 – POC (15 Apr) 48120 – Selling Tail (15 Apr) |
| Down |
| 47504 – M TPO low (16 Apr) 47392 – Buying Tail (16 Apr) 47279 – Swing Low (03 Apr) 47190 – Roll Over point (Apr) 47051 – Mar series VWAP 46956 – Wkly Ext Handle (26-28 Mar) |
Hypos for19th Apr
| Up |
| to be updated… |
| Down |
| to be updated… |
