Nifty Spot: 24768 [ 24792 / 24180 ] Neutral Extreme (Up)
Previous week’s report ended with this ‘Nifty has formed a Trend Up profile on the weekly timeframe with completely higher Value at 24320-24463-24716 and is likely to return back to balance mode which was visible on the last day as it formed a narrow 131 point range Inside Day to close the week around the upper HVN of 24700 which will be the level to sustain for more upside in the coming week. On the downside, we have a zone of singles from 24246 to 24190 which will be an important support zone below which we have the initiative buying tail from 24079 which will be the swing reference‘
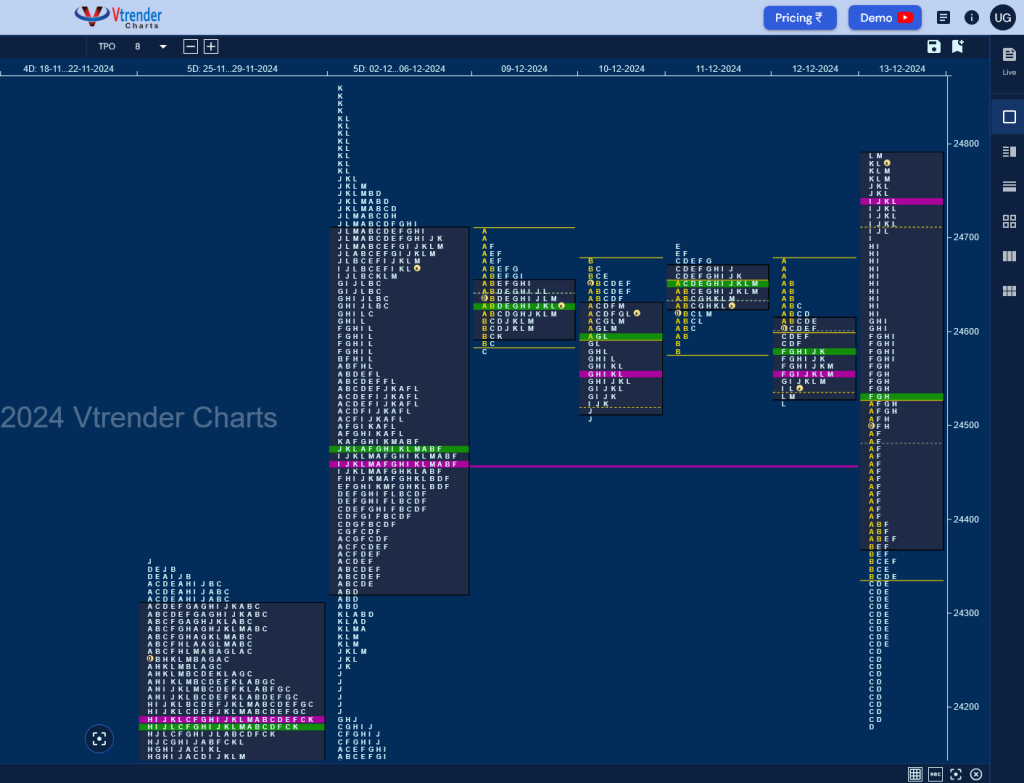
Monday – 24619 [ 24705 / 24580 ] Normal
Tuesday – 24610 [ 24677 / 24510 ] Double Distribution (Down)
Wednesday – 24641 [ 24691 / 24583 ] Normal Variation (Up)
Thursday – 24548 [ 24675 / 24528 ] Double Distribution (Down)
Friday – 24768 [ 24792 / 24180 ] Neutral Extreme (Up)
As expected, the auction continued to form a balance over the first fours days of this week stalling around previous week’s VAH of 24709 on the upside which was also just above the VPOC of 24705 from last Friday as it made a low of 24510 leaving a daily Swing Low taking support at the monthly IBH of 24573 on Monday & Wednesday but gave a hint that it could be headed lower with a Double Distribution Trend Day down on Thursday looking to move away from balance which got confirmed with an Open Drive Down on Friday as Nifty not only broke below previous week’s POC of 24463 but went on to test the zone of singles from 24246 to 24190 while making a low of 24180 taking support right at November’s monthly POC of 24185 triggering a massive reversal as the previous week’s buyers came back strongly negating the strong open and then scaling above 24709 to make new highs for the week at 24792 forming a massive 612 points range Neutral Extreme Day.
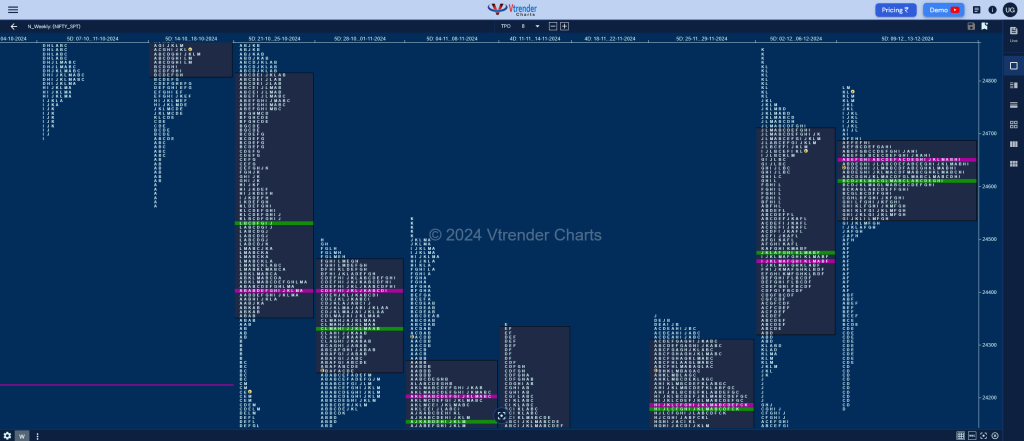
The weekly profile is a Neutral Extreme one too which remained inside previous week’s range forming a narrow value area zone of just 140 points (24540-24653-24680) filling the low volume zone of the Trend Up profile which has also tested the buying extension handle of 24190 resulting in a big move of over 600 points with a close around the highs so can expect this upmove to continue in the coming week for a test of the weekly selling tail from 24880 (21-25 Oct) & the higher VPOC of 25064 (14-18 Oct) along with the weekly FA of 25212 (15 Oct) whereas the zone of 24680 to 24705 would act as support.
Click here to view this week’s MarketProfile of Nifty on Vtrender Charts
Hypos for 16th Dec – 24768 [ 24792 / 24180 ] Neutral Extreme (Up)
| Up |
| 24776 – M TPO h/b (13 Dec) 24826 – Sell tail (05 Dec) 24864 – 3-day VAH (17-21 Oct) 24928 – IS tail mid (21 Oct) 24978 – Swing High (21 Oct) 25013 – POC (16 Oct) 25064 – Weekly VPOC (14-18 Oct) |
| Down |
| 24761 – M TPO low (13 Dec) 24705 – PBL (13 Dec) 24653 – Weekly POC 24615 – SOC (13 Dec) 24573 – Monthly IBH 24520 – NeuX SOC (13 Dec) 24477 – F TPO h/b (13 Dec) |
Hypos for 17th Dec – 24668 [ 24781 / 24601 ] Normal Variation (Down)
| Up |
| 24671 – M TPO high (16 Dec) 24710 – SOC (16 Dec) 24768 – Sell Tail (16 Dec) 24826 – Sell tail (05 Dec) 24864 – 3-day VAH (17-21 Oct) 24928 – IS tail mid (21 Oct) 24978 – Swing High (21 Oct) |
| Down |
| 24657 – POC (16 Dec) 24627 – G TPO h/b (16 Dec) 24573 – Monthly IBH 24520 – NeuX SOC (13 Dec) 24477 – F TPO h/b (13 Dec) 24421 – Weekly 2 IB 24380 – SOC (13 Dec) |
Hypos for 18th Dec – 24336 [ 24624 / 24303 ] Trend (Down)
| Up |
| 24343 – M TPO high (17 Dec) 24394 – POC (17 Dec) 24463 – 17 Dec halfback 24521 – C TPO tail (17 Dec) 24566 – Sell Tail (17 Dec) 24601 – Weekly IBL 24657 – VPOC (16 Dec) |
| Down |
| 24329 – M TPO low (17 Dec) 24262 – D TPO h/b (13 Dec) 24213 – 2 ATR (8D_VAH 24745) 24166 – VPOC (02 Dec) 24122 – PBL (02 Dec) 24079 – Buy Tail (02 Dec) 24021 – SOC (29 Nov) |
Hypos for 19th Dec – 24198 [ 24394 / 24149 ] Normal Variation (Down)
| Up |
| 24216 – M TPO high (18 Dec) 24272 – 18 Dec Halfback 24313 – PBH (18 Dec) 24343 – SOC (18 Dec) 24394 – VPOC (17 Dec) 24463 – 17 Dec halfback 24522 – C TPO tail (17 Dec) |
| Down |
| 24167 – VAL (18 Dec) 24122 – PBL (02 Dec) 24079 – Buy Tail (02 Dec) 24021 – SOC (29 Nov) 23962 – Buy Tail (29 Nov) 23927 – IB low (29 Nov) 23884 – Buy tail (28 Nov) |
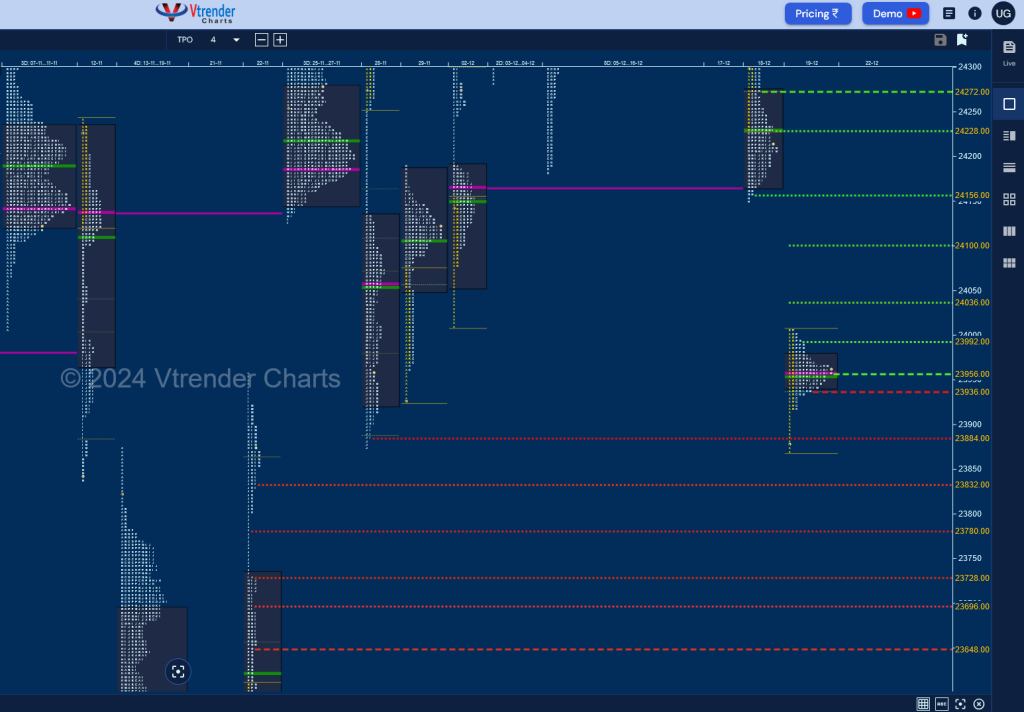
Hypos for 20th Dec – 23951 [ 24005 / 23870 ] Normal
| Up |
| 23956 – POC (19 Dec) 23993 – PBH (19 Dec) 24038 – Gap mid (19 Dec) 24101 – Sell Tail mid (19 Dec) 24159 – Tail (18 Dec) 24231 – VPOC (18 Dec) 24272 – 18 Dec Halfback |
| Down |
| 23937 – 19 Dec Halfback 23884 – Buy tail (28 Nov) 23834 – L TPO low (22 Nov) 23780 – Weekly Ext Handle 23731 – Ext Handle (22 Nov) 23696 – I TPO h/b (22 Nov) 23648 – G TPO h/b (22 Nov) |
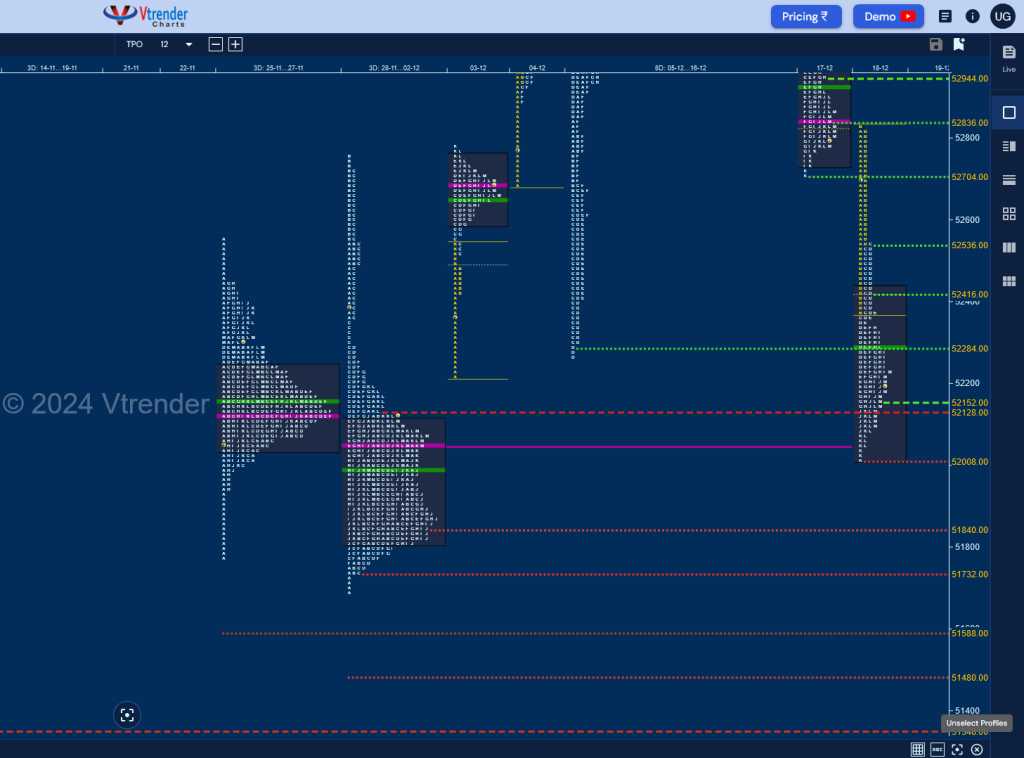
BankNifty Spot: 53583 [ 53775 / 52264 ] Inside Bar
Previous week’s report ended with this ‘BankNifty formed an elongated 2194 points range Triple Distribution Trend Up profile on the weekly which not only tagged the higher weekly VPOC of 53001 but went on to almost test the older Gaussian Curve from 23rd to 27th Sep while making a high of 53888 but has seen the POC shift higher to 53581 which will be the reference for the coming week as it may consolidate before resuming the upside. Value was completely higher at 52709-53581-53883 and we have couple of buy side extension handles at 52780 & 52190 which will be the important demand levels for the rest of the month‘
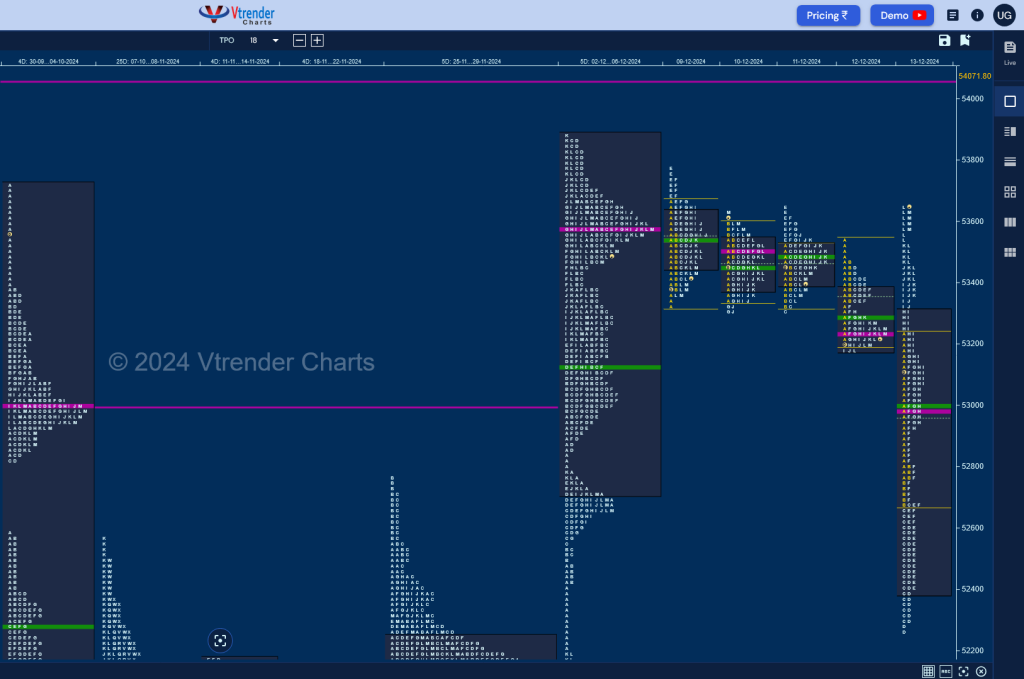
Monday – 53407 [ 53775 / 53326 ] Normal (Double Inside Bar)
Tuesday – 53577 [ 53624 / 53302 ] – Normal
Wednesday – 53391 [ 53648 / 53302 ] – Neutral
Thursday – 53216 [ 53537 / 53174 ] – Double Distribution (Down)
Friday – 53583 [ 53654 / 52264 ] – Neutral Extreme (Up)
BankNifty remained attached to the magnet of 53581 which was previous week’s prominent POC for the first 3 days forming a nice Gaussian Curve with yet another ultra prominent POC at 53515 from where it signalled a move away on Thursday with a narrow 363 point range DD (Double Distribution) profile to the downside which was followed up with an Open Drive Down on Friday as the imbalance got bigger negating the higher extension handle of 52780 & getting into the buying singles from 52424 to 52190 registering a low of 52264 taking support right above 03rd Dec’s SOC of 52284 and saw previous week’s initiative buyers come back strongly resulting in a V shape recovery not only negating the Open Drive but getting back into the 3-day balance promptly completing the 80% Rule as it made a high of 53654 before closing the week right at that magnet of 53581.
The weekly profile has formed an Inside Bar both in terms of range and value (53247-53397-53666) implementing phase 2 of the IPM (Initial Price Movement) testing the important buy side extension handles and finding evidence of strong demand as they built a base at 53397 which is this week’s POC so as long as BankNifty can sustain above it can look to resume the upmove towards the weekly VPOC of 54071 & ATH of 54467 in the coming week.
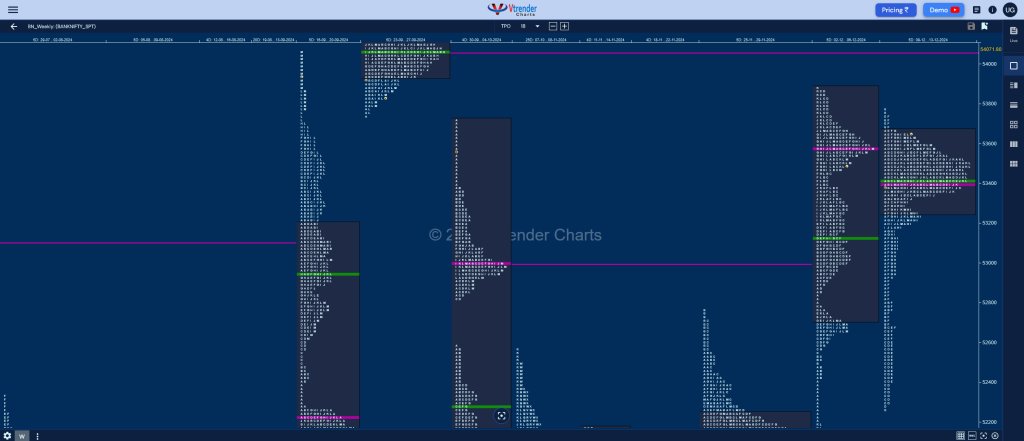
Click here to view this week’s MarketProfile of BankNifty on Vtrender Charts
Hypos for 16th Dec – 53583 [ 53654 / 52264 ] – Neutral Extreme (Up)
| Up |
| 53611 – M TPO h/b (13 Dec) 53740 – Sell tail (09 Dec) 53857 – Sell tail (05 Dec) 53941 – Weekly VAL (23-27 Sep) 54072 – Weekly VPOC (23-27 Sep) 54183 – VPOC (27 Sep) 54327 – FA (27 Sep) |
| Down |
| 53570 – M TPO low (13 Dec) 53442 – K TPO h/b (13 Dec) 53320 – H TPO tail (13 Dec) 53229 – NeuX Handle (13 Dec) 53119 – SOC (13 Dec) 52992 – POC (13 Dec) 52867 – F TPO h/b (13 Dec) |
Hypos for 17th Dec – 53581 [ 53738 / 53335 ] Normal
| Up |
| 53588 – M TPO high (16 Dec) 53740 – Sell tail (09 Dec) 53857 – Sell tail (05 Dec) 53941 – Weekly VAL (23-27 Sep) 54072 – Weekly VPOC (23-27 Sep) 54183 – VPOC (27 Sep) 54327 – FA (27 Sep) |
| Down |
| 53537 – 16 Dec Halfback 53404 – G TPO h/b (16 Dec) 53313 – Ext Handle (13 Dec) 53229 – NeuX Handle (13 Dec) 53119 – SOC (13 Dec) 52992 – VPOC (13 Dec) 52867 – F TPO h/b (13 Dec) |
Hypos for 18th Dec – 52834 [ 53515 / 52709 ] – Trend (Down)
| Up |
| 52840 – POC (17 Dec) 52948 – H TPO h/b (17 Dec) 53050 – SOC (17 Dec) 53165 – IBL (17 Dec) 53276 – PBH (17 Dec) 53420 – A TPO h/b (17 Dec) 53537 – 16 Dec Halfback |
| Down |
| 52821 – M TPO h/b 52735 – Buy tail (17 Dec) 52609 – SOC (13 Dec) 52540 – E TPO h/b (13 Dec) 52409 – E TPO low (13 Dec) 52304 – Buy tail (13 Dec) 52129 – Nov POC |
Hypos for 19th Dec – 52139 [ 52827 / 52010 ] – Normal Variation (Down)
| Up |
| 52160 – M TPO h/b (18 Dec) 52289 – POC (18 Dec) 52419 – 18 Dec Halfback 52547 – Ext Handle (18 Dec) 52709 – SOC (18 Dec) 52840 – VPOC (17 Dec) 52948 – H TPO h/b (17 Dec) |
| Down |
| 52129 – Nov POC 52010 – Buy Tail (Dec) 51840 – VPOC (02 Dec) 51736 – Buy tail (02 Dec) 51591 – Gap mid (25 Nov) 51482 – Weekly 1.5 IB 51353 – IB High (13 Nov) |
Hypos for 20th Dec – 51575 [ 51789 / 51263 ] – Normal (3-1-3)
| Up |
| to be updated… |
| Down |
| to be updated… |
