Nifty Spot: 19751 [ 19843 / 19480 ]
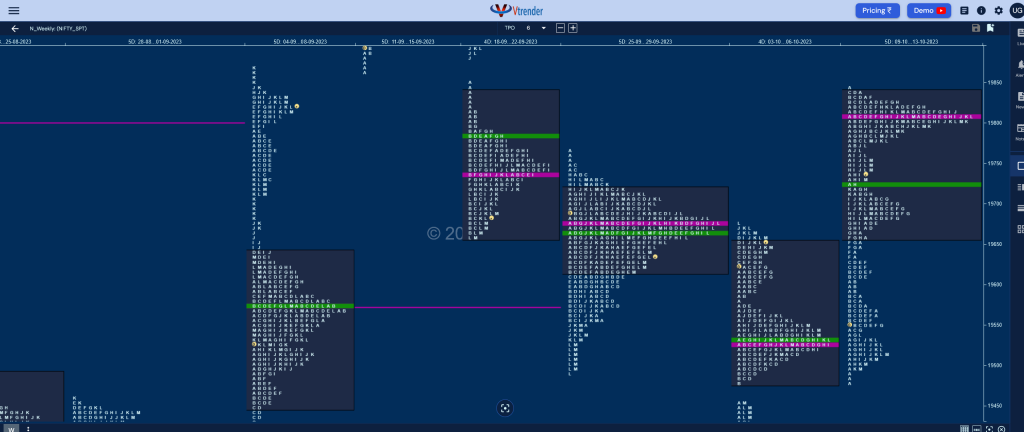
Previous week’s report ended with this ‘The weekly profile is a Neutral Extreme (NeuX) One to the upside which started off with an imbalance to the downside in the first part where it tagged the lower weekly VPOC of 19335 (28th Aug to 01st Sep) and having met the swing objective not only stalled the move lower but reversed to the upside with last week’s prominent POC of 19675 acting as a magnet which got hit into the close forming overlapping to lower Value with a prominent POC at 19480-19529-19655 and has left couple of extension handles lower at 19573 & 19452 which will be the levels to watch for on the downside with the immediate reference being at 19623 whereas on the upside, Nifty will need to stay above 19675 for a test of the weekly selling tails of 19750 & 19812 along with the extension handle at 19885‘

Monday
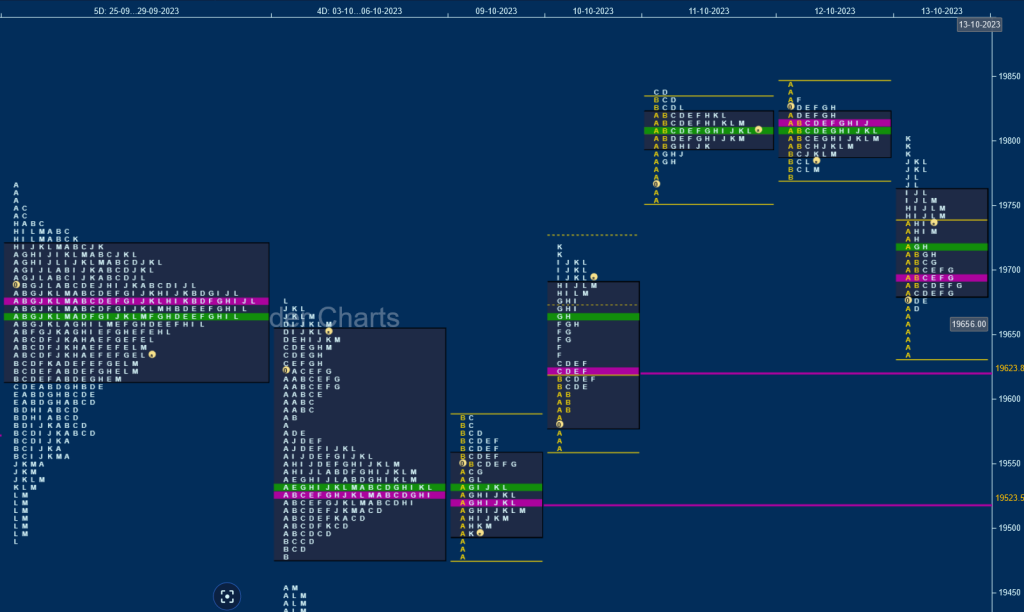
NeuX profile are known not to give a follow through as Nifty opened with a gap down of 114 points negating the higher weekly extension handle of 19573 and went on to make a low of 19480 taking support in the zone of singles from previous week’s profile after which it reversed the probe to the upside hitting 19587 in the B period but made a typical C side by just 1 point which stalled the upside resulting in a retracement down to 19496 forming a Normal Day with a close just below the dPOC of 19523
Tuesday
saw a higher open which not only repaired Monday’s poor highs but also left a small A period buying tail and went on to form a Double Distribution Trend Day Up with the help of an extension handle at 19631 as it even got above previous week’s high of 19675 closing above the September POC of 19675
Wednesday
The auction contiued the upside imbalance with a higher open scaling above the selling tails of 19750 & 19812 while making a high of 19832 in the Initial Balance but for the second time in the week stalled the initial probe with the dreaded C side play to 19839 after which it remained in a very narrow range forming a ‘p’ shape Normal Day closing around the ultra prominent POC 0f 19808
Thursday
made a look up above Wednesday’s high at open but could not sustain after posting new highs for the week at 19843 resulting in a small probe lower as it tagged 19772 in the IB taking support in stem of previous ‘p’ shaped profile and remained in this ultra narrow range of 71 points all day leaving a second succesive Normal Day with an overlapping plus prominent POC at 19809 with a small but important A period selling tail indicating that the upside was getting exhausted & the PLR (Path of Least Resistance) was turning to the downside
Friday
Nifty opened with a big 150 point gap down and went on to make a low of 19635 taking support right above Tuesday’s extension handle of 19631 marking the end of the downside as it gave a swift bounce back to 19736 in the A period but settled down into an OAOR with the range also contracting inside the A period with a slow probe lower for the first half of the day which ended with a PBL at 19670 in the D TPO. The auction then moved higher not only getting into the A period selling tail but even made multiple Range Extensions (RE) from the H to the K periods where it made a high of 19805 stopping right below the 2-day prominent POC of 19809 which triggered a quick liquidation drop down to 19729 into the close leaving a Normal Variation Day filling up the zone between the 2 daily VPOCs of 19623 & 19809

The weekly profile is a Trend One Up which took support in last week’s buying zone and almost completed the 3 IB objective of 19806 but at the same time saw the POC shift higher to 19809 indicating profit booking by the buyers leaving an irregular kind of a structure with some filling required in the zone between 19809 to 19680 which will be the reference for the coming week and a break of which could get a probe towards the daily VPOCs of 19623, 19523 & 19420 whereas on the upside, the magnet of 19809 will need to be taken out by initiative players for a probe towards the weekly extension handle of 19885 above which we have the daily VPOC of 19953 & the initiative selling tail from 20017 as probable objectives.
Click here to view this week’s MarketProfile of Nifty on Vtrender Charts
Hypos for the week 16th to 20th Oct 2023
| Up |
| 19776 – SOC from 13 Oct 19821 – 2-day VAH (11-12 Oct) 19871 – Gap mid (21 Sep) 19953 – VPOC (20 Sep) 20017 – Selling Tail (20 Sep) 20057 – Gap mid (20 Sep) 20114 – Closing PBH (14 Sep) 20147 – 2-day VAL (15-18 Sep) |
| Down |
| 19729 – Closing PBL (13 Oct) 19670 – Buying Tail (13 Oct) 19631 – Ext Handle (10 Oct) 19594 – Buying Tail (10 Oct) 19523 – VPOC from 09 Oct 19479 – Weekly Ext (02-06 Oct) 19420 – VPOC from 04 Oct 19369 – SOC from 04 Oct |
BankNifty Spot: 44287 [ 44710 / 43796 ]
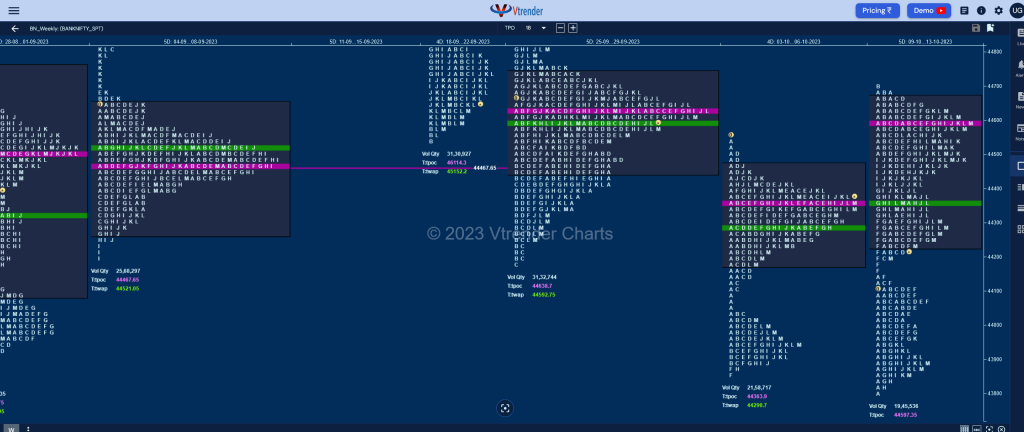
Previous week’s report ended with this ‘The weekly profile is a Normal Variation one to the downside which remained below previous week’s prominent POC of 44638 forming mostly lower Value at 44181-44364-44471 taking support at the prominent weekly HVN of 43863 (14th to 18th Aug) for the third time leaving a daily VPOC at 43911 & a small zone of singles from 44044 to 44108 which would be the support zones to watch for in the coming week as the structure also represents a Double Distribution with a close right at the upper HVN of 44364 which will be the opening reference for the coming week‘

Monday
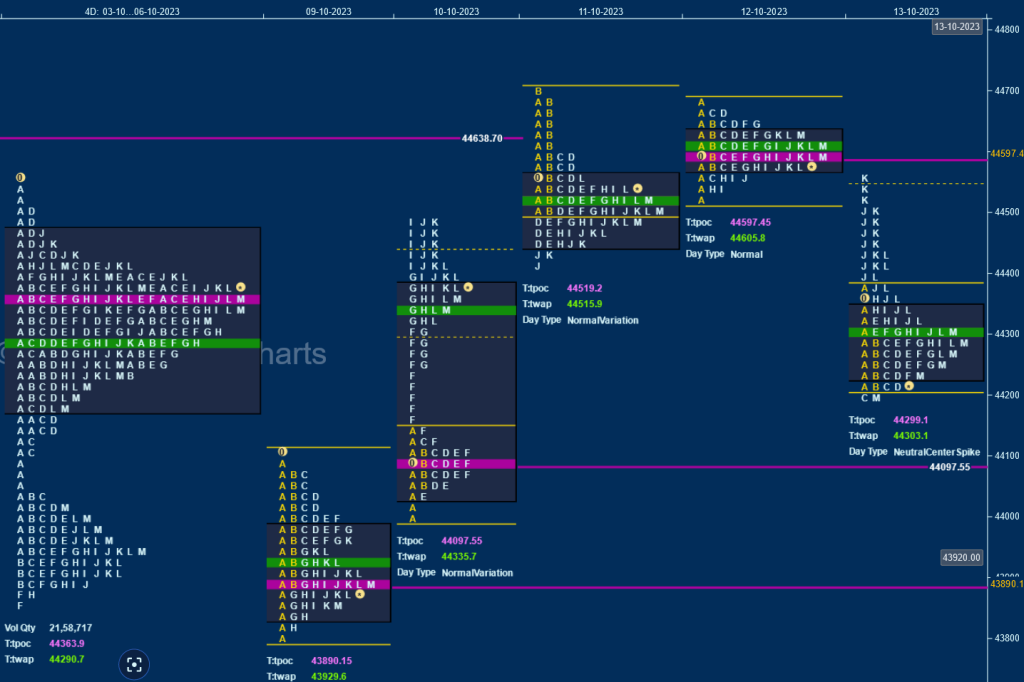
BankNifty opened with a 302 point gap down not only negating previous week’s singles zone from 44108 to 44044 but also made a look down below the lows of 43857 as it hit 43796 in the A period forming a large 316 point range in the first 30 minutes and remained in this range all day forming a Gaussian Curve with a close around the prominent POC of 43890
Tuesday
The auction opened higher and remained above Monday’s Value but remained in a very narrow 135 point range till the E period after which it left an extension handle at 44139 and a zone of singles till 44255 swiping through previous week’s Value while making a high of 44487 forming a Double Distribution (DD) Trend Day Up
Wednesday
saw the continuation of the imbalance to the upside with another gap up open where it tagged the weekly VPOC of 44638 while making a high of 44710 in the IB (Initial Balance) but could not extend any further leaving a narrow 299 point range Normal Day with a close at the prominent dPOC of 44519
Thursday
For a change, BankNifty made a very sedate start where it remained above 44519 but remained in an unusual tiny range of just 163 points not just in the IB but for the entire day forming another prominent POC at 44597 leaving an inside day indicating exhaustion to the upside
Friday
signalled a move away from the 2-day balance with a 277 point gap down open as it went on to test the DD singles from Tuesday while making a low of 44214 in the IB after which it made a typical C side extension to 44205 which was swiftly rejected triggering a slow probe higher back to the weekly POC of 44364 in the H period after which it left an extension handle in the J TPO confirming a FA at lows and almost tagged the 1 ATR objective of 44588 in the K where it made a high of 44563 stalling just below Thursday’s VAL resulting in a quick liquidation drop into the close where it went on to make marginal new lows of 44203 closing in an imbalance which it expected to continue at the next open

The weekly profile is a Double Distribution Trend Up one with overlapping to higher Value at 44090-44597-44702 and a small zone of singles from 44203 to 44139 which will be the support zone to watch for in the coming week below which it could go for a test of the daily VPOCs of 44097 & 43890 whereas on the upside, Friday’s SOC (Scene Of Crime) at 44413 along with Thursday’s prominent VPOC of 44597 will be the levels to look out for.
Click here to view this week’s MarketProfile of BankNifty on Vtrender Charts
Hypos for the week 16th to 20th Oct 2023
| Up |
| 44299 – dPOC from 13 Oct 44413 – SOC from 13 Oct 44510 – Selling tail (13 Oct) 44597 – VPOC from 12 Oct 44710 – Swing High (11 Oct) 44838 – VPOC from 25 Sep 45039 – Ext Handle (21 Sep) 45137 – VPOC from 21 Sep |
| Down |
| 44233 – VAL from 13 Oct 44097 – VPOC from 10 Oct 43965 – PBH from 09 Oct 43890 – VPOC from 09 Oct 43796 – Swing Low (09 Oct) 43672 – Monthly Tail (Aug) 43541 – Weekly FA (26 Jun) 43390 – Monthly Ext Handle (May) |
