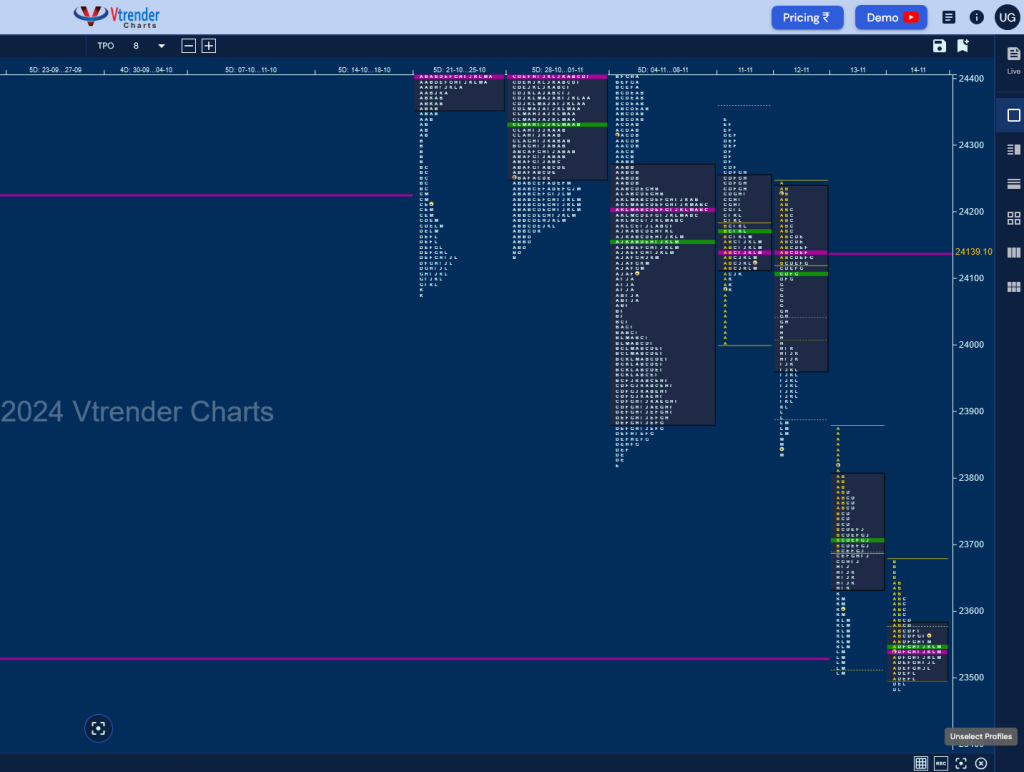
Nifty Spot: 23532 [ 24336 / 23484 ] Double Distribution (Down)
Previous week’s report ended with this ‘The weekly profile is an Outside Bar with mostly lower Value at 23886-24200-24267 and has left a probable Swing High on the bigger timeframe and will be weak in the coming week if stays below 24200 for a probable test of the important mid-year extension handle of 23754 and Jun’s VPOC of 23535‘

Monday – 24141 [ 24336 / 24004 ] Normal Variation (Up)
Tuesday – 23883 [ 24242 / 23839 ] Trend (Down)
Wednesday – 23559 [ 23873 / 23509 ] – Trend (Down)
Thursday – 23532 [ 23676 / 23484 ] Normal (‘b’ shape)
Friday – Holiday
Nifty took support in previous week’s low TPO zone leaving an A period buying tail from 24111 to 24004 on Monday and followed it up with a hat-trick of REs (Range Extension) to the upside looking up above previous Value but could not sustain leaving an important SOC at 24284 as it got back into previous Value and closed below the important reference of 24200 forming a ‘p’ shape profile with the POC at 24141 and continued to balance around it for the first couple of hours on Tuesday before it left an extension handle in the G TPO signalling the start of a fresh imbalance lower resulting in a Triple Distribution Trend Day Down breaking below previous week’s Value and making a low of 23839.
The auction continued the downmove on Wednesday leaving an initiative selling tail from 23807 to 23873 as it went on to break the monthly extension handle of 23754 and promptly went on to tag the expected objective of Jun’s VPOC of 23535 while making a low of 23509 forming rare back to back Trend Days Down and the expected move back to balance happened on Thursday where it tested the 5-day VAL of 23492 (18-24 Jun) but could not sustain below it forming a narrow range Normal Day with the close around the prominent POC of 23537.
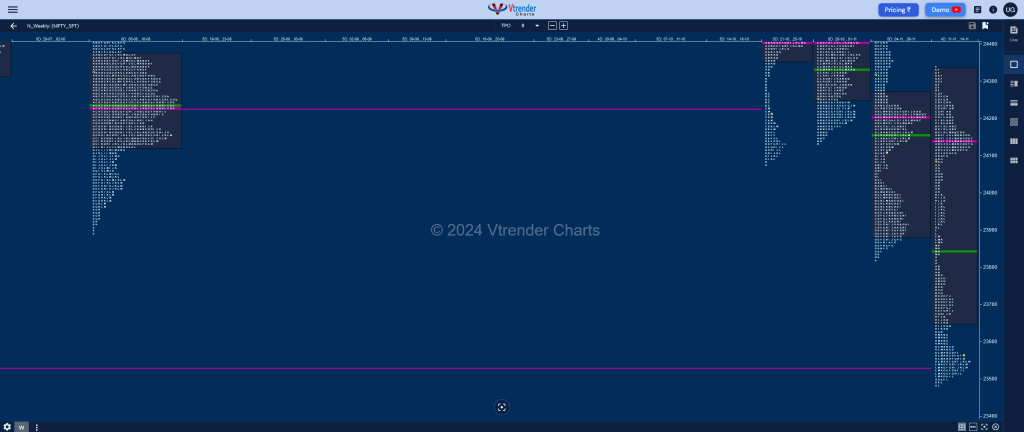
The weekly profile is a Double Distribution (DD) Trend Down one with an elongated range of 853 points with completely overlapping Value at 23653-24141-24333 & an extension handle at 24004 along with a low TPO zone till 23807 which will be the DD singles and the major supply zone for the coming week whereas the lower TPO HVN of 23544 being the immediate level on the upside whereas on the downside, 23456 will be a minor support below which a test of the lower weekly VPOC of 23332 and HVN of 23200 could come and a break of which could trigger a further drop towards 22995 & 22745 in the coming weeks.

Click here to view this week’s MarketProfile of Nifty on Vtrender Charts
Hypos for 18th Nov – 23532 [ 23676 / 23484 ] Normal (‘b’ shape)
| Up |
| 23544 – Weekly TPO HVN 23580 – 14 Nov Halfback 23645 – Sell Tail (14 Nov) 23691 – 13 Nov Halfback 23742 – D TPO h/b (13 Nov) 23782 – PBH (13 Nov) 23816 – Ext Handle (Nov) 23866 – Buy tail (12 Nov) |
| Down |
| 23537 – POC (14 Nov) 23486 – Buy tail (14 Nov) 23454 – Ext Handle (24 Jun) 23383 – Buy Tail (24 Jun) 23338 – Buy Tail (14 Jun) 23288 – 2-day VAL (10-11 Jun) 23247 – A TPO h/b (11 Jun) 23199 – VPOC (07 Jun) |
Hypos for 19th Nov – 23453 [ 23606 / 23350 ] Normal
| Up |
| 23459 – POC (18 Nov) 23515 – H TPO h/b (18 Nov) 23565 – Sell Tail (18 Nov) 23606 – Weekly IBH 23645 – Sell Tail (14 Nov) 23691 – 13 Nov Halfback 23742 – D TPO h/b (13 Nov) |
| Down |
| 23447 – M TPO low (18 Nov) 23401 – VAL (18 Nov) 23350 – Weekly IBL 23298 – 11 Jun Halfback 23247 – A TPO h/b (11 Jun) 23199 – VPOC (07 Jun) 23151 – PBL (07 Jun) |
Hypos for 21st Nov – 23518 [ 23780 / 23464 ] Neutral Extreme (Down)
| Up |
| 23518 – NeuX Handle (19 Nov) 23581 – SOC (19 Nov) 23623 – 19 Nov Halfback 23677 – B TPO h/b (19 Nov) 23716 – SOC (19 Nov) 23755 – POC (19 Nov) 23816 – Ext Handle (Nov) |
| Down |
| 23492 – M TPO h/b (19 Nov) 23459 – POC (18 Nov) 23412 – PBL (18 Nov) 23350 – Weekly IBL 23298 – 11 Jun Halfback 23247 – A TPO h/b (11 Jun) 23199 – VPOC (07 Jun) |

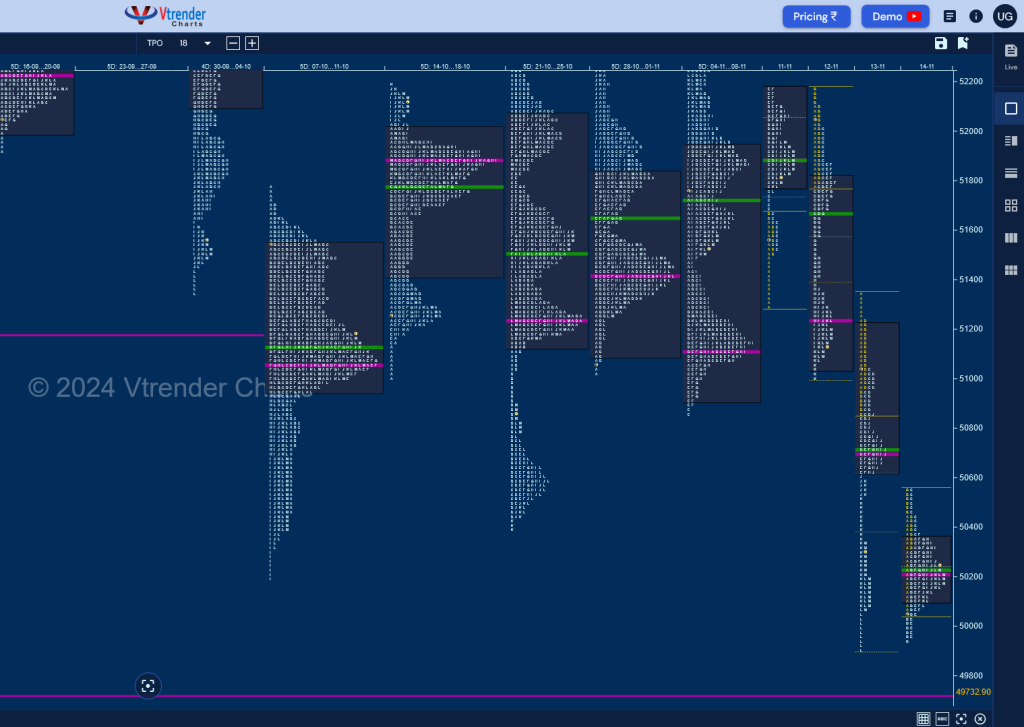
BankNifty Spot: 50179 [ 52177 / 49904 ] Trend (Down)
Previous week’s report ended with this ‘The weekly profile is a Neutral one which has extended previous week on both sides leaving a Swing reference of 50865 but the failure to close above 51764 means that a revisit to that FA could be on in the coming week which if broken and sustained could be the beginning of a fresh leg lower towards 50571 & 50194 whereas on the upside, 51954 & 52192 will be the major supply points above 51764 which if taken out on initiative buying can result in a probe higher towards 52451 & 52977‘

Monday – 51876 [ 52177 / 51294 ] – Double Distribution (Up)
Tuesday – 51157 [ 52169 / 51006 ] – Double Distribution (Down)
Wednesday – 50088 [ 51353 / 49904 ] – Trend (Down)
Thursday – 50179 [ 50561 / 49939 ] – Normal Variation (Down)
Friday – Holiday
BankNifty opened the week with an initiative buying tail from 51502 to 51294 and followed it up with a C side extension handle at 51674 as it scaled up above 51764 and made couple of REs but could only manage similar highs of 52177 & 52174 stalling just below the uppermost supply point for this week at 52192 as it closed around the POC of 51891 leaving a ‘p’ shape profile and made another attempt to probe higher on Tuesday but left an initiative selling tail from 52169 to 52087 confirming that sellers are holding this zone and they went on to form a Double Distribution Trend Day Down breaking below previous week’s POC of 51113 and tagged Oct’s VAL of 51008 completing the 80% Rule in the monthly Value with the dPOC matching with Oct’s POC of 51239.
The auction formed an initial balance around 51239 on Wednesday but left an important A period selling tail from 51244 to 51353 indicating that the sellers were building a fresh base to start a fresh drop which they did later in the day breaking below the Swing reference of 50865 with an extension handle and forging another Trend Day Down swiping through the levels of 50571 & 50194 as it went on to tag the daily VPOC of 49950 (16 Aug) while making a low of 49904 where it left a pretty prominent responsive tail till 50070 marking the end of the downside for the week as it formed a nice balance on Thursday testing the extension handle of 50541 on the upside where it left another A period selling tail and made a low of 49939 but left a tiny tail at the lows before closing around the POC.
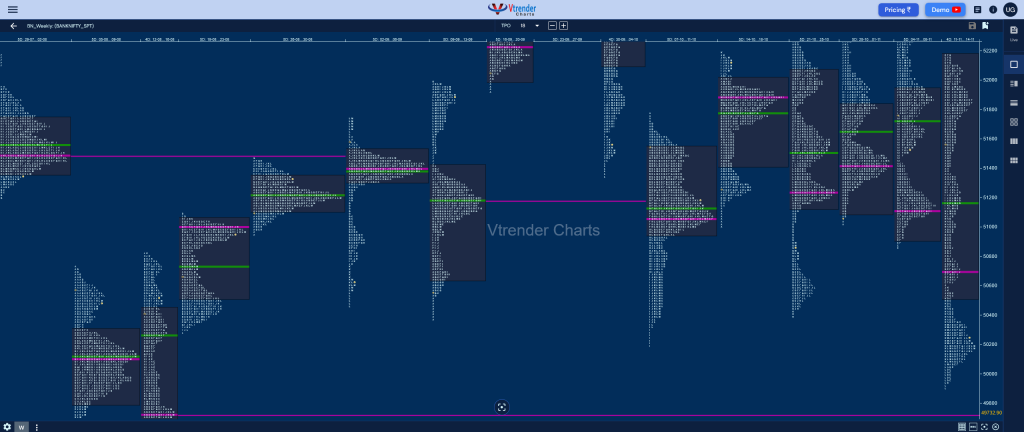
The weekly profile is a Trend One to the downside with an elongated range of 2273 points with completely outside Value at 50518-50689-52177 along with the lower TPO HVN at 50175 which will be the immediate reference on watch for the coming week staying below which BankNifty could continue the probe lower towards the weekly VPOCs of 49733 & 49326 whereas on the upside, 50620 & 50865 will be the major supply points along with 51055.

Click here to view this week’s MarketProfile of BankNifty on Vtrender Charts
Hypos for 18th Nov – 51157 [ 52169 / 51006 ] – Double Distribution (Down)
| Up |
| 50175 – Weekly TPO HVN 50250 – 14 Nov Halfback 50401 – C TPO h/b (14 Nov) 50544 – Sell Tail (14 Nov) 50689 – VPOC (13 Nov) 50865 – Monthly Ext Handle 51055 – B TPO h/b (13 Nov) |
| Down |
| 50162 – L TPO h/b (14 Nov) 50078 – PBL (14 Nov) 49966 – Buy tail (14 Nov) 49806 – FA (16 Aug) 49681 – Buy Tail (14 Aug) 49515 – 07 Jun Halfback 49326 – Weekly VPOC (03-06 Jun) |
Hypos for 19th Nov – 50363 [ 50445 / 50074 ] Normal (Inside Bar)
| Up |
| 50366 – POC (18 Nov) 50445 – Weekly IBH 50544 – Sell Tail (14 Nov) 50689 – VPOC (13 Nov) 50865 – Monthly Ext Handle 51055 – B TPO h/b (13 Nov) 51184 – Weekly TPO HVN |
| Down |
| 50311 – M TPO low (18 Nov) 50181 – 2-day VAL (14-18 Nov) 50074 – Weekly IBL 49966 – Buy tail (14 Nov) 49806 – FA (16 Aug) 49681 – Buy Tail (14 Aug) 49515 – 07 Jun Halfback |
Hypos for 21st Nov – 50626 [ 50983 / 50440 ] – Neutral
| Up |
| 50628 – SOC (19 Nov) 50748 – B TPO h/b (19 Nov) 50887 – POC (19 Nov) 51055 – B TPO h/b (13 Nov) 51184 – Weekly TPO HVN 51364 – PBH (12 Nov) 51487 – G TPO tail (12 Nov) |
| Down |
| 50590 – L TPO low (19 Nov) 50449 – Buy tail (19 Nov) 50311 – M TPO low (18 Nov) 50181 – 2-day VAL (14-18 Nov) 50074 – Weekly IBL 49966 – Buy tail (14 Nov) 49806 – FA (16 Aug) |

