Nifty Spot: 22023 [ 22526 / 21905 ]

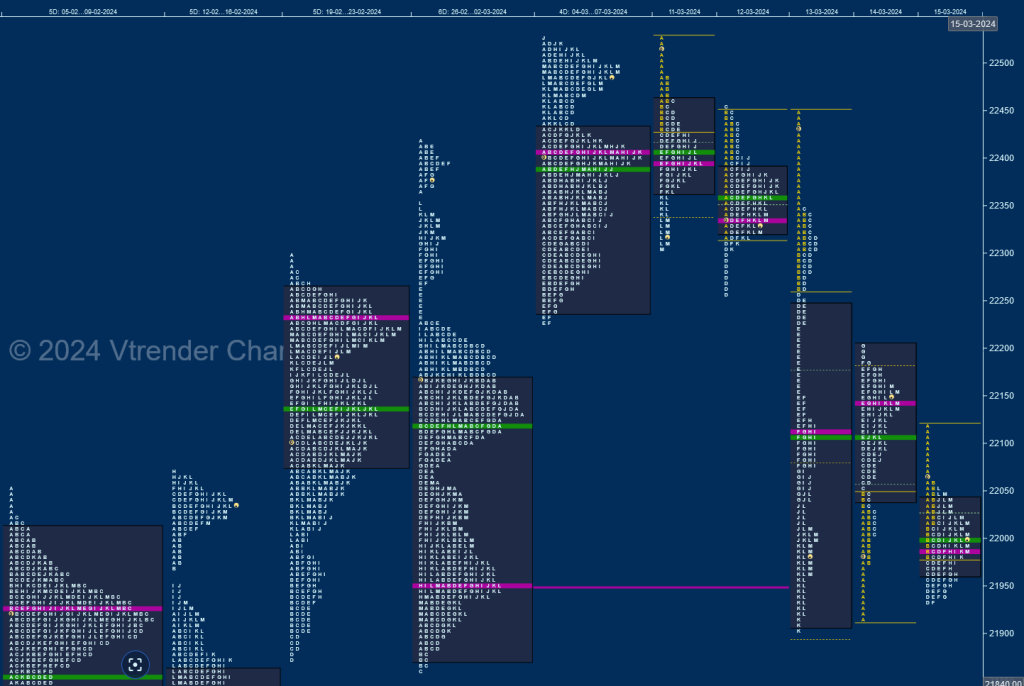
Nity opened the week with a probe above ATH of 22525 on Monday but could not sustain leaving an A period selling tail as it got back into previous week’s Value and filled up the upper part of the profile while making a low of 22307 after which it made an open around the developing monthly POC of 22399 on Tuesday but made the dreaded C side extension to 22452 getting rejected and formed a Neutral Centre Day with a FA (Failed Auction) at top.
The auction then made an initiative move to the downside on Wednesday leaving yet another A period selling tail from just below the FA of 22452 and left couple of extension handles at 22260 & 22224 marking the move away from previous week’s Value and probing lower into the prior week’s (26 Feb – 02 Mar) Value as it went on to the weekly VPOC of 21953 while making a low of 21905 leaving a Trend Day Down.
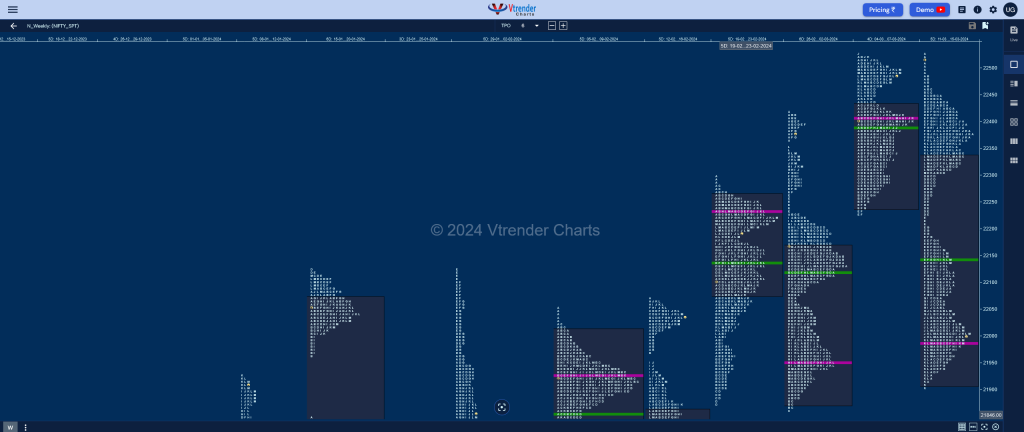
The imbalance of 621 points then led to a balance over the last 2 days as Nifty formed a double inside bar on Friday leaving a small buying tail from 21931 to 21917 on the downside along with a VPOC of 22145 below the immediate extension handle of 22224 on the upside which will be the levels to watch in the coming week. This week’s structure was a Double Distribution Trend one to the downside with the upper TPO HVN at 22376 and the lower one at 21987 with Value being overlapping to lower at 21907-21987-22333.

Click here to view this week’s MarketProfile of Nifty on Vtrender Charts
Weekly Hypos
| Up |
| 22047 – Monthly IBH 22090 – IB tail mid (15 Mar) 22145 – VPOC (15 Mar) 22187 – Sell tail (14 Mar) 22224 – EH (13 Mar) |
| Down |
| 22016 – M TPO h/b 21972 – PBL (15 Mar) 21930 – Feb POC 21897 – PBL (29 Feb) 21860 – FA (29 Feb) |
BankNifty Spot: 46594 [ 47853 / 46310 ]

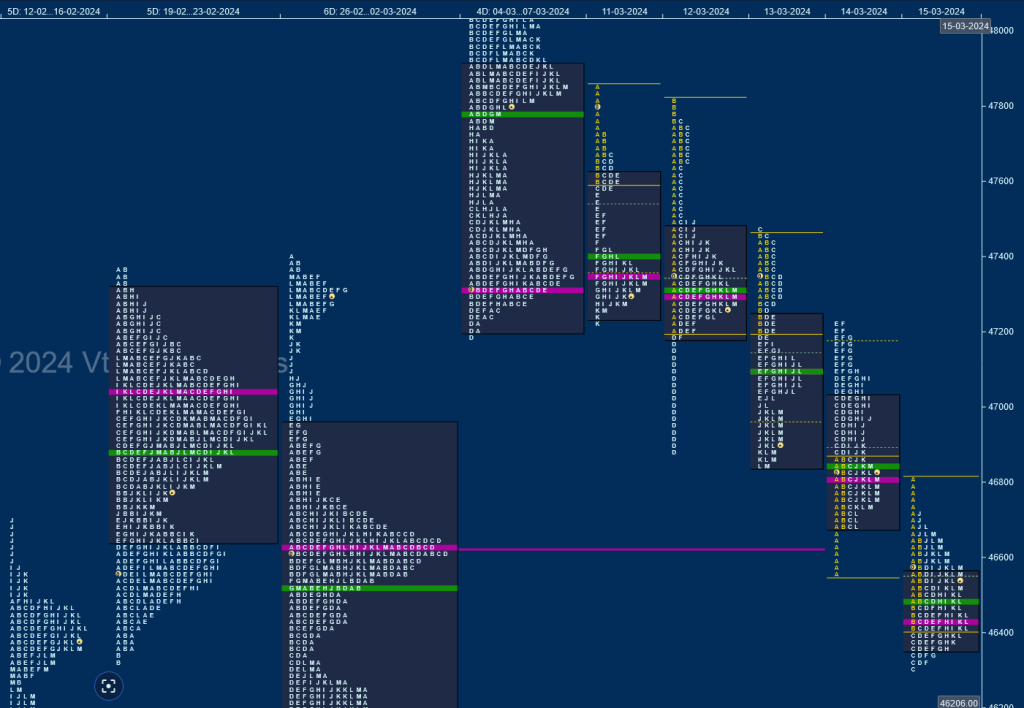
BankNifty opened in previous week’s Value right below last Friday’s VPOC of 47855 filling up the zone between the 2 TPO HVNs of 47340 to 47850 on the first 2 days but at the same time made lower REs (Range Extension) in both the sessions indicating that the PLR (Path of Least Resistance) was to the downside.
This got further confirmation as the auction confirmed a FA at 47468 on Wednesday and formed a Neutral Extreme Day Down completing the 1 ATR objective of 46848 into the close while making new lows for the week at 46842 and continued the imbalance with a lower open on Thursday and a tag of the weekly VPOC of 46622 (26 Feb to 02 Mar) as it made a low of 46565 and saw some profit booking by the sellers triggering mutliple REs to the upside for the first time in the week but ended up stalling at previous day’s IBL of 47210 which was also previous week’s VAL marking re-entry of supply who then pushed it down to 46688 into the close.
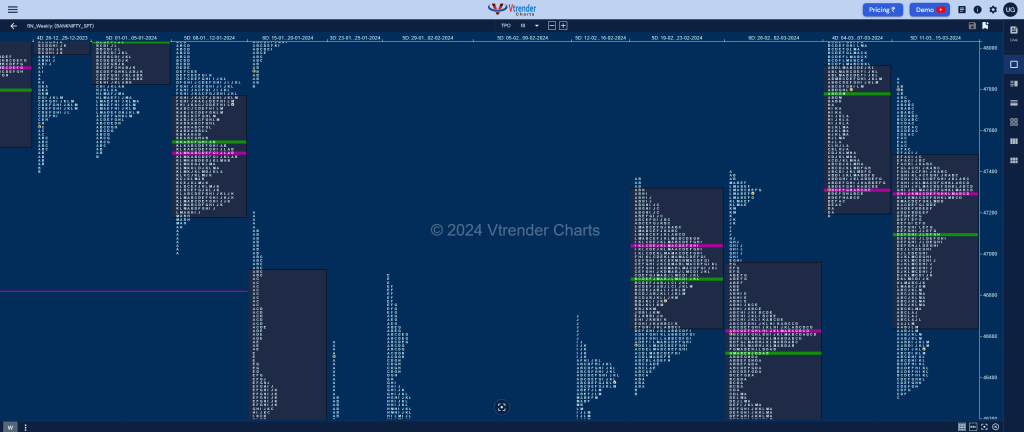
BankNifty then resumed the downside probe at open on Friday where it left an A period selling tail and made lower lows of 46418 in the B TPO looking all set to tag the 2 ATR target of 46227 from 47468 but made the dreaded C side extension to 46310 which marked the lows of the week as the 01st Mar’s initiative buying tail was defended resulting in a nice balanced profile for the day with a prominent POC at 46431. The weekly profile is a Trend Down one with overlapping POC to lower Value at 46647-47299-47468 with the Swing reference also coinciding at the FA of 47468 and can continue to probe lower towards the 2 ATR target of 46227 and Feb’s VWAP of 46119 in the coming week with the immediate reference on the upside being Thursday’s VPOC of 46807.

Click here to view this week’s MarketProfile of BankNifty on Vtrender Charts
Weekly Hypos
| Up |
| 46593 – M TPO halfback 46711 – Sell Tail (15 Mar) 46845 – C_PBH (14 Mar) 46980 – I TPO h/b 47087 – SOC (14 Mar) |
| Down |
| 46559 – VAH (15 Mar) 46381 – PBL (15 Mar) 46227 – 2 ATR (FA 47468) 46119 – Feb series VWAP 45995 – Halfback (29 Feb) |
