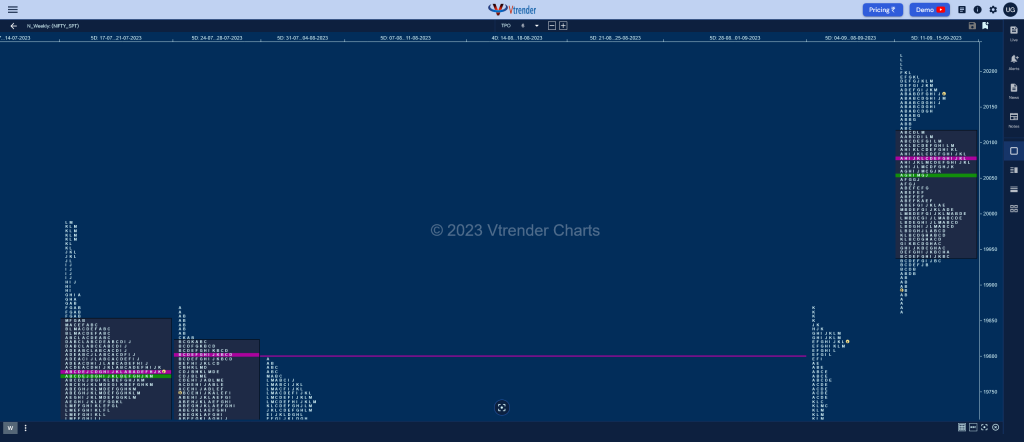
Nifty Spot Weekly: 20192 [ 20222 / 19865 ]
Previous week’s report ended with this ‘The weekly profile is a Double Distribution Trend Up on with completely higher Value at 19447-19574-19639 from where it has moved away with an extension handle at 19642 and has a fast zone of singles till 19711 above which Friday’s FA of 19727 and extension handle of 19792 with be the important levels to watch for on the downside in the coming week whereas on the upside, this week’s selling tail from 19842 along with the July’s responsive selling tail from 19887 to 19992 would be the references to watch as Nifty has a strong chance to hit new ATH (All Time High) on or before the Bappa Day on 18th Sep‘
Monday – Nifty opened with a gap up above previous week’s high not only negating the selling tail from 19842 to 19867 but got accepted in July’s selling singles from 19887 to 19992 as it made a high of 19939 in the IB leaving an initiative buying tail from 19884 to 19865 after which it made couple of small REs higher to 19961 in the G peirod but settled down into a narrow range balance after it forming a ‘p’ shape profile before it gave a spike higher into the close hitting new ATH of 20008
Tuesday – saw the continuation of the spike with another big gap up of 113 points but was also an OH (Open=High) start at 20110 and saw a swift rejection back into previous day’s range & triggering the 80% Rule in the value as it went on to make a low of 19915 in the IB forming a large 196 point range leaving a long initiative selling tail from 20036 to 20110. The auction however took support at Monday’s Value leaving a small buying tail till 19932 and remained in this zone between the 2 tails forming a balance for the rest of the day leaving a PBH at 20039 in the F period and closing right at the dPOC of 19994 leaving a 3-1-3 profile
Wednesday – began with an OAIR continuing to build TPOs at 19994 for the first couple of hours before Nifty made a RE to the upside in the E period and followed it up with couple of extension handles at 20035 & 20048 in the next 2 getting into previous day’s initiative selling tail and getting accepted in it as it went on to make similar highs of 20096 leaving a Double Distribution Trend Day Up with the dPOC shifting higher to 20080 into the close
Thursday – The auction opened higher hitting new ATH of 20167 in the A period but formed a similar high in the B indicating no fresh demand coming in resulting in a long liquidation probe down back into the upper distribution of Wednesday’s DD profile as it tested the higher extension handle of 20048 while making a low of 20043 leaving a PBL there to form a ‘b’ shape kind of a profile with overlapping Value and POC once again at 20080
Friday – Nifty repaired the poor highs of 20167 by hitting 20173 in the A period after which it settled down into an OA forming a narrow 44 point range IB after which it made a hat-trick of REs to the upside from the D to the F periods but could only manage to tag 20196 indicating poor trade facilitation which triggered a swipe lower in the G down to 20134 as it just above managed to hold on to the A period buying tail marking the end of the downside for the day and rotating back to the highs this time making a swipe higher in the L where it hit new ATH of 20222 completing the 2 ATR objective from previous week’s POC of 19574 but left a small responsive selling tail resulting in a retracement back to 20165 into the close leaving a nice 3-1-3 balanced profile on the daily with completely higher value
Click here to view the daily MarketProfile of Nifty on Vtrender Charts

The weekly profile is a Triple Distribution Trend Up one allbeit within a narrow range of 357 points with a buying tail at lows from 19884 to 19820 and couple of TPO HVNs at 19998 & 20078 along with a currently developing one at 20179 which has formed completely higher Value at 19941-20078-20114 but has also left a small responsive selling tail at top from 20201 to 20222 which will be the immediate zone to watch on the upside in the coming week whereas on the downside, staying below 20179 we could have a fill up happen in this week’s low volume zones first till 20078 and below that further down to 19998 as Nifty makes the transition from imbalance to balance as it has already ran up 967 points in this month

Click here to view this week’s MarketProfile of Nifty on Vtrender Charts
Weekly Hypos for Nifty (Spot) for the week 18th to 22nd Sep 2023
A) Nifty needs a drive above 20201 for a probe to 120251 / 20314 / 20355 / 20410 / 20460 / 20500 / 20553
B) Accepting below 20179 could lead to a test of 20134 / 20079 / 20035 / 19998 / 19932 / 19884 / 19820
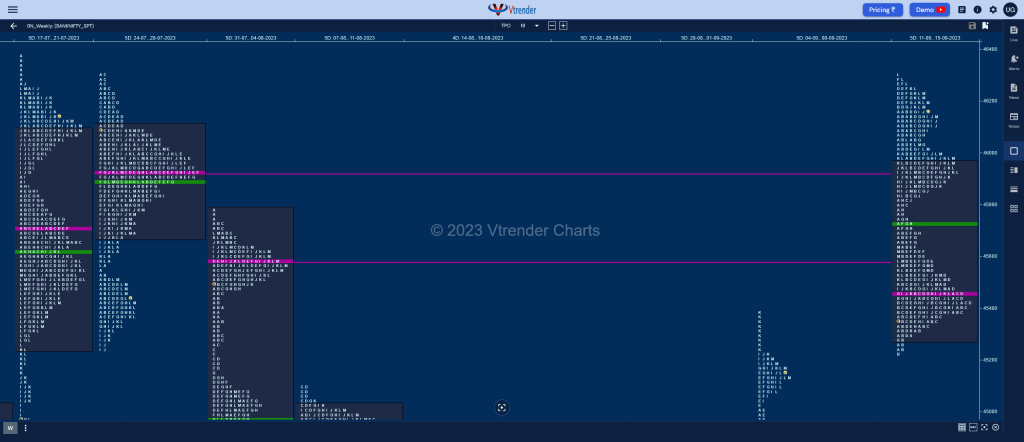
BankNifty Spot Weekly: 46231 [ 46310 / 45231 ]
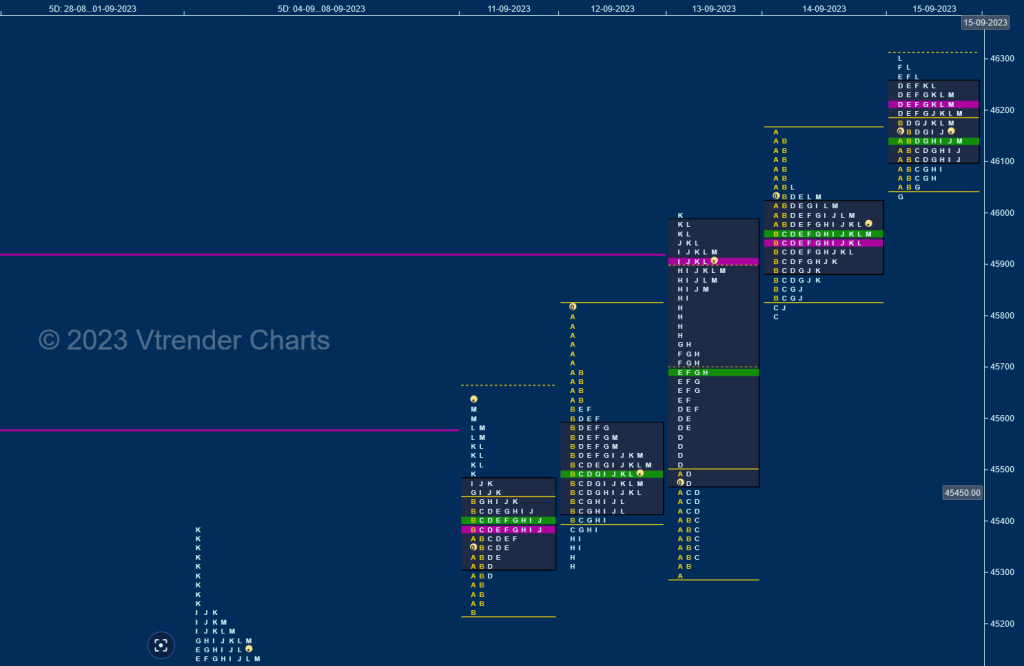
Previous week’s report ended with this ‘The weekly profile is a Neutral Extreme one to the upside with BankNifty forming a balance insside previous week’s Value for 3.5 days and the probe lower being rejected at 44207 where it confirmed a weekly FA in form of a buying extension handle at 44689 after which it gave another FA on Friday at 44812 and went on to complete the 1 ATR objectives of 45148 & 45232 respectively while making a high of 45383. Value for the week remained inside preivious week thanks to the majority of this week forming a balance but the 2 extension handles at 44689 & 45002 signal a start of a fresh imbalance and will be the important swing references on the downside going forward with Friday’s POC of 45131 being the immediate level to watch whereas on the upside, it will need to take out the responsive selling tail from 45231 to 45383 above which we have the monthly singles of August from 45405 above which it can continue higher towards the weekly VPOCs of 45592 & 45935 in the coming week‘
Monday – BankNifty opened higher but stalled right below 45383 as it made a high of 45370 and probed lower making new lows for the day at 45231 at the start of the B period taking support right at the base of the responsive selling tail which was the first hypo for this week on the upside displaying change of polarity after which it made marginal new highs of 45411 in the IB followed by a period of consolidation as it formed Value in the selling singles which was a bullish sign and late in the day made a move higher leaving an extension handle at 45486 in the K TPO followed by a spike from 45540 to 45636 tagging the first of the higher weekly VPOCs of 45592
Tuesday – The auction continued the upside imbalance with a big gap up open of 323 points but made a freak OH (Open=High) tick at 45893 and saw profit booking by the buyers which triggered a swift move back into Monday’s range as it left an extension handle at 45645 in the B period after which it went on to almost complete the 80% Rule in previous value making couple of REs in the C & H TPOs where it made a low of 45322 before closing the day near the prominent TPO POC of 45500 leaving a ‘b’ shape long liquidation profile
Wednesday – started with a move away from previous day’s POC to the downside even making a look down below 45322 as it hit 45299 but did not find any fresh supply as it formed a narrow 92 point range inside bar in the B period showing poor trade facilitation to the downside after which the buyers stepped in aggressively from the D TPO onwards starting with an extension handle at 45499 after which it got into Tuesday’s A period selling singles with the second extension handle at 45612 and finally made it a hat-trick giving the third one at 45751 as it went on to hit new highs for the week tagging the higher weekly VPOC of 45935 while making a high of 45990 leaving a Double Distribution Trend Day Up
Thursday – BankNifty resumed the trend of higher opens scaling above the BRN of 46000 and hitting new highs for the week at 46153 in the A period but did not find any fresh demand and probed lower in the B where it got back into Wednesday’s upper distribution and made a C side extension to 45801 marking the end of the downmove as it formed a nice balance for the rest of the day leaving a ‘b’ shape profile with a prominent POC at 45952 and overlapping to higher Value
Friday – The auction opened above previous Value and made a high of 46176 in the IB forming a very narrow 130 point range as it tested 27th Jul’s extension handle of 46175 and made a RE to the upside in the D period followed by marginal new highs in the E & F where it hit 46280 looking exhausted on the upside as the inventory seemed to have got too long which triggered a swipe lower in the G TPO as it went on to make new lows for the day at 46028 but got rejected above previous Value. Once the inventory management was done, the upmove resumed as BankNifty got above highs of G and even made a fresh RE in the L tagging 46310 which was the final hypo for this week and the FA from 27th Jul on the higher timeframe and expectedly saw profit booking by longs as it made a retracement back to 46138 into the close
Click here to view the daily MarketProfile of BankNifty on Vtrender Charts

The weekly profile is a Double Distribution Trend One Up with completely higher Value at 45281-45450-45958 which not only tagged the higher weekly VPOCs of 45592 & 45935 but also managed to tag the weekly FA of 46310 just below the ATH of 46369 which will be the reference on the upside for the coming week whereas on the downside, we have the upper distribution TPO HVN at 45918 which will be the first line of support below which there is the DD zone down till 45414 which could see some filling happening in the coming week.

Click here to view this week’s MarketProfile of BankNifty on Vtrender Charts
Weekly Hypos for BankNifty (Spot) for the week 18th to 22nd Sep 2023
A) BankNifty needs a drive from 46250 for a rise to 46369 / 46492 / 46558 / 46708 / 46870 / 46955 / 47039 / 47202
B) Accepting below 46217, the auction could test 46100 / 46028 / 45899 / 45751 / 45612 / 45499 / 45400 / 45250
