Nifty Spot: 19731 [ 19875 / 19414 ]
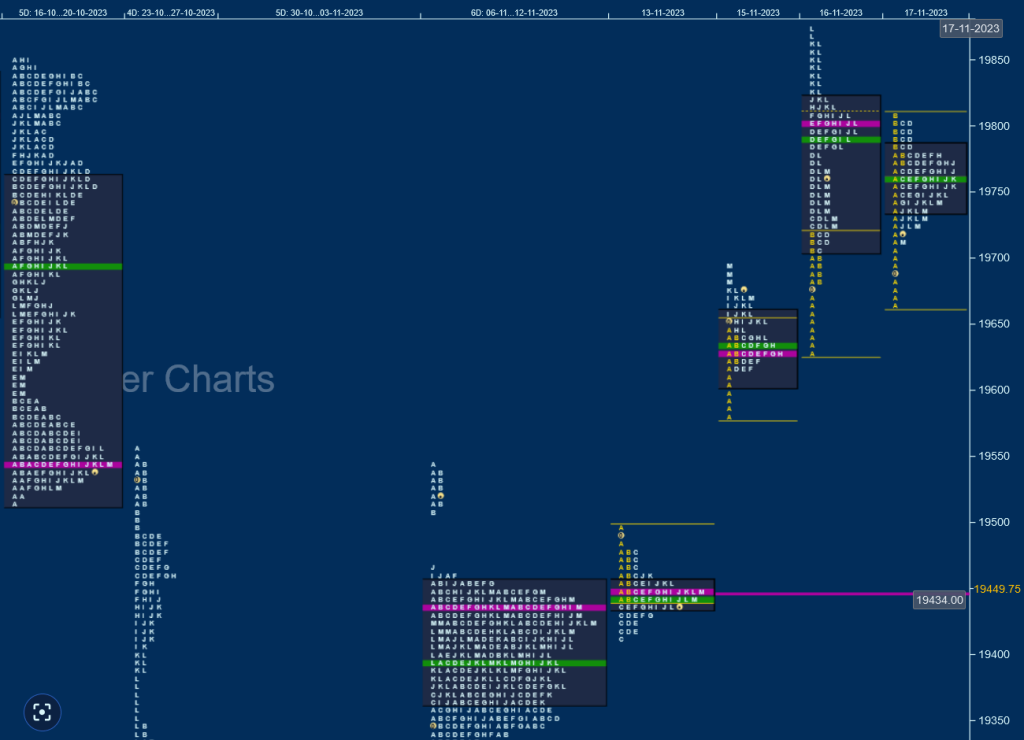
Previous week’s profile was a well balanced one inside a narrow range of just 155 points but formed completely higher Value at 19365-19434-19456 with a close around the prominent POC of 19434 looking set for a move away from this zone which could be the start of a fresh imbalance

Monday – 19443 (19494 / 19414)
Nifty opened higher but left an initiative selling tail from 19479 to 19494 getting back into previous week’s range & Value triggering the 80% Rule and went on to make a C side extension breaking below the weekly POC of 19434 as it made a low of 19414 but could not extend any further triggering a bounce back to the weekly VAH of 19456 where it left similar highs before closing the day at the prominent POC of 19449
Tuesday – Holiday
Wednesday -19675 (19693 / 19579)
The auction opened with a big 208 point gap up signalling a move away from balance and the start of a new trending move to the upside which was confirmed further with an A period buying tail from 19614 to 19579 as it formed a ‘p’ shape profile for the day with the POC at 19630 and a small spike higher to 19693 into the close
Thursday – 19765 (19875 / 19627)
Nifty opened inside the spike zone and went on to test the yPOC of 19630 as it made a low of 19627 but was swiftly rejected triggering a trending move higher for most part of the day resulting in a huge 248 point upmove for the day which was the biggest daily range of the month as it went on to repair the weekly poor highs from October (19843 & 19849) while making a high of 19875 but left a small responsive selling tail just below the weekly selling extension handle of 19885 (18-22 Sep 2023) along with a Scene Of Crime (SOC) at 19816 causing a sharp liquidation drop down to 19722 into the close
Friday – 19731 (19806 / 19667)
saw a freak tick of 19667 at the open but could not sustain as it made a good bounce back to 19806 in the Initial Balance (IB) stalling right below the SOC of Thursday and could not extend any further forming a slow probe lower for the rest of the day inside the IB making a low of 19715 into the close leaving a ‘p’ shape profile for the day which filled up the low volume zone of Thursday and has a prominent POC at 19762

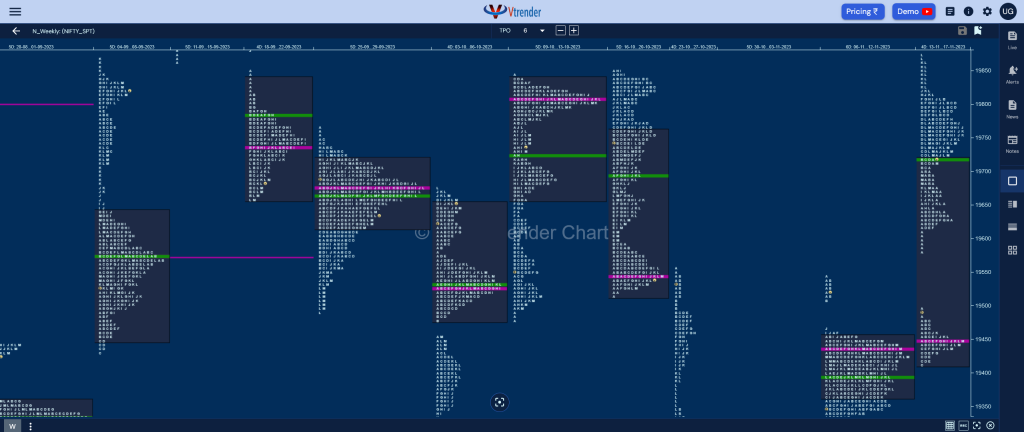
The weekly profile is an elongated 461 point range Double Distribution Trend Up one with mostly higher Value at 19415-19449-19718 and a zone of singles from 19479 to 19614 which Nifty could fill up in the coming week if it stays below Friday’s POC of 19762 whereas on the upside, we will need initiative buying activity at Thursday’s SOC of 19816 for a test of the weekly selling handles of 19885 & 20017 from the 18th to 22nd Sep profile
Click here to view this week’s MarketProfile of Nifty on Vtrender Charts
Hypos for the week 20th to 24th Nov 2023
| Up |
| 19762 – dPOC from 17 Nov 19816 – SOC from 16 Nov 19885 – Ext Handle (18-22 Sep) 19953 – VPOC from 20 Sep 20017 – Selling Tail (20 Sep) |
| Down |
| 19715 – Buying Tail (17 Nov) 19630 – dPOC from 15 Nov 19547 – DD singles mid (13-17 Nov) 19494 – Ext Handle (15 Nov) 19449 – VPOC from 13 Nov |
BankNifty Spot: 43584 [ 44421 / 43513 ]
to be updated…
