Nifty Spot: 24854 [ 25212 / 24567 ] Neutral Extreme (Down)
Previous week’s report ended with this ‘Nifty formed a nice Gaussian Curve with completely lower Value at 24891-24965-25124 with a close right at the prominent POC so has a very good chance of getting back to imbalance mode in the coming week with the immediate downside objectives being 24862-24802 zone & 24581 whereas the longer term ones at 24416 & 24149 whereas on the upside, 25088-25134 will be the first section to be taken out above which Nifty could go for 25522 & 25770‘
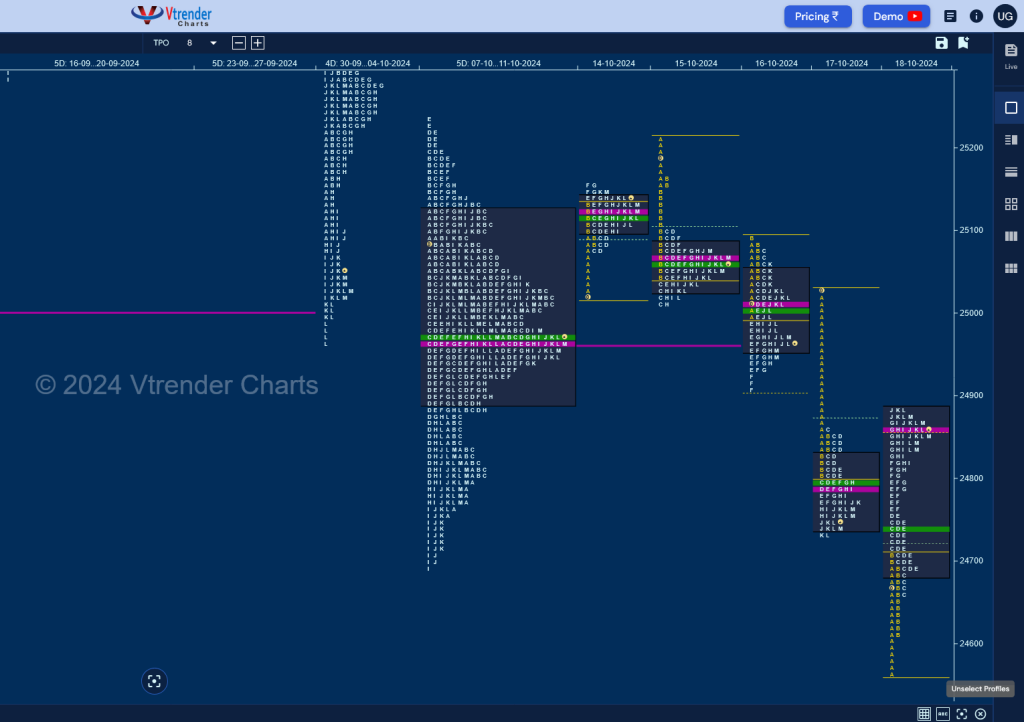
Monday – 25128 [ 25159 / 25017 ] Normal (‘p’ shape)
Tuesday – 25057 [ 25212 / 25008 ] Outside Bar (‘b’ shape)
Wednesday – 24971 [ 25093 / 24908 ] – Normal Variation (Down)
Thursday – 24749 [ 25029 / 24728 ] Trend (Down)
Friday – 24854 [ 24886 / 24567 ] – Trend (Up)
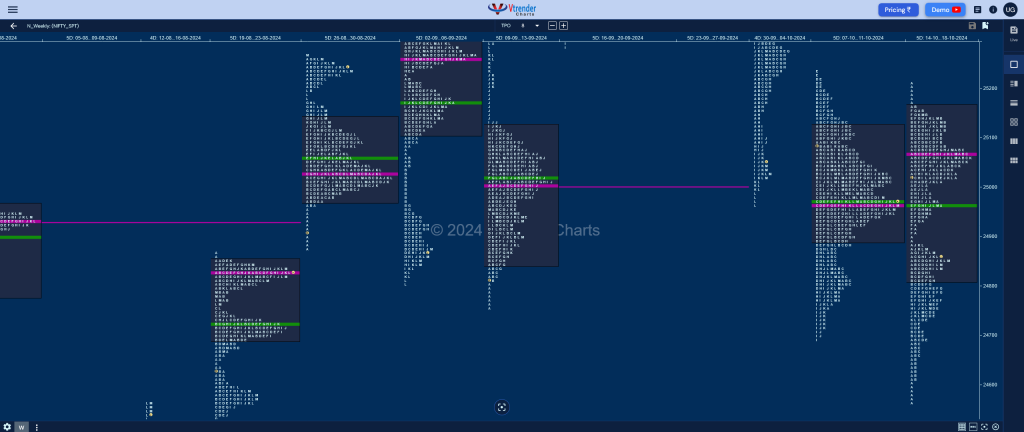
Nifty formed a Neutral Extreme one to the downside which not only confirmed a weekly FA (Failed Auction) at 25212 leaving a selling tail till 25159 and breaking below the zone of 24862-24802 completing the 1 ATR objective of 24677 but went on to tag the lower VPOC of 24581 while making a low of 24567 which saw profit booking by sellers combined with buyers coming back as it left singles till 24611 triggering a big bounce back to 24886 into the close on Friday.
Value was overlapping at both ends at 24815-25064-25160 as the auction failed to move away from previous week’s balance as seen with tails at top & bottom so will need to negate either 24611 on the downside for a probe towards weekly HVNs of 24420 & 24304 along with the VPOC of 24149 (12-16 Aug) whereas on the upside, it will need to sustain above 25160 and negate the weekly FA of 25212 for a test of the weekly HVNs of 25272 & 25415 above which can go for Sep’s VWAP of 25539
Click here to view this week’s MarketProfile of Nifty on Vtrender Charts
Hypos for 21th Oct– 24854 [ 24886 / 24567 ] – Trend (Up)
| Up |
| 24876 – M TPO high (18 Oct) 24934 – A TPO h/b (17 Oct) 24968 – M TPO high (16 Oct) 25013 – POC (16 Oct) 25060 – Sell Tail (16 Oct) 25110 – 15 Oct Halfback |
| Down |
| 24833 – PBH (18 Oct) 24794 – E TPO high (18 Oct) 24754 – Ext Handle (18 Oct) 24705 – IBH (18 Oct) 24658 – B TPO h/b (18 Oct) 24611 – Buy Tail (18 Oct) |
Hypos for 22nd Oct– 24781 [ 24978 / 24679 ] Normal (‘b’ shape)
| Up |
| 24789 – 3-day POC (17-21 Oct) 24841 – K TPO h/b (21 Oct) 24879 – Sell Tail (21 Oct) 24928 – IS tail mid (21 Oct) 24978 – Weekly IBH 25013 – POC (16 Oct) |
| Down |
| 24763 – M TPO h/b (21 Oct) 24711 – Buy Tail (21 Oct) 24658 – B TPO h/b (18 Oct) 24611 – Buy Tail (18 Oct) 24567 – TD Low (18 Oct) 24505 – VPOC (16 Aug) |
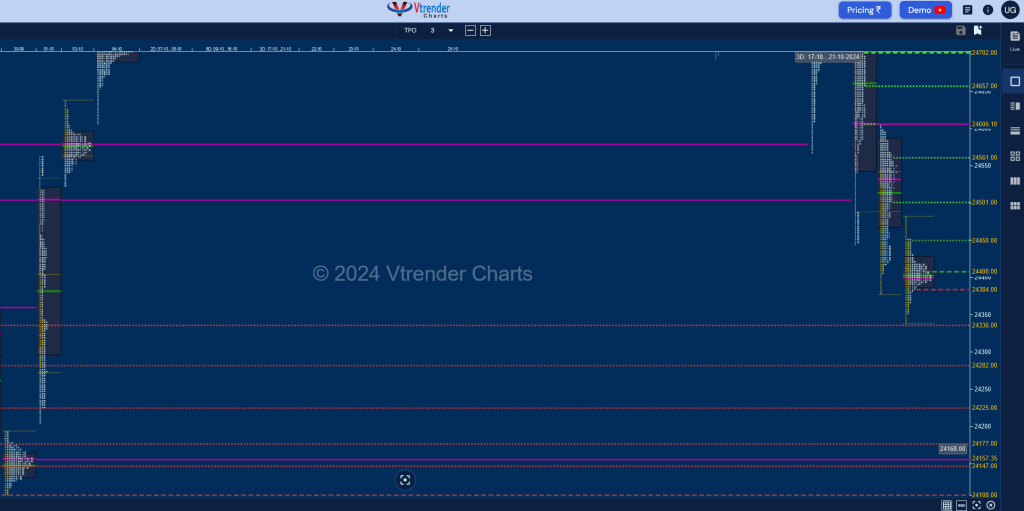
Hypos for 23rd Oct– 24472 [ 24882 / 24445 ] Trend (Down)
| Up |
| 24472 – Previous Close 24504 – L TPO h/b (22 Oct) 24569 – Ext Handle (22 Oct) 24606 – POC (22 Oct) 24658 – Ext Handle (22 Oct) 24702 – PBH (22 Oct) |
| Down |
| 24467 – M TPO h/b (22 Oct) 24420 – Weekly HVN (12-16 Aug) 24384 – 16 Aug Halfback 24344 – SOC (16 Aug) 24275 – SOC (16 Aug) 24226 – Buy tail (16 Aug) |
Hypos for 24th Oct– 24435 [ 24604 / 24378 ] – Normal Variation (Up)
| Up |
| 24456 – K TPO h/b (23 Oct) 24502 – SOC (23 Oct) 24562 – H TPO h/b (23 Oct) 24606 – VPOC (22 Oct) 24658 – Ext Handle (22 Oct) 24702 – PBH (22 Oct) |
| Down |
| 24429 – M TPO h/b (23 Oct) 24384 – 16 Aug Halfback 24344 – SOC (16 Aug) 24275 – SOC (16 Aug) 24226 – Buy tail (16 Aug) 24157 – VPOC (14 Aug) |
Hypos for 25th Oct– 24399 [ 24480 / 24341 ] Normal
| Up |
| 24410 – 24 Oct Halfback 24451 – Sell Tail (24 Oct) 24502 – SOC (23 Oct) 24562 – H TPO h/b (23 Oct) 24606 – VPOC (22 Oct) 24658 – Ext Handle (22 Oct) 24702 – PBH (22 Oct) |
| Down |
| 24386 – K TPO h/b (24 Oct) 24338 – Monthly VPOC (Aug) 24284 – E TPO h/b (16 Aug) 24226 – Buy tail (16 Aug) 24177 – PBH (14 Aug) 24148 – Weekly VPOC (12-16 Aug) 24109 – Buy Tail (14 Aug) |
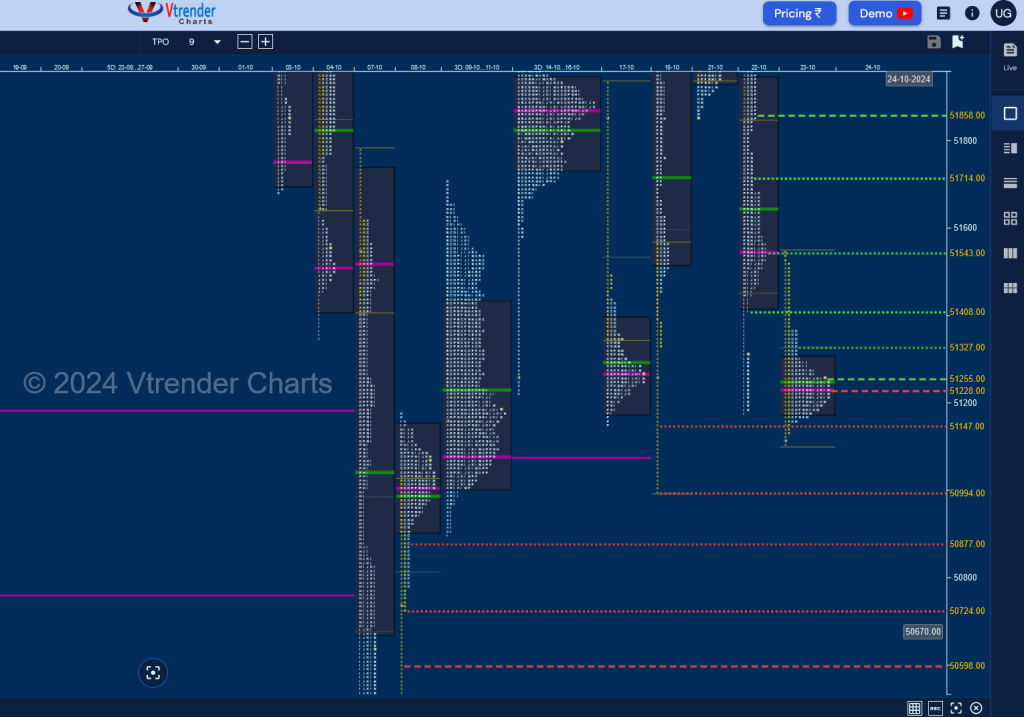
BankNifty Spot: 52094 [ 52199 / 51000 ] Neutral Extreme (Up)
Previous week’s report ended with this ‘BankNifty formed a bell curve on the weekly with completely lower value at 50945-51064-51543 and could get back into imbalance mode with the upside objectives being 52560 & 53001 whereas on the downside the probable targets would be 49733 & 49326‘
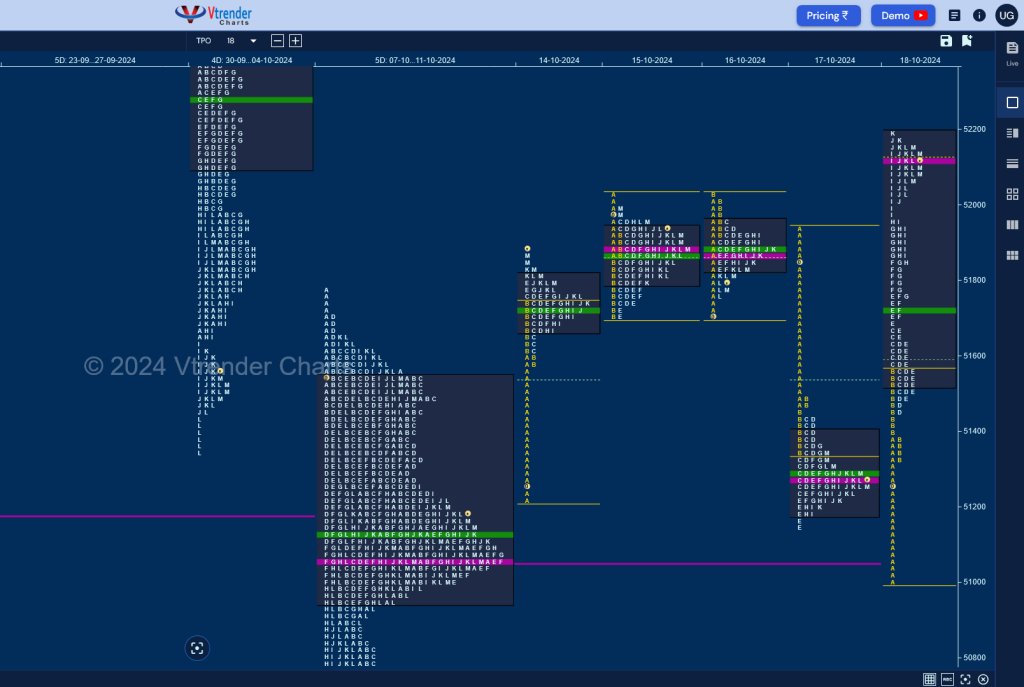
Monday – 51817 [ 5189 / 51220 ] – Normal (‘p’ shape)
Tuesday – 51906 [ 52022 / 51698 ] – Normal (Gaussian)
Wednesday – 51801 [ 52031 / 51711 ] – Normal Variation (Down)
Thursday – 51288 [ 51930 / 51150 ] – Normal Variation (Down) ‘b’
Friday – 52094 [ 52199 / 51000 ] – Trend (Up)
BankNifty made an attempt to move away from previous value with an initiative buying tail from 51587 to 51220 on Monday but ended up forming a ‘p’ shape profile after which it made a nice 2-day Gaussian Curve with similar highs of 52022 & 52031 leaving small but important selling tails indicating supply coming back which resulted in a big liquidation drop down to 51150 on Thursday where it formed a ‘b’ shape profile taking support at 11th Oct’s VPOC of 51166.
The auction continued the downside imbalance by breaking below previous week’s POC of 51064 but could not get below the value making a low of 51001 which got back the buyers interested and they responded with a 1199 point range Trend Day Up leaving a weekly FA and hitting new highs for the week at 52199 completing a Neutral Extreme Week to the upside with overlapping to higher value at 51411-51879-52008 looking set to complete the 1 ATR objective of 52321 above which it could go for higher targets of 52566, 52818 & 53001 whereas on the downside, this week’s POC of 51879 will be the important support below which BankNifty could go for a test of 51600, 51381 & 51190.
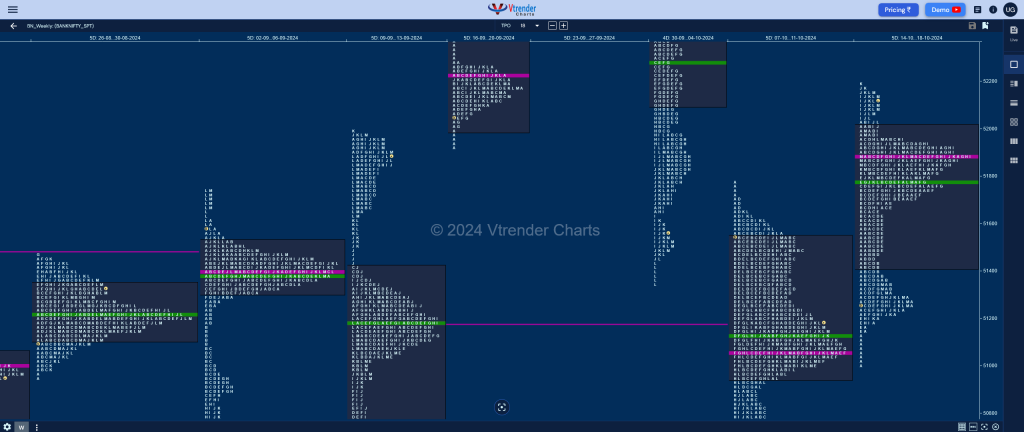
Click here to view this week’s MarketProfile of BankNifty on Vtrender Charts
Hypos for 21th Oct– 52094 [ 52199 / 51000 ] – Trend (Up)
| Up |
| 52107 – M TPO h/b (18 Oct) 52228 – F TPO h/b (04 Oct) 52321 – 1 ATR (WFA 51001) 52440 – B TPO h/b (03 Oct) 52566 – Sell Tail (03 Oct) 52691 – IB tail mid (03 Oct) |
| Down |
| 52059 – M TPO low (18 Oct) 51962 – Ext Handle (18 Oct) 51849 – SOC (18 Oct) 51698 – E TPO tail (18 Oct) 51566 – IBH (18 Oct) 51450 – B TPO h/b (18 Oct) |
Hypos for 22nd Oct– 51962 [ 52577 / 51855 ] – Normal (‘b’ shape)
| Up |
| 52000 – POC (21 Oct) 52123 – PBH (21 Oct) 52218 – 21 Oct Halfback 52319 – Sell Tail (21 Oct) 52448 – IB Tail mid (21 Oct) 52577 – Weekly IBH |
| Down |
| 51947 – IBH (21 Oct) 51849 – SOC (18 Oct) 51698 – E TPO tail (18 Oct) 51566 – IBH (18 Oct) 51450 – B TPO h/b (18 Oct) 51333 – Buy Tail (18 Oct) |
Hypos for 23rd Oct– 51257 [ 52257 / 51179 ] – Trend (Down)
| Up |
| 51311 – M TPO high (22 Oct) 51411 – Ext Handle (22 Oct) 51548 – POC (22 Oct) 51718 – 22 Oct Halfback 51859 – SOC (22 Oct) 51992 – SOC (22 Oct) |
| Down |
| 51251 – M TPO h/b (22 Oct) 51150 – Weekly tail (14-18 Oct) 51001 – Weekly FA (14-18 Oct) 50878 – SOC (08 Oct) 50732 – Buy Tail (08 Oct) 50599 – IB tail mid (08 Oct) |
Hypos for 24th Oct– 51239 [ 51551 / 51108 ] – Normal
| Up |
| 51259 – M TPO high (23 Oct) 51329 – 23 Oct Halfback 51411 – Ext Handle (22 Oct) 51548 – POC (22 Oct) 51718 – 22 Oct Halfback 51859 – SOC (22 Oct) |
| Down |
| 51236 – POC (23 Oct) 51150 – Weekly tail (14-18 Oct) 51001 – Weekly FA (14-18 Oct) 50878 – SOC (08 Oct) 50732 – Buy Tail (08 Oct) 50599 – IB tail mid (08 Oct) |
