Nifty Spot: 24530 [ 24854 / 24504 ]
Previous week’s report ended with this ‘The weekly profile is a Neutral Extreme one to the upside with a small responsive buying tail at lows from 24173 to 24141 and has formed overlapping to higher Value at 24242-24296-24415 which is a nice balance and has given a move away from this zone on the last day with an extension handle at 24461 which will be the level to hold if Nifty has to continue higher towards 24751 in the coming week‘

Monday – 24586 [ 24635 / 24522 ] – Normal Variation (Up)
Tuesday – 24613 [ 24661 / 24587 ] – Neutral Centre
Wednesday – Holiday
Thursday – 24800 [ 24837 / 24504 ] – Neutral Extreme (Up)
Friday – 24530 [ 24854 / 24508 ] – Trend (Down)
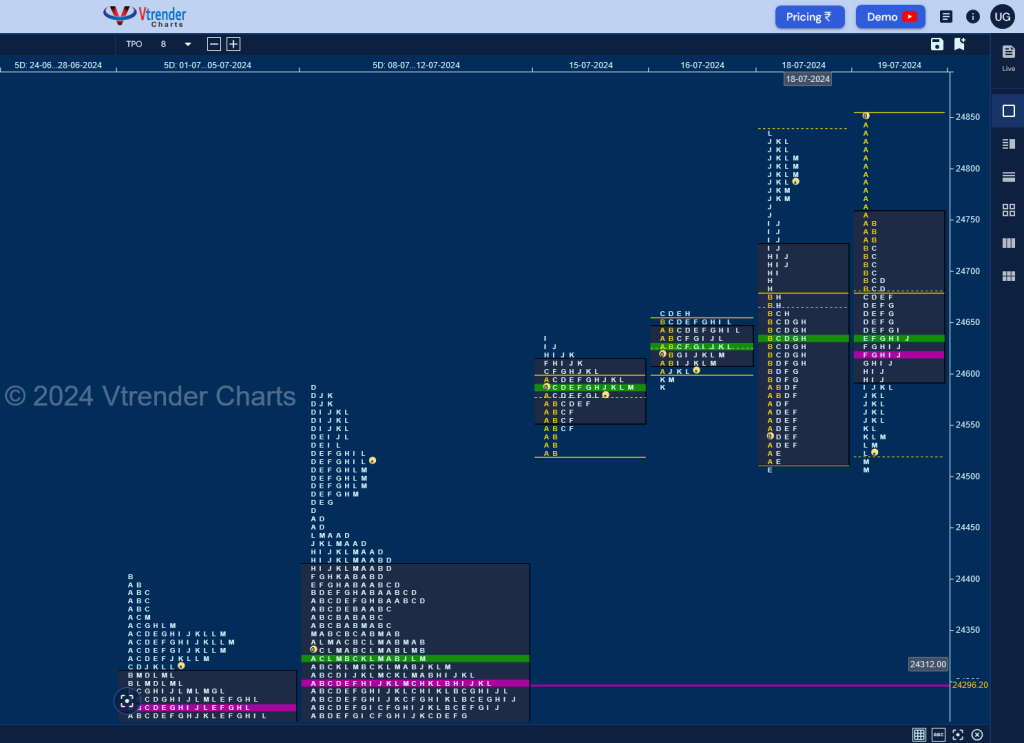
Nifty opened the week with a narrow range balanced profile taking support above last Friday’s POC of 24500 as it left similar lows of 24527 & 24522 and went on to record new ATH of 24635 before closing around the prominent POC of 24585 on Monday and continued the upside with higher highs of 24650 in the Initial Balance (IB) on Tuesday but made a typical C side extension to 24661 indicating weak hands which resulted in a probe lower down to 24587 in the K period taking support just above 24585 from where it gave a bounce back to 24648 in the L before closing around the POC of 24628 forming a narrow 74 point range Neutral Centre Day.
The auction opened lower on Thursday after the holiday breaking below 24584 and even went on to look down below the lows of Monday as it hit 24515 in the A TPO still holding that VPOC of 24500 which meant that demand was holding this zone triggering a quick short covering move in the B which started with an extension handle at 24585 and ended with new highs for the week at 24678 but the failure to extend further on the upside led to a probe lower in the D & E periods putting in place marginal new lows for the week at 24504 but this attempt was swiftly rejected as the buyers came back with a vengeance carving a 333 point move higher for the day confirming a FA (Failed Auction) at lows and almost completing the 2 ATR objective of 24858 while making a high of 24837 leaving a Neutral Extreme (NeuX) Day Up.
The NeuX profile is not known to give follow up & Friday was no different as the higher open at 24854 also resulted in an OH (Open=High) and an ORR (Open Rejection Reverse) start fabricating an OTF (One Time Frame) probe lower for the rest of the day and almost re-visiting the FA point while making a low of 24508 establishing an elongated Trend Day Down of 347 points with a close around the lows.
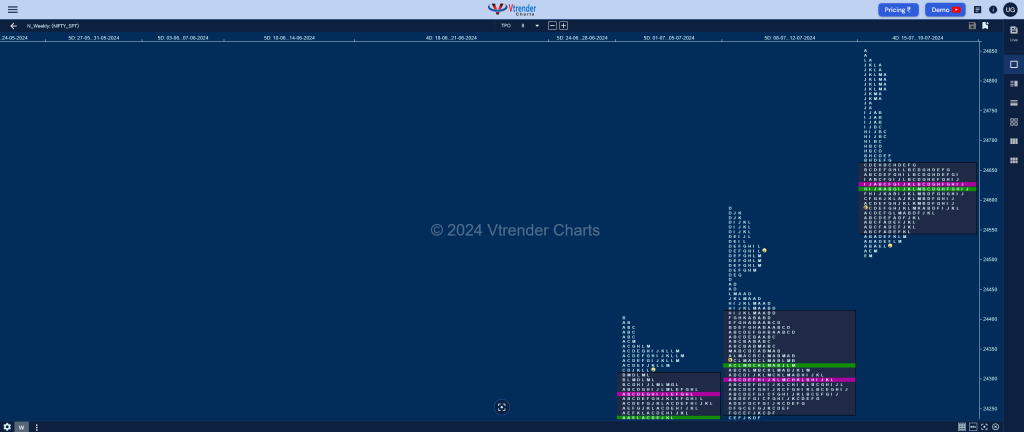
The weekly profile is a Neutral one with completely higher Value at 24546-24625-24662 which completed the 3 IB objective on the upside but has seen rejection in form of an initiative selling tail at new ATH of 24854 and has closed below the weekly VAL so the immediate support will be the FA of 24504 & 12th Jul’s VPOC of 24500 below which we have the extension handle of 24461 and a break of which can script a drop down to the weekly VPOC of 24296 and the 11th Jul one of 24261 in the coming week where as on the upside, the trend day extension handles of 24590 & 24678 along 24727 will be the hurdles for the bulls to cross for a test of 24801 which is the mid-point of the initiative selling tail of that day.

Click here to view this week’s MarketProfile of Nifty on Vtrender Charts
Hypos for 22nd July – 24530 [ 24854 / 24508 ] – Trend (Down)
| Up |
| 24546 – Weekly VAL 24590 – Ext Handle (19 Jul) 24625 – Weekly POC 24678 – Ext Handle (19 Jul) 24749 – Sell Tail (19 Jul) 24801 – IB tail mid (19 Jul) |
| Down |
| 24504 – FA (18 Jul) 24461 – Ext Handle (12 Jul) 24415 – Weekly VAH (08-12 Jul) 24354 – 7-day VAH (03-11 Jul) 24296 – Weekly VPOC (08-12 Jul) 24244 – 7-day VAL (03-11 Jul) |
Hypos for 23rd July – 24509 [ 24595 / 24362 ] – Normal (p shape)
| Up |
| 24516 – POC (22 Jul) 24562 – D TPO h/b (22 Jul) 24622 – VPOC (19 Jul) 24678 – Ext Handle (19 Jul) 24727 – Ext Handle (19 Jul) 24774 – SOC (19 Jul) |
| Down |
| 24504 – M TPO low (22 Jul) 24465 – Buy Tail (22 Jul) 24413 – IB Tail mid (22 Jul) 24354 – 7-day VAH (03-11 Jul) 24296 – Weekly VPOC (08-12 Jul) 24244 – 7-day VAL (03-11 Jul) |
Hypos for 24th July – 24479 [ 24582 / 24074 ] – Neutral
| Up |
| 24479 – M TPO high (23 Jul) 24545 – PBH (23 Jul) 24622 – VPOC (19 Jul) 24678 – Ext Handle (19 Jul) 24727 – Ext Handle (19 Jul) 24774 – SOC (19 Jul) |
| Down |
| 24460 – POC (23 Jul) 24416 – J TPO h/b (23 Jul) 24362 – SOC (23 Jul) 24328 – 23 Jul H/B 24275 – Buy tail (23 Jul) 24175 – Buy tail mid (23 Jul) |
Hypos for 25th July – 24413 [ 24504 / 24307 ] – Normal Variation (Down)
| Up |
| 24440 – POC (24 Jul) 24492 – Sell Tail (24 Jul) 24545 – PBH (23 Jul) 24595 – Weekly IBH 24646 – PBH (19 Jul) 24678 – Ext Handle (19 Jul) |
| Down |
| 24405 – 24 Jul Halfback 24362 – Weekly IBL 24310 – Buy tail (24 Jul) 24275 – Buy tail (23 Jul) 24175 – Buy tail mid (23 Jul) 24137 – 3-day VPOC (28Jun-02Jul) |
BankNifty Spot: 52265 [ 52782 / 52146 ]
Previous week’s report ended with this ‘The weekly profile is a Neutral One with overlapping to lower Value at 52192-52550-52607 and will remain weak if stays below 52192 in the coming week for a test of the lower VPOCs of 51923 & 51635 along with the Swing one of 51136 whereas on the upside, staying above 52350 the upside VPOCs of 52554 & 52961 could come into play which if taken out can trigger a fresh imbalance towards new ATH‘

Monday – 52456 [ 52662 / 52154 ] Neutral Extreme (Up)
Tuesday – 52396 [ 52619 / 52331 ] – Normal (Double Inside)
Wednesday – Holiday
Thursday – 52620 [ 52782 / 52168 ] – Normal (Outside Day)
Friday – 52265 [ 52586 / 52146 ] – Normal Variation (Down)
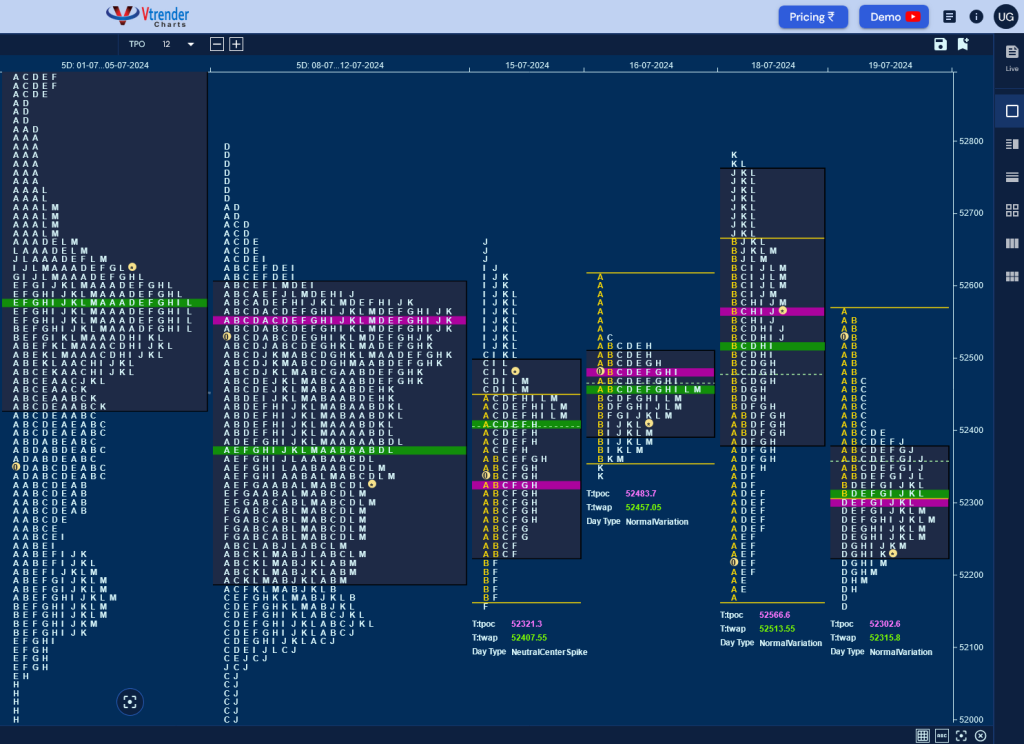
BankNifty made an OAIR start and remained inside previous week’s Value for most part of the day on Monday where the couple of attempts it made to break below the weekly VAL was met with rejection and a probe higher resulting in a FA at 52154 & a tag of the VPOC of 52554 while making a high of 52662 but could not sustain above the weekly VAH leaving a Neutral Extreme profile with a small responsive selling tail which was followed by an initiative one on Tuesday as it formed a narrow range inside bar and a ‘b’ shape profile taking support just above previous POC of 52321.
The auction then opened with a gap down on Thursday making a low of 52168 in the A TPO as it saw the FA of 52154 being defended indicating that the demand was coming back and went on get back into the weekly Value completing the 80% Rule in the IB itself as it formed a relatively big range of 500 point & hitting marginal new highs for the week at 52668 after which it remained largely inside for the most part of the day except for an attempt it made to extend higher in the J & K TPOs but could not clear previous week’s high of 52784 and closed back in the weekly value once again and completed the 80% Rule to the downside with a probe lower on Friday where it revisited the FA of 52154 and made new lows for the week at 52146 but once again took support in this zone leaving a ‘b’ shape profile with the POC at 52302
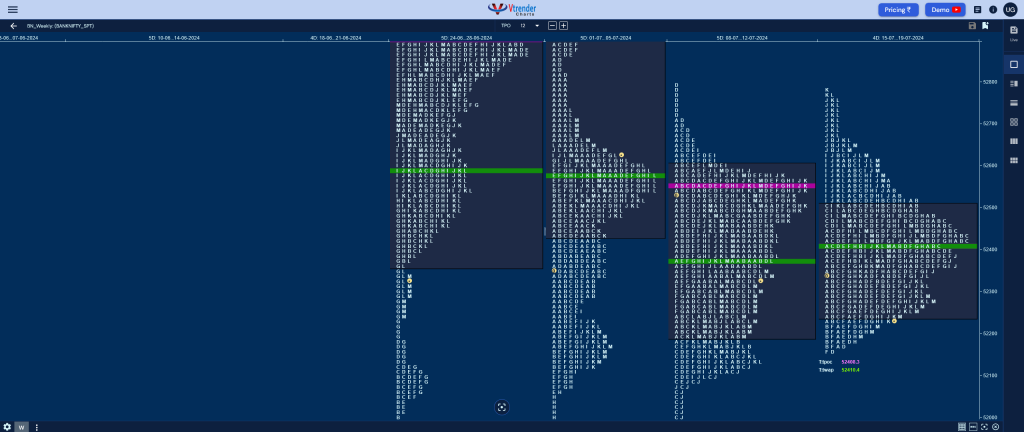
The weekly profile is a Neutral Centre one with both range & value being completely inside (52241-52408-52506) the prior week as BankNifty continued the balance it has been forming on the higher timeframe with a clear rejection at top in previous week’s selling tail so the extreme of 52794 will be the new swing reference on the upside above which we can expect a probe higher to daily & weekly VPOCs of 52961 & 53100 respectively along with the ATH of 53357 whereas on the downside, staying below this week’s VAL of 52241 we can for a test of the lower VPOCs of 51923 & 51635 along with the Swing one of 51136 in the coming week.

Click here to view this week’s MarketProfile of BankNifty on Vtrender Charts
Hypos for 22nd July – 52265 [ 52586 / 52146 ] – Normal Variation (Down)
| Up |
| 52302 – POC (19 Jul) 52408 – Weekly POC 52566 – POC (18 Jul) 52686 – L TPO h/b (18 Jul) 52832 – Gap mid (05 Jul) 52961 – VPOC (04 Jul) |
| Down |
| 52241 – Weekly VAL 52072 – 11 Jul Halfback 51923 – VPOC (11 Jul) 51768 – Buy tail (11 Jul) 51635 – VPOC (24 Jun) 51485 – Ext Handle (24 Jun) |
Hypos for 23rd July – 52280 [ 52427 / 51874 ] Normal (‘p’ shape)
| Up |
| 52292 – POC (22 Jul) 52427 – Weekly IBH 52566 – POC (18 Jul) 52686 – L TPO h/b (18 Jul) 52832 – Gap mid (05 Jul) 52961 – VPOC (04 Jul) |
| Down |
| 52262 – M TPO low (22 Jul) 52153 – 22 Jul Halfback 52019 – IB tail mid (22 Jul) 51874 – Weekly IBL 51768 – Buy tail (11 Jul) 51635 – VPOC (24 Jun) |
Hypos for 24th July – 51778 [ 52547 / 51342 ] – Trend (Down)
| Up |
| 51778 – M TPO high (23 Jul) 51902 – 23 Jul Halfback 52086 – PBH (23 Jul) 52199 – 12-day VAL (05-23 Jul) 52284 – 12-day POC (05-23 Jul) 52427 – Sell Tail (23 Jul) |
| Down |
| 51749 – Buy tail (Jul) 51661 – PBL (23 Jul) 51533 – I TPO h/b (23 Jul) 51363 – Buy tail (23 Ju1) 51259 – B TPO h/b (24 Jun) 51136 – VPOC (19 Jun) |
Hypos for 25th July -51317 [ 51944 / 50784 ] – Normal Variation (Down)
| Up |
| 51361 – 24 Jul Halfback 51477 – IBL (24 Jul) 51597 – C TPO h/b (24 Jul) 51743 – B TPO h/b (24 Jul) 51874 – Weekly IBL 51996 – Monthly IBL |
| Down |
| 51260 – M TPO low (24 Jul) 51164 – K TPO h/b (24 Jul) 50993 – H TPO h/b (24 Jul) 50865 – Buy tail (24 Jul) 50709 – A TPO h/b (19 Jun) 50594 – Buy Tail (19 Jun) |
