Nifty Spot: 19542 [ 19849 / 19512]
Previous week’s report ended with this ‘The weekly profile is a Trend One Up which took support in last week’s buying zone and almost completed the 3 IB objective of 19806 but at the same time saw the POC shift higher to 19809 indicating profit booking by the buyers leaving an irregular kind of a structure with some filling required in the zone between 19809 to 19680 which will be the reference for the coming week and a break of which could get a probe towards the daily VPOCs of 19623, 19523 & 19420 whereas on the upside, the magnet of 19809 will need to be taken out by initiative players for a probe towards the weekly extension handle of 19885 above which we have the daily VPOC of 19953 & the initiative selling tail from 20017 as probable objectives‘

Monday
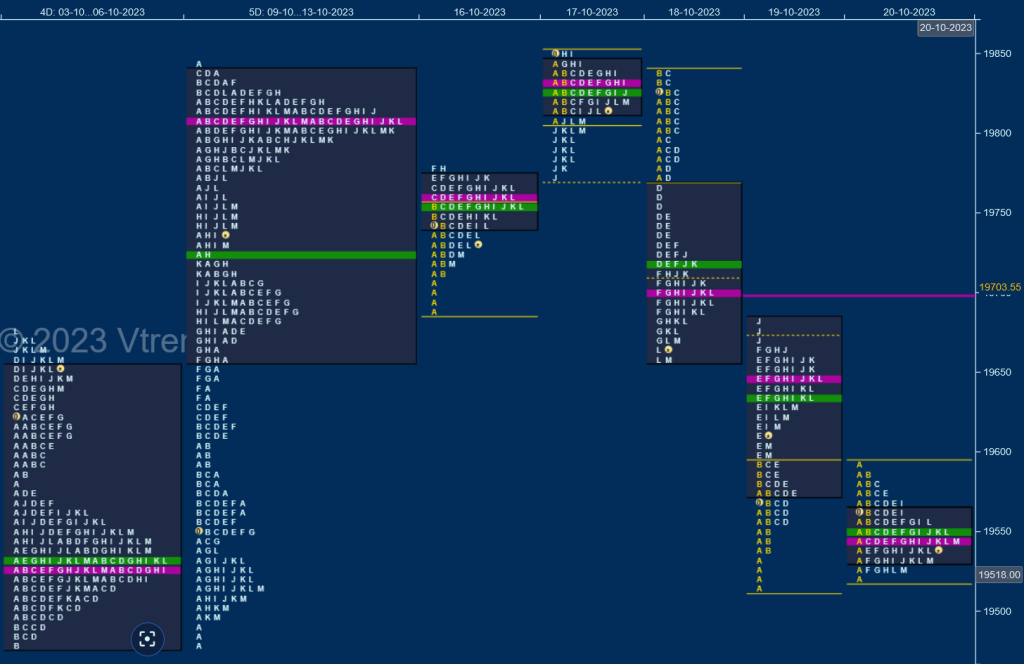
Nifty made an OAIR start continuing last Friday’s imbalance close to the downside as it made a low of 19691 taking suppport just above the lower HVN of 19680 as mentioned in the brief above and reversed the probed to the upside making marginal REs (Range Extension) as it left similar highs at 19781 forming a ‘p’ shape Normal Day with a prominent POC at 19758
Tuesday
made a gap up open of 111 points recording new highs for October at 19849 but the auction then settled down into an OAOR forming an ultra narrow range of just 40 points in the A period and remained in the same for most part of the day as it made attempts to extend higher in the H & I TPOs but could only manage same highs at 19848 triggering a liquidation drop down to 19775 in the J period as it took support just above Monday’s POC of 19758 giving a bounce back to 19823 into the close
Wednesday
saw another OAIR start with a test of Tuesday’s low which was defended in the A period along with a probe higher to 19841 in the B after which the C side made a similar high of 19837 stalling right at previous week’s VAH and this lack of fresh demand empowered the sellers to enter which they did by leaving an extension handle at 19774 in the D TPO and dropping lower to 19660 into the close leaving a Double Distribution Trend Day Down with the dPOC shifting in the lower half at 19703
Thursday
continued the imbalance to the downside with a 125 point gap down and a test of the daily VPOC of 19523 from 09th Oct while making a low of 19512 which was also the 3 IB objective for this week as the initiative sellers began to book profits but the laggard ones got stuck resulting in a short covering squeeze in the E period where it closed the opening gap but the attempt to get back into previous week’s Value was rejected right at 19681 indicating change of polarity at this important weekly reference as Nifty went on to drop lower to 19601 into the close still leaving a DD on the upside as extension handle of 19597 was defended
Friday
The upper distribution from Thursday got rejected as Nifty opened lower at 19542 and stalled on the upside at 19594 displaying change of polarity around the extension handle of 19597 after which it remained in the narrow A period range of 75 points all day forming a nice Gaussian Curve and an inside bar but Value was completely lower with a close at the prominent POC of 19542

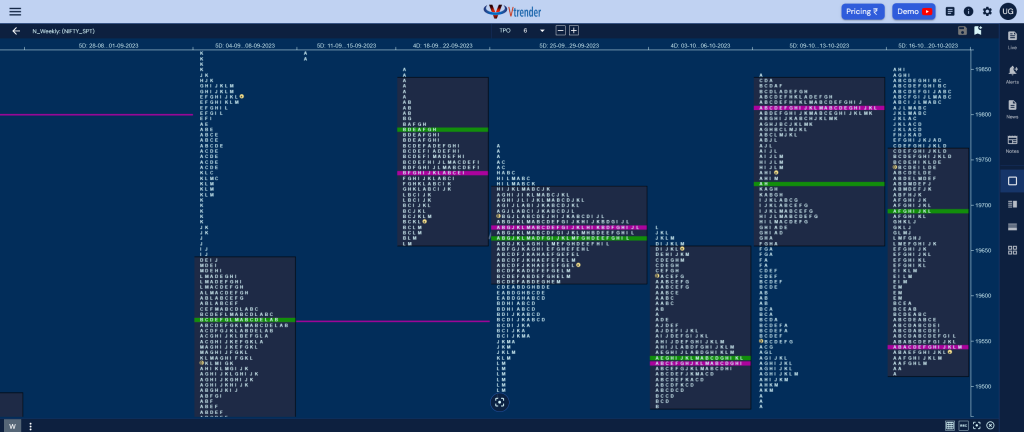
The weekly profile is a Neutral Extreme one to the downside which made a look up above previous week’s high and got rejected and seems to have filled up the low volume zone from previous profile forming overlapping to lower Value at 19515-19542-19758 with the POC shifting down to 19542 and will be the opening reference for the next week staying above which, the 2 daily VPOCs at 19645 & 19703 along with the HVN at 19831 would be the probable objectives on the upside whereas on the downside, this month’s buying tail from 19479 will be the immediate support break of which could trigger a probe lower towards 04th Oct’s references of 19420 (VPOC), 19369 (Scene Of Crime) & 19333 (Swing Low) and a break of which could bring in a test of the 01st Sep’s initiative buying tail from 19288.
Click here to view this week’s MarketProfile of Nifty on Vtrender Charts
Hypos for the week 23rd to 27th Oct 2023
| Up |
| 19542 – Weekly POC 19594 – Ext Handle (19 Oct) 19645 – VPOC from 19 Oct 19703 – VPOC from 18 Oct 19751 – DD singles (18 Oct) 19802 – SOC from 18 Oct 19848 – Selling Tail (17 Oct) 19888 – Weekly ATR (POC of 19542) |
| Down |
| 19531 – VAL from 20 Oct 19479 – Weekly Ext (02-06 Oct) 19420 – VPOC from 04 Oct 19369 – SOC from 04 Oct 19333 – Monthly IBL 19288 – Buying Tail (01 Sep) 19223 – Weekly FA (31 Aug) 19194 – Ext Handle (30 Jun) |
BankNifty Spot: 43723 [ 44590 / 43558 ]
Previous week’s report ended with this ‘The weekly profile is a Double Distribution Trend Up one with overlapping to higher Value at 44090-44597-44702 and a small zone of singles from 44203 to 44139 which will be the support zone to watch for in the coming week below which it could go for a test of the daily VPOCs of 44097 & 43890 whereas on the upside, Friday’s SOC (Scene Of Crime) at 44413 along with Thursday’s prominent VPOC of 44597 will be the levels to look out for’

Monday
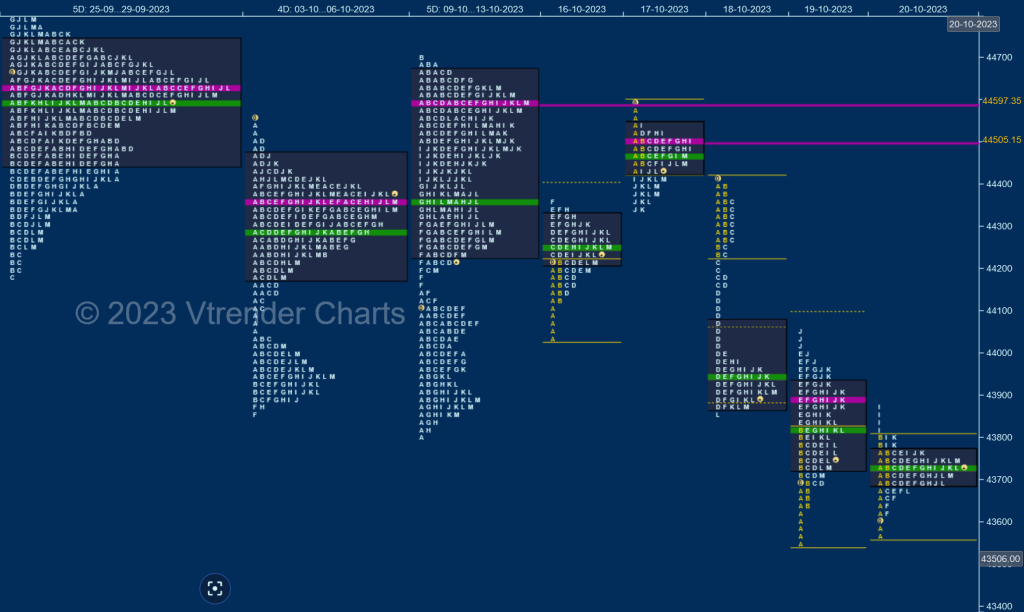
BankNifty opened with a test of previous week’s DD singles along with the lower VPOC of 44097 while making a low of 44044 in the A period where it found some demand coming back as it left a buying tail till 44126 and made small REs to the upside making a high of 44357 resulting in a narrow 313 point range ‘p’ shape profile with a prominent POC at 44260
Tuesday
The auction opened with a big gap up of 364 points but made an OH (Open=High) start at 44590 failing to get any fresh demand near the previous week’s POC of 44597 and ended up forming another very narrow 253 point range day as it made a low of 44337 taking support just above Monday’s Value but leaving a long liquidation ‘b’ shape profile for the day with a prominent POC at 44505 and a close below Value which meant that the PLR (Path of Least Resistance) was to the downside
Wednesday
started with an OAOR (Open Auction Out of Range) as it formed a mere 176 point range IB (Initial Balance) below previous Value and confirmed sellers taking control as they left couple of extension handles at 44236 & 44165 paving way for a Double Distribution Trend Day Down with a zone of singles till 43999 as it tagged the lower VPOC and important objective of 43890 while hitting new lows for the week at 43861
Thursday
saw the continuation of the imbalance as it opened lower by 272 points negating the 09th Oct Swing Low of 43796 and August’s responsive buying tail from 43672 to 43600 as it made a low of 43558 in the A period taking support just above the weekly FA of 43541 from 26th Jun and left an initiative buying tail till 43647 marking the end of the downmove and went on to make couple of big REs in the E & J TPOs testing the DD singles of previous session but got rejected leaving a 3-1-3 profile for the day with a responsive selling tail from 43992 to 44058
Friday
opened with a gap down once again but took support just above PDL as it tagged 43567 and formed yet another 3-1-3 profile on the daily which was an inside bar in terms of range as it got rejected at the 2 weekly HVNs of 436164 on the downside and 43863 on the upside with a close around the ultra prominent POC of 43731

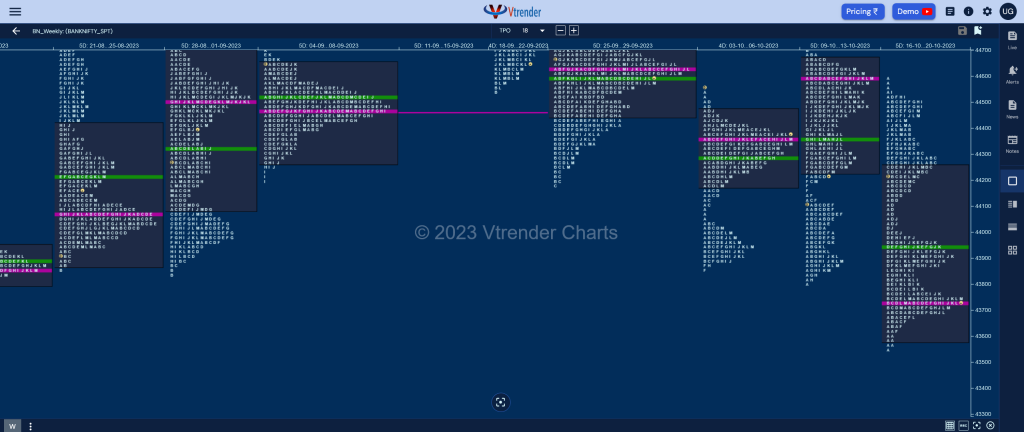
The weekly profile is a Neutral Extrene one to the downside with mostly lower Value at 43590-43733-44260 and wil remain weak for the coming session(s) as long as it remains below 43733 with 43616 & 43541 being the immediate objectives below which BankNifty could go for a test of the monthly extension handle of 43390 & the weekly VPOC of 43250 and a break of which could trigger a fresh imbalance towards the 02nd Jun’s FA of 42812 whereas on the upside, sustaining above 43733 can bring in a bounce first to 19th Oct’s VPOC of 43895 above which we have the twin extension handles of 44165 & 44236 as the probable targets along with 17th Oct’s VPOC of 44505 and the weekly VPOC of 44597
Click here to view this week’s MarketProfile of BankNifty on Vtrender Charts
Hypos for the week 23rd to 27th Oct 2023
| Up |
| 43761 – VAH from 20 Oct 43895 – VPOC from 19 Oct 44058 – DD singles (18 Oct) 44236 – Ext Handle (18 Oct) 44389 – Selling Tail (18 Oct) 44505 – VPOC from 17 Oct 44597 – Weekly VPOC 44710 – Swing High (11 Oct) |
| Down |
| 43697 – VAL from 20 Oct 43541 – Weekly FA (26 Jun) 43390 – Monthly Ext Handle (May) 43250 – Weekly VPOC (08-12 May) 43077 – PBL from 10 May 42911 – Buying Tail (10 May) 42822 – Swing Low (10 May) 42734 – VPOC from 26 Apr |
