Nifty Spot: 25791 [ 25849 / 25283 ] Neutral Extreme (Up)
Previous week’s report ended with this ‘The weekly profile is a Double Distribution (DD) Trend one to the upside and an double outside bar in terms of range with an initiative buying tail from 24809 to 24753 with the POC at 24888 above which it formed a 3-day balance with Value at 24962-25000-25101 with a FA at 24941 followed by the DD zone from 25130 to 25256 and a small balance at the top with a close around the upper HVN of 25363 which will be the opening reference for the coming week for a probe towards the higher objectives of 25490 & 25905‘
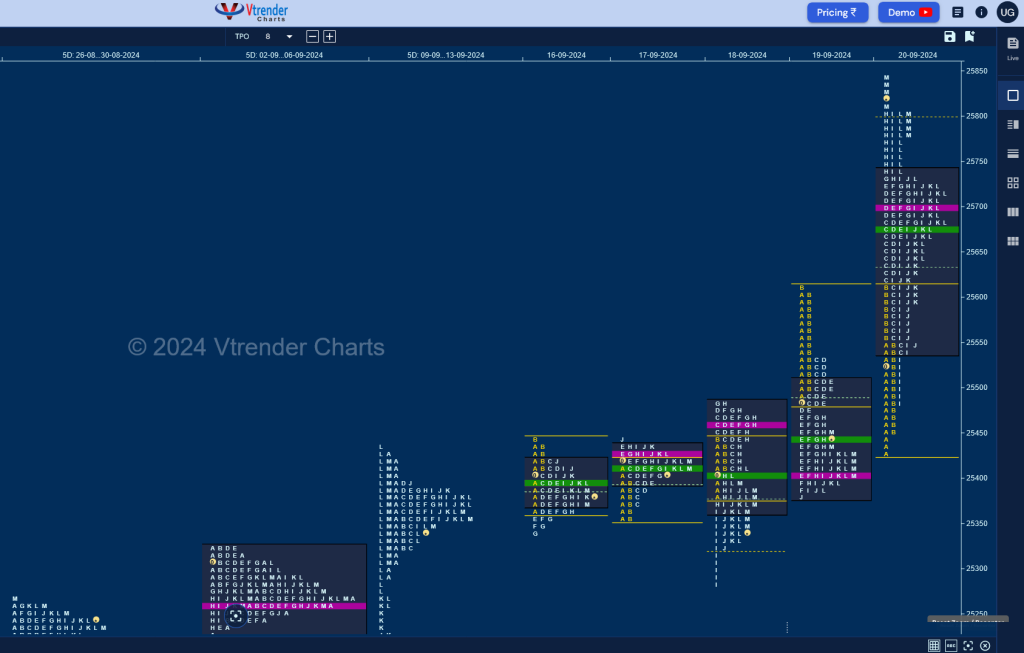
Monday – 25383 [ 25445 / 25336 ] – Normal Variation (Down)
Tuesday – 25418 [ 25441 / 25352 ] – Normal Variation (Up)
Wednesday – 25377 [ 25482 / 25285 ] – Neutral
Thursday – 25415 [ 25612 / 25376 ] Normal Variation (Down)
Friday – 25791 [ 25849 / 25426 ] – Normal Variation (Up)
Nifty opened the week with back to back narrow range balanced profiles on Monday & Tuesday forming Value above previous week’s closing HVN of 25363 and building a prominent POC at 25415 which was followed by a Neutral Day on Wednesday as both the buyers & sellers made at attempt to move away from 25415 assembling an Outside Bar both in terms of range as well as value closing around the composite VAL of 25364 slightly in the favour of the sellers but had also left an important responsive buying tail from 25321 to 25283 which they needed to negate for more downside.
The auction however opened with an unexpected gap up of 110 points on Thursday completing the first upside objective of 25490 and in the process confirmed a weekly FA at 25283 and a big short covering move in the IB to 25612 after which it could not extend any further triggering a probe back into the 3-day composite and a tag of the magnet of 25415 as it almost completed the 80% Rule with a close right at 25415 establishing a 4-day balance now with value at 25352-25415-25444 and saw the buyers wrest back the control with an Open Drive Up on Friday as it almost matched the ATH of 25612 in the IB and proceeded to make multiple REs to the upside till the H period where it hit 25805. Signs of the inventory getting too long came in form of marginal new highs being made in the I TPO which triggered a sharp liquidation drop lower to 25487 but the defence of the objective of 25490 meant that Nifty was on for the higher objective of the week which was at 25905 and went on to not only recover the entire fall but record new ATH of 25849 into the close almost completing the 1 ATR objective of 25870 from the weekly FA.
The weekly profile is a Neutral Extreme One to the upside with completely higher Value at 25335-25415-25584 and looks good to end the month of September on a bullish note as long as it stays above the daily extension handle of 25612 in the coming week with Friday’s POC of 25702 being the immediate support. The spike zone from 25806 to 25849 will be the opening upside reference for the coming week with the pending objective of 25905 staying the first objective whereas the swing one now revised to 26454.
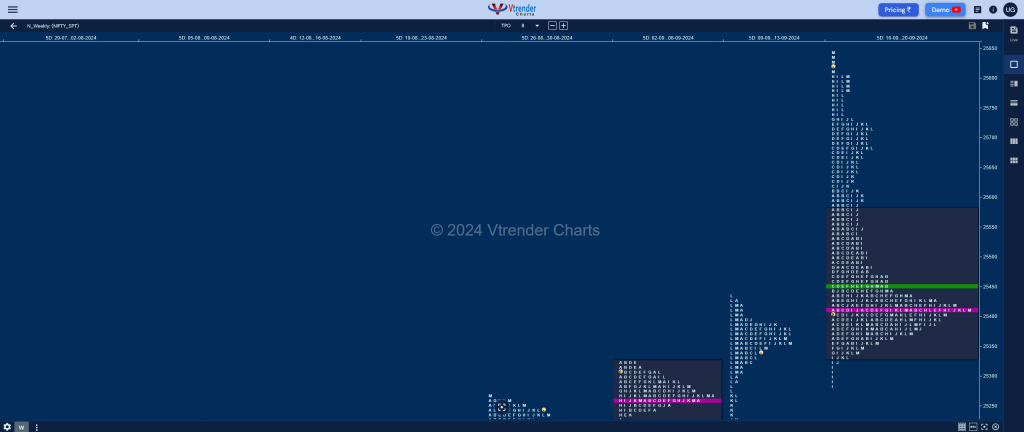
Click here to view this week’s MarketProfile of Nifty on Vtrender Charts
Hypos for 23rd Sep – 25791 [ 25849 / 25426 ] – Normal Variation (Up)
| Up |
| 25807 – Sell tail (20 Sep) 25849 – PDH 25905 – 1 ATR (MFA 24753) 25960 – 2 ATR (yVAL 25536) 26019 – 1 ATR (25807) 26097 – 1 ATR (M_EH 25612) |
| Down |
| 25783 – M TPO low (20 Sep) 25724 – L TPO h/b 25655 – 2 ATR (SOC 25277) 25612 – Daily Ext Handle 25555 – SOC (19 Sep) 25487 – A TPO h/b (20 Sep) |
Hypos for 24th Sep – 25939 [ 25956 / 25847 ] – Neutral Extreme (Up)
| Up |
| 25935 – M TPO h/b (23 Sep) 25965 – Weekly 1.5 IB 26004 – Weekly 2 IB 26059 – 1 ATR (FA 25847) 26097 – 1 ATR (M_EH 25612) 26148 – 1 ATR (25935) |
| Down |
| 25925 – IBH (23-Sep) 25883 – POC (23-Sep) 25847 – FA (23 Sep) 25807 – Tail (20 Sep) 25769 – Weekly 2 IB 25724 – L TPO h/b |
Hypos for 25th Sep – 25940 [ 26011 / 25886 ] – 3-1-3 profile
| Up |
| 25949 – 24 Sep Halfback 25980 – VAH (24 Sep) 26011 – PDH 26059 – 1 ATR (FA 25847) 26097 – 1 ATR (M_EH 25612) 26149 – 1 ATR (25934) |
| Down |
| 25934 – VAL (24 Sep) 25883 – VPOC (23 Sep) 25847 – FA (23 Sep) 25807 – Tail (20 Sep) 25769 – Weekly 2 IB 25724 – L TPO h/b |
Hypos for 26th Sep – 26004 [ 26032 / 25871 ] – Neutral Extreme (Up)
| Up |
| 26011 – Sep Sell tail 26059 – 1 ATR (FA 25847) 26097 – 1 ATR (M_EH 25612) 26150 – 1 ATR (25933) 26193 – 1 ATR (25976) 26237 – 1 ATR (26020) |
| Down |
| 25993 – SOC (25 Sep) 25954 – 3-day VAH (23-25 Sep) 25902 – SOC (25 Sep) 25847 – FA (23 Sep) 25807 – Tail (20 Sep) 25769 – Weekly 2 IB |
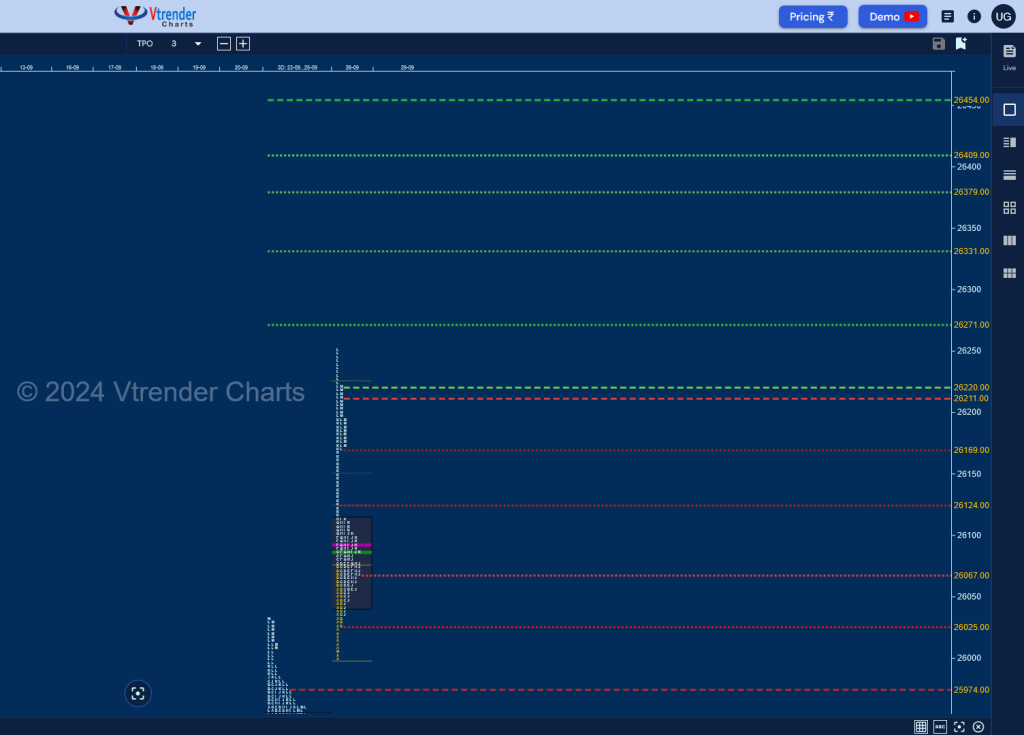
Hypos for 27th Sep – 26216 [ 26251 / 25998 ] Trend (Up)
| Up |
| 26220 – Sell tail (26 Sep) 26272 – 2 ATR (FA 25847) 26332 – Weekly ATR 26381 – 2 ATR (25933) 26411 – PWR target 26454 – 2 ATR (WFA 25285) |
| Down |
| 26211 – L TPO h/b 26171 – K TPO tail 26124 – 26 Sep Halfback 26068 – J TPO h/b (26 Sep) 26027 – Buy Tail (26 Sep) 25975 – L TPO h/b (25 Sep) |
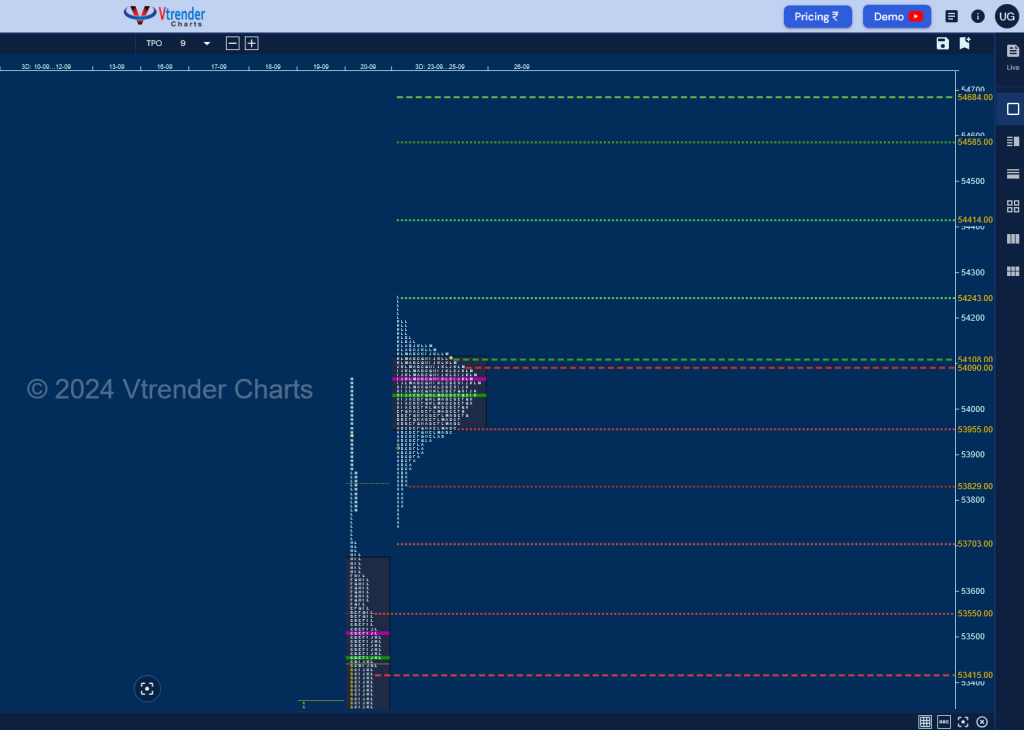
BankNifty Spot: 53793 [ 54066 / 51921 ] Trend (Up)
Previous week’s report ended with this ‘The weekly profile is a Triple Distribution Trend Up one for the week which started with a test of previous month’s POC of 50415 where it left a good initiative buying tail from 50535 to 50369 along with the POC at 50765 which was followed by a nice 3-day balance with Value at 51091-51186-51313 and couple of FAs at 51420 & 51025 along with an extension handle at the former including singles till 51553 above which it formed the upper most distribution with an A period buying tail from 51672 to 51644 which along with Friday’s halfback of 51819 will be the immediate demand side references for the coming week whereas on the upside, BankNifty will need to stay above 51930 for a probe towards July’s VPOC of 52333 & the weekly one at 53100 in the coming week‘
Monday – 52153 [ 52208 / 51921 ] Normal (‘p’ shape)
Tuesday – 52188 [ 52284 / 52085 ] – Normal
Wednesday – 52750 [ 52954 / 52154 ] – Double Distribution (Up)
Thursday – 53037 [ 53353 / 52847 ] – Normal
Friday – 53793 [ 54066 / 53037 ] – Normal Variation (Up)
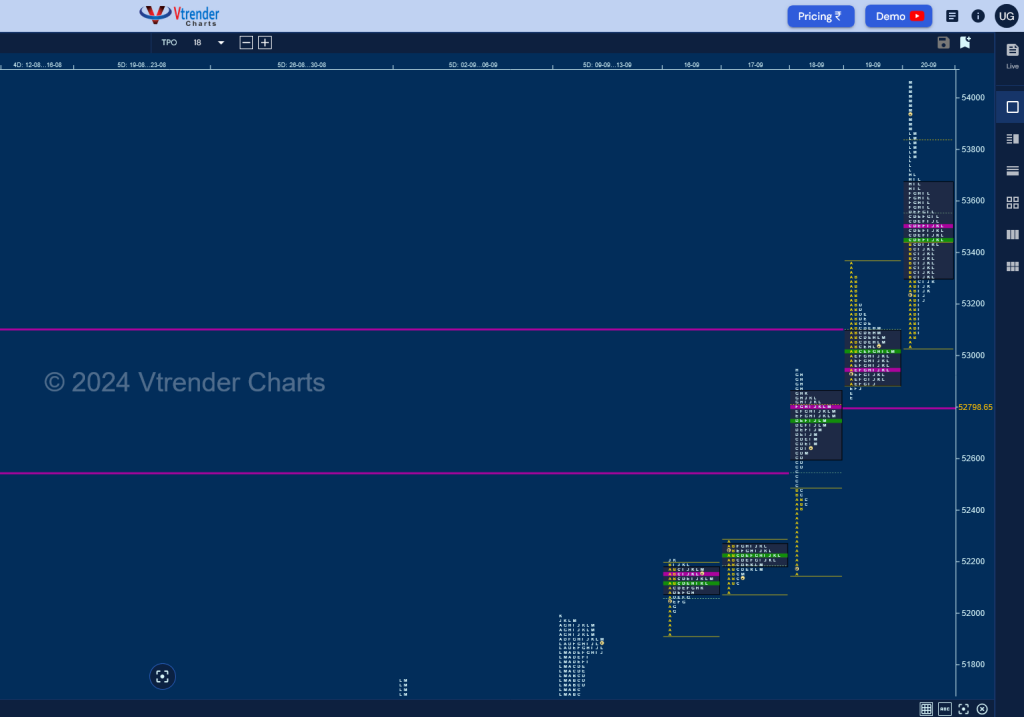
BankNifty made its intent clear by leaving an initiative buying tail from 52007 to 51921 on Monday that the PLR (Path of Least Resistance) remained to the upside and though it made a narrow range ‘p’ shape profile which was followed by a even smaller Gaussian Curve in a range of just 199 points on Tuesday where it formed a very prominent 2-day POC at 52221, the base was built for the buyers and they capitalised on the same with an Open Drive Up on Wednesday where it not only left another initiative buying tail from 52403 to 52154 but confirmed an extension handle 52484 as it scaled above the 2-week VPOC of 52545 (08-19 Jul) with a zone of singles and went on to make a high of 52954 stalling just below 04th Jul’s VPOC of 52961.
The auction continued the imbalance with a higher open on Thursday along with a Drive Up as it went on to almost negate 04th Jul’s selling tail while making a high of 53353 stalling just below the ATH of 53357 which resulted in some profit booking by the longs as it established a ‘b’ shape kind of a profile forming a prominent POC at 52944 while taking support right at previous Value and re-established control of buyers as it left yet another A period tail from 53067 to 53037 and made an One Time Frame (OTF) probe higher till the H TPO hitting new ATH of 53712 but the stop of the OTF in the I period triggered a quick drop down to 53095 which was right at yVAH as the weak hands were taken out and stronger ones came to snatch back the initiative leaving an extension handle at 53712 and closing with a spike higher to 54066 into the close.
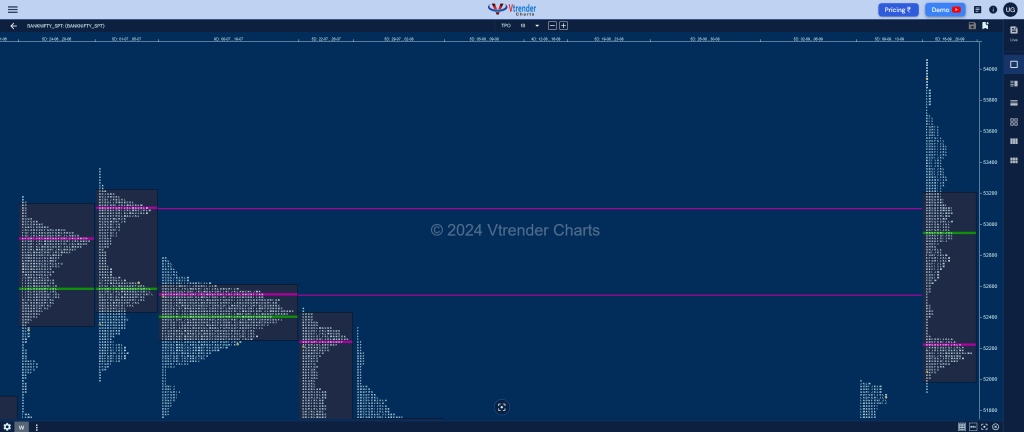
The weekly profile is a Trend One to the upside with an initiative buying tail from 52007 to 51922 and had left buying extension handles at 52284 & 52486 enabling it to probe higher on all days as a result has formed completely higher Value at 51996-52221-53192 with a spike into the close from 53712 to 54066 which will be the zone to watch for the coming week.
Click here to view this week’s MarketProfile of BankNifty on Vtrender Charts
Hypos for 23rd Sep – 53793 [ 54066 / 53037 ] – Normal Variation (Up)
| Up |
| 53793 – Prev Close 53864 – Sell tail (20 Sep) 54037 – 1 ATR (yPOC 53507) 54126 – 2 ATR (53066) 54285 – 2ATR (53225) 54417 – Monthly ATR |
| Down |
| 53778 – M TPO low (20 Sep) 53676 – SOC (20 Sep) 53551 – 20 Sep Halfback 53372 – K TPO h/b (20 Sep) 53225 – J TPO low (20 Sep) 53066 – Buy Tail (20 Sep) |
Hypos for 24th Sep – 54105 [ 54198 / 53741 ] – Double Distribution (Up)
| Up |
| 54133 – K TPO h/b (23 Sep) 54267 – W_1.5IB 54417 – Monthly ATR 54592 – 1 ATR (RO 51415) 54674 – 1 ATR (54133) 54794 – W_3IB |
| Down |
| 54092 – Weekly IBH 53959 – POC (23 Sep) 53832 – Buy Tail (23 Sep) 53712 – Spike low (20 Sep) 53551 – 20 Sep Halfback 53418 – 1 ATR (yPOC 53959) |
Hypos for 25th Sep – 53968 [ 54247 / 53904 ] – Neutral
| Up |
| 53963 – IBH (24 Sep) 54100 – POC (24 Sep) 54247 – FA (24 Sep) 54417 – Monthly ATR 54592 – 1 ATR (RO 51415) 54688 – 1 ATR (54158) |
| Down |
| 53951 – 2-day VAL (23-24 Sep) 53832 – Buy Tail (23 Sep) 53707 – 1 ATR (FA 54247) 53551 – 20 Sep Halfback 53421 – 1 ATR (53951) 53250 – B TPO h/b (20 Sep) |
Hypos for 26th Sep – 54101 [ 54141 / 53792 ] – Normal Variation (Up)
| Up |
| 54116 – 3-day VAH (23-25 Sep) 54247 – FA (24 Sep) 54417 – Monthly ATR 54592 – 1 ATR (RO 51415) 54688 – 1 ATR (54158) 54794 – W_3IB |
| Down |
| 54098 – M TPO h/b (25 Sep) 53957 – 3-day VAL (23-25 Sep) 53832 – Buy Tail (23 Sep) 53707 – 1 ATR (FA 54247) 53551 – 20 Sep Halfback 53420 – 1 ATR (53957) |
Hypos for 27th Sep – 54375 [ 54467 / 54010 ] – Normal Variation (Up)
| Up |
| to be udpated… |
| Down |
| to be updated… |
