Nifty Spot: 21349 [ 21593 / 20976 ]
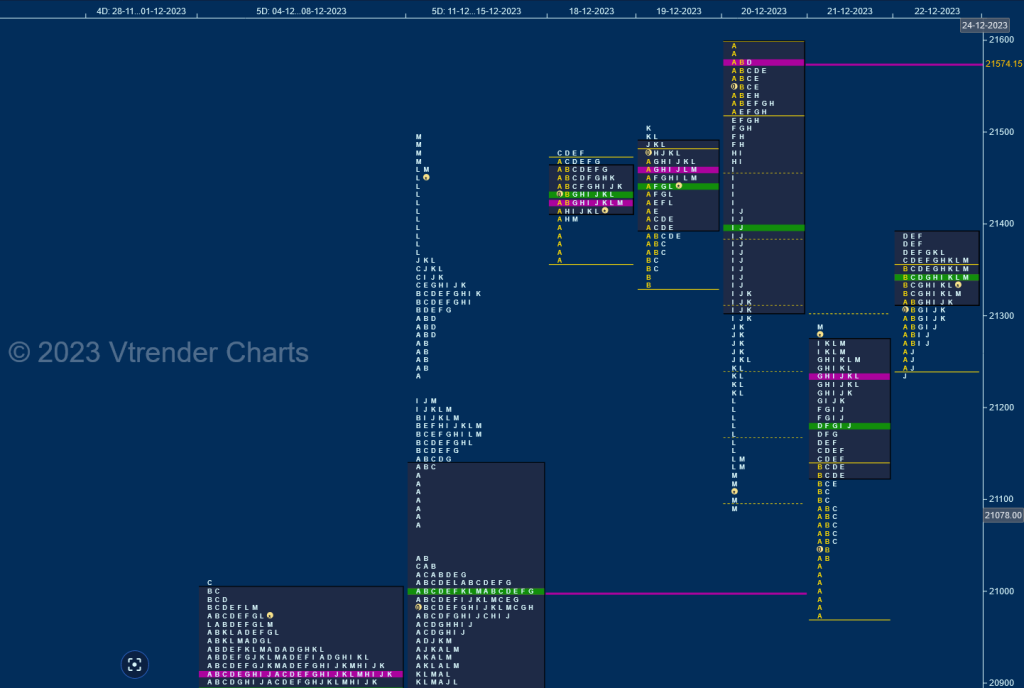
Previous week’s profie was a Neutral Extreme one to the upside after it showed weakness on the downside leaving poor lows at 20769 in an attempt to probe below the prior weekly Value and this failure of sellers not only triggered a short covering probe higher but also saw initiative demand coming back as Nifty made a trending move higher closing in a big spike higher from 21365 to 21492 which will be the zone to watch for the coming week. Value was overlapping to higher at 20770-21000-21133 with the immediate daily POC of 21325 being the first level of support below the spike zone

| Day (Date) | Close (High / Low) | Auction | Day Type |
| Mon (18th Dec) | 21418 (21482 / 21365) | Nifty formed a narrow 117 point range ‘p’ shape profile consolidating in the spike zone with a low right at 21365 and similar highs at 21482 with a close near the prominent POC of 21425 | Normal |
| Tues (19th Dec) | 21453 (21505 / 21337) | The auction formed an outside day both in terms of range & value testing both ends of Monday’s range but failed to get any initiative move with the 2-day POC still at 21424 | Normal |
| Wed (20th Dec) | 21150 (21593 / 21087) | Nifty opened with a gap up of 90 points and went on to hit new ATH of 21593 but settled down into an OAOR forming a narrow 68 point range IB indicating lack of fresh demand as it built the POC at 21574 and gave a trending move lower in the afternoon which started with a swipe through the 2-day value of 21475 to 21418 & falling by a huge 500+ points getting into previous week’s mid profile singles zone from 21132 to 21037 while making a low of 21087 | Trend (Down) |
| Thur (21st Dec) | 21255 (21288 / 20976) | continued the imbalance by opening lower and tagging previous week’s POC of 21000 while making a low of 20976 in the A period but left an initiative buying tail marking the end of the downmove and made a largely One Time Frame probe higher for the rest of the day making a high of 21288 with the dPOC at 21238 | Trend (Up) |
| Fri (22nd Dec) | 21349 (21390 / 21232) | The auction continued the upmove making higher highs till the D period where it hit 21390 but ended up leaving poor higher at 21388 in the F signalling exhaustion creeping in which triggered a liquidation drop down to 21248 in the J TPO but the yPOC of 21238 being saved meant that buyers were back and they succeeded in taking it back above IBH confirming a FA (Failed Auction) at lows and a Neutral Day with a close right at the TPO POC of 21350 | Neutral |

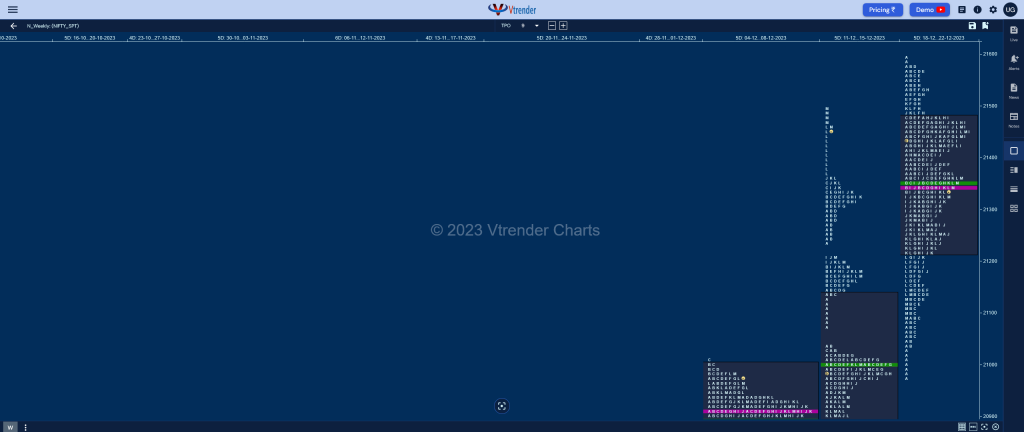
The weekly profile is a Neutral Centre one with completely higher Value at 21217-21342-21478 with a nice responsive buying tail at lows from 21036 to 20976 along with the daily FA of 21232 from 22nd Dec which will be the references on the downside for the coming week where as on the upside, Nifty will need to sustain above 21355 for a test of 20th Dec’s mid-profile zone of singles from 21414 to 21490 and above that the VPOC of 21574 along with the 2 ATR objective of 21599 from 21232 could come into play.
Click here to view this week’s MarketProfile of Nifty on Vtrender Charts
Hypos for 29th Dec 2023
| Up |
| 21777 – Spike low (28 Dec) 21815 – 2 ATR from VPOC (21445) 21865 – 1 ATR from PDL 21903 – 1 ATR from yVAL (21720) 21944 – 2 ATR from VPOC (21574) |
| Down |
| 21770 – VAH from 28 Dec 21720 – VAL from 28 Dec 21684 – Buying Tail (28 Dec) 21647 – Closing singles (27 Dec) 21603 – Spike Low (27 Dec) |
BankNifty Spot: 47491 [ 48166 / 46919 ]
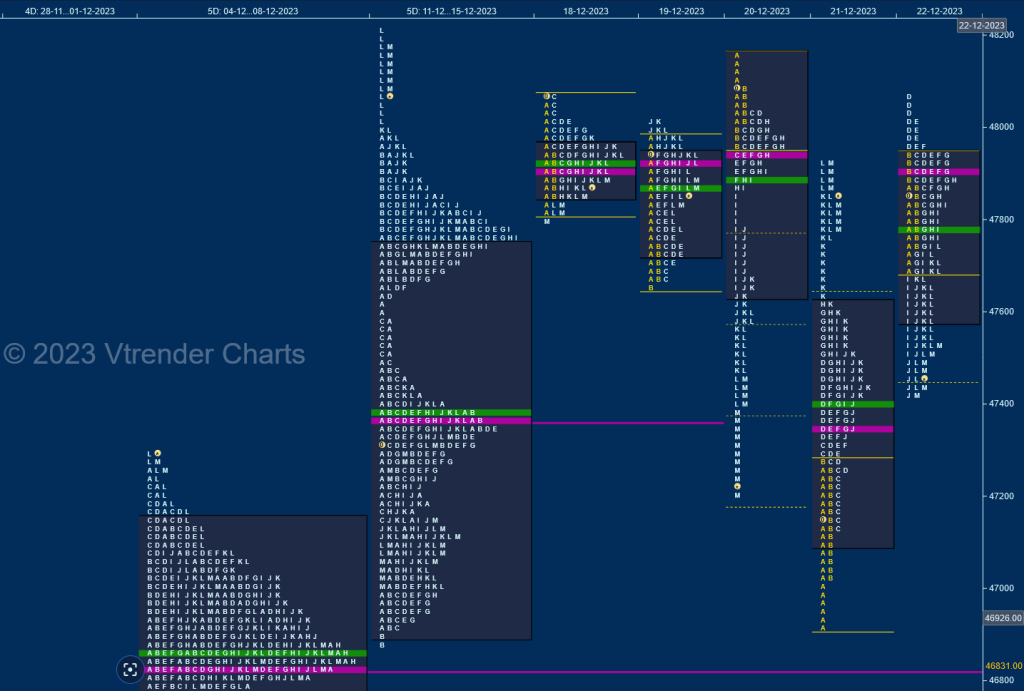
Previous week’s profile was a Neutral Extreme one to the upside with the first half of the week probing lower after hitting new ATH of 47588 via the dreaded C side on 11th Dec from where it gave a retracement down to 46886 on 13th taking support just above the prior week’s prominent POC of 46831 where fresh demand came back in causing a big gap up scaling above 47588 hitting new highs of 47493 on 14th Dec and closed the week confirming a FA at 47632 on 15th leaving a Neutral Exteme daily proile with a spike higher from 47995 to 48220. Value for the week was overlapping to higher at 46898-47363-47739 which also resembles a DD (Double Distribution) with 2 prominent TPO HVNs at 47754 & 47363 and a low volume zone between them

| Day (Date) | Close (High / Low) | Auction | Day Type |
| Mon (18th Dec) | 47867 (48076 / 47806) | BankNifty did not give a follow up to 15th Dec’s NeuX close and formed a very narrow 270 point range balance building a prominent POC at 47914 with a typical C side extension to 48076 marking the highs for the day whereas on the downside it made a pretty late attempt to extend in the M TPO but could only manage marginal new lows of 47806 | Neutral |
| Tues (19th Dec) | 47871 (48017 / 47646) | The auction opened higher but got rejected from Monday’s VAH of 47967 as it made a high of 47976 and made a swipe lower breaking below PDL along with the HVN of 47754 while dropping down to 47646 in the IB leaving an A period selling tail but could not extend any further triggering a short covering move even resulting in a marginal extension to the upside in the J TPO where it tagged 48017 but could not sustain giving a pull back to 47790 leaving a second consecutive Normal Day with mostly overlapping Value. | Normal |
| Wed (20th Dec) | 47445 (48166 / 47202) | started with a gap up open of over 200 points hitting new highs for the week at 48166 but settled down into an OAOR unable to take out previous week’s spike zone which not only triggered a probe back into the 2-day balance of this week but a trending move lower as BankNifty broke below previous week’s POC of 47363 and went on to make a low of 47202 in an imbalanced close | Trend (Down) |
| Thur (21st Dec) | 47840 (47932 / 46919) | The auction continued the down move while making new lows for the current week at 46919 but took support in the tiny buy tail from 49625 to 46886 from previous week and left A period singles till 47029 getting back into Wednesday’s profile & value forming the biggest daily range of 1013-points of this month as it made a high of 47932 stopping just below previous POC of 47944 leaving back to back Trend Days | Trend (Up) |
| Fri (22nd Dec) | 47491 (48071 / 47415) | The auction continued the upmove making higher highs till the D period where it hit 21390 but ended up leaving poor higher at 21388 in the F signalling exhaustion creeping in which triggered a liquidation drop down to 21248 in the J TPO but the yPOC of 21238 being saved meant that buyers were back and they succeeded in taking it back above IBH confirming a FA (Failed Auction) at lows and a Neutral Day with a close right at the TPO POC of 21350 | Neutral Extreme |

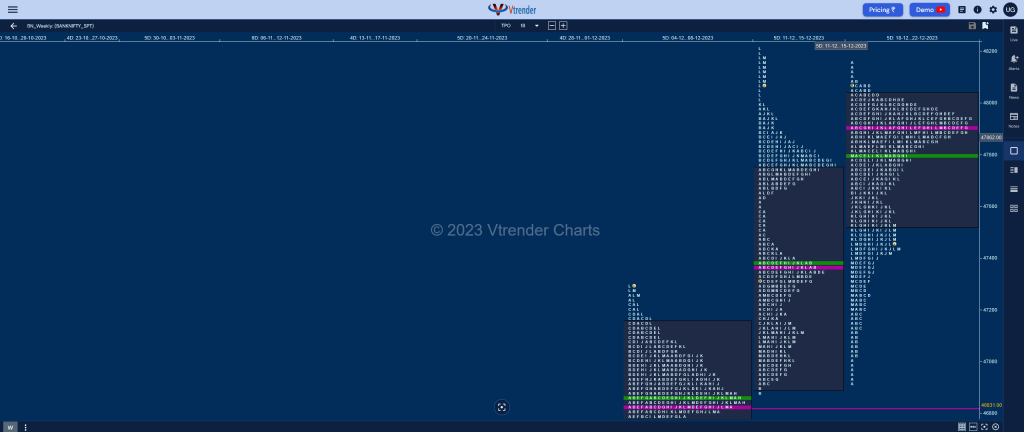
The weekly profile is a Neutral and a well balanced one with overlapping to higher Value at 47536-47915-48028 and has small tails at both ends indicating rejection and presence of 2 big OTF (Other Time Frame) players who have marked their respective zones and BankNifty could continue to remain in this range before one of the tails is taken out with this week’s prominent POC of 47915 acting as a magnet.
Click here to view this week’s MarketProfile of BankNifty on Vtrender Charts
Hypos for the week 29th Dec 2023
| Up |
| 48566 – PBH from 28 Dec 48643 – Weekly 3 IB 48758 – 2 ATR (VPOC 47710) 48853 – 1 ATR from PDL 49002 – 1 ATR (yPOC 48492) |
| Down |
| 48492 – POC from 28 Dec 48370 – Buying Tail (28 Dec) 48245 – Spike low (27 Dec) 48049 – dPOC from 27 Dec 47884 – Buying Tail (27 Dec) |
