Nifty Spot: 22096 [ 22180 / 21710 ]

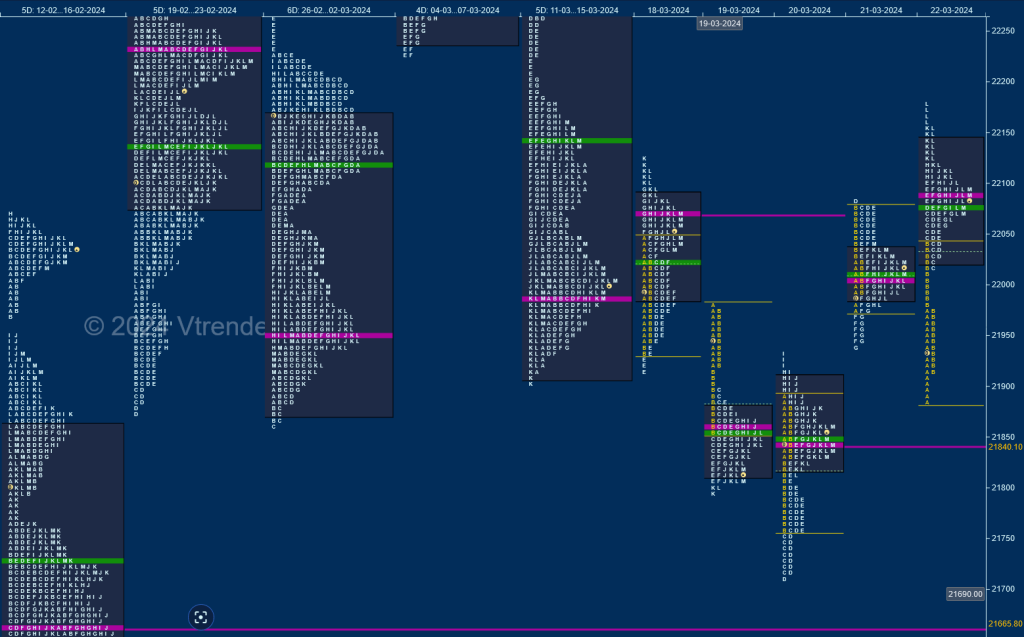
Nifty continued to build on previous week’s POC of 21987 in the first half on Monday where it made an attempt to extend lower in the E period which was rejected leading to a FA being confirmed at 21916 and a Neutral Extreme (NeuX) Day as it stopped just short of the 1 ATR objective of 22131 while making a high of 22123 in the K TPO and saw the POC shifting higher to 22068 indicating profit booking.
The auction failed to give any follow up the the NeuX profile on Tuesday and in fact opened lower and went on to negate the FA of 21916 leaving a selling extension handle at 21922 marking the change of PLR (Path of Least Resistance) to the downside forming a ‘b’ shape profile with a prominent POC at 21862 and resumed the probe lower on Wednesday with yet another extension handle at 21831 in the IB followed by couple of REs hitting a low of 21710 almost completing the 1 ATR target from the negated FA of 21916 which also.
Nifty showed change of character as it left a SOC (Scene Of Crime) at 21801 and negated the selling references of 21831 & 21922 forming the second Neutral Day of the week with a close right at the POC of 21840 and continued the upside imbalance with a higher open on Thursday where it tagged Monday’s VPOC of 22068 but could not sustain above it resulting in yet another Neutral Centre Day as it made a low of 21941 before closing at 22012.
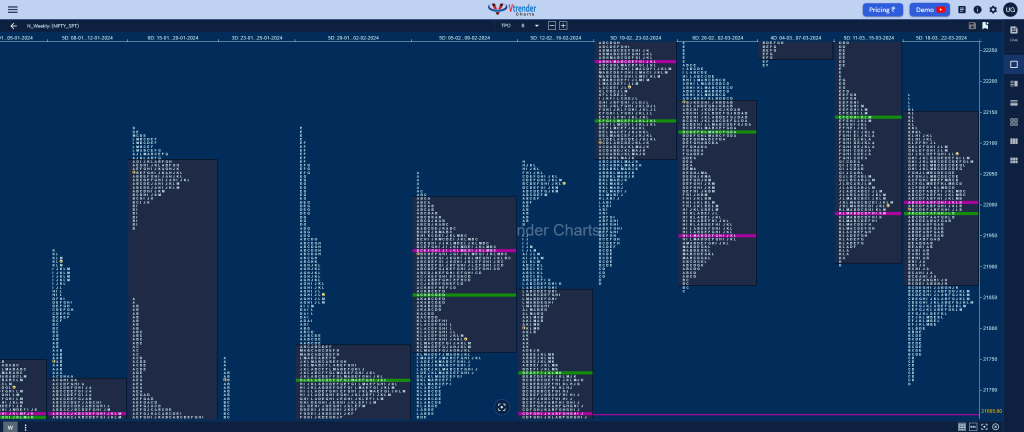
Friday saw a lower open back into the 2-day balance of Tuesday-Wednesday but left an A period buying tail showing rejection after which it went on to swipe through previous Value repairing the ledge near 22080 and went on to make new highs of 22180 for the week but saw a quick retracment back to 22063 before settling down to close around the POC of 22091 leaving a Trend Day Up. The weekly profile is a Neutral one with mostly overlapping Value at 21872-22002-22151 and has 2 prominent TPO HVNs at 21840 and 22068 and could remain between these 2 in the coming week filling up the low volume zone and completing a Gaussian Curve before starting a fresh imbalance.

Click here to view this week’s MarketProfile of Nifty on Vtrender Charts
Hypos for 27th Mar
| Up |
| 22013 – M TPO h/b 22050 – POC (26 Mar) 22091 – VPOC (22 Mar) 22136 – Weekly 1.5 IB 22187 – Sell tail (14 Mar) 22224 – EH (13 Mar) |
| Down |
| 21989 – 3-day VAL (21-26 Mar) 21947 – Weekly IBL 21890 – 2D_VAH (19-20 Mar) 21840 – VPOC (20 Mar) 21813 – 2D_VAL (19-20 Mar) 21755 – D TPO halfback |
BankNifty Spot: 46863 [ 46990 / 45828 ]

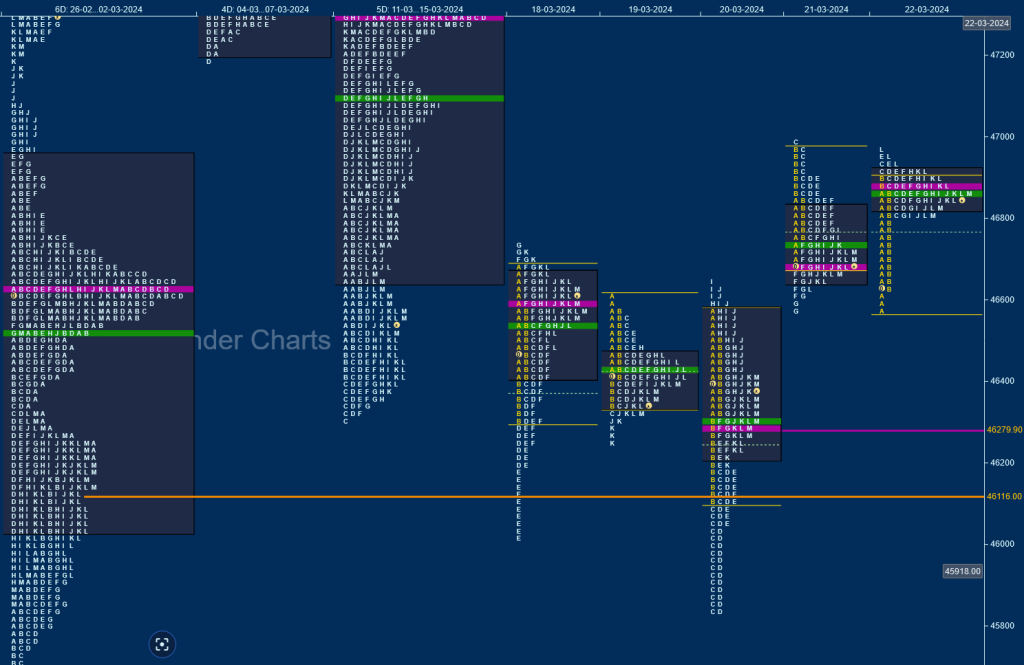
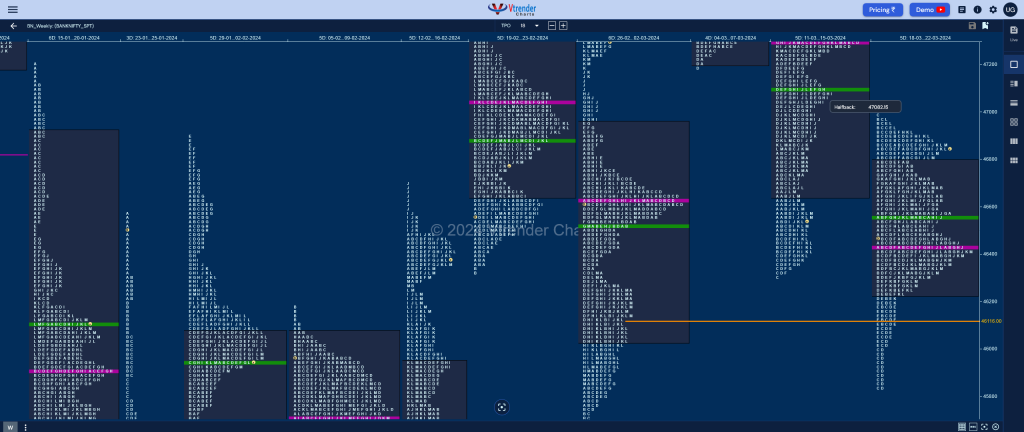
BankNifty has made a relatively narrow range Neutral profile on the weekly with overlapping to lower Value at 46227-46438-46796 with a prominent POC at 46438 and poor lows indicating exhaustion on the downside and the bounce back being stalled with a daily FA at 46990 which will be the swing reference for the coming week.

Click here to view this week’s MarketProfile of BankNifty on Vtrender Charts
Hypos for 27th Mar
| Up |
| 46634 – POC (26 Mar) 46754 – Sell Tail (26 Mar) 46889 – VPOC (22 Mar) 46990 – FA (21 Mar) 47087 – SOC (14 Mar) 47215 – Sell tail (14 Mar) |
| Down |
| 46593 – VAL (26 Mar) 46422 – 4-day VPOC (15-20 Mar) 46334 – 1 ATR (FA 46990) 46200 – 4-day aly (15-20 Mar) 46012 – D TPO h/b (20 Mar) 45864 – VPOC (20 Mar) |
