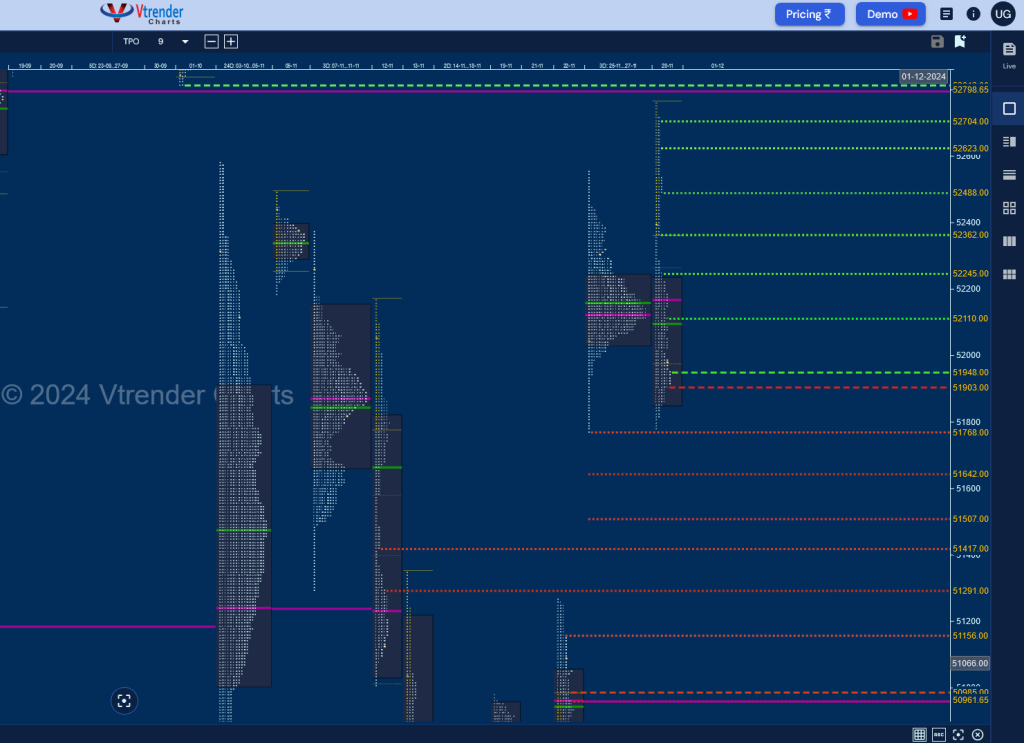
Nifty Spot: 23907 [ 23956 / 23263 ] Neutral Extreme (Up)
Previous week’s report ended with this ‘The weekly profile is a Double Distribution (DD) Trend Down one with an elongated range of 853 points with completely overlapping Value at 23653-24141-24333 with an extension handle at 24004 and a low TPO zone till 23807 which will be the DD singles and the major supply zone for the coming week whereas the lower TPO HVN of 23544 being the immediate level on the upside whereas on the downside, 23456 will be a minor support below which a test of the lower weekly VPOC of 23332 and HVN of 23200 could come and a break of which could trigger a further drop towards 22995 & 22745 in the coming weeks‘
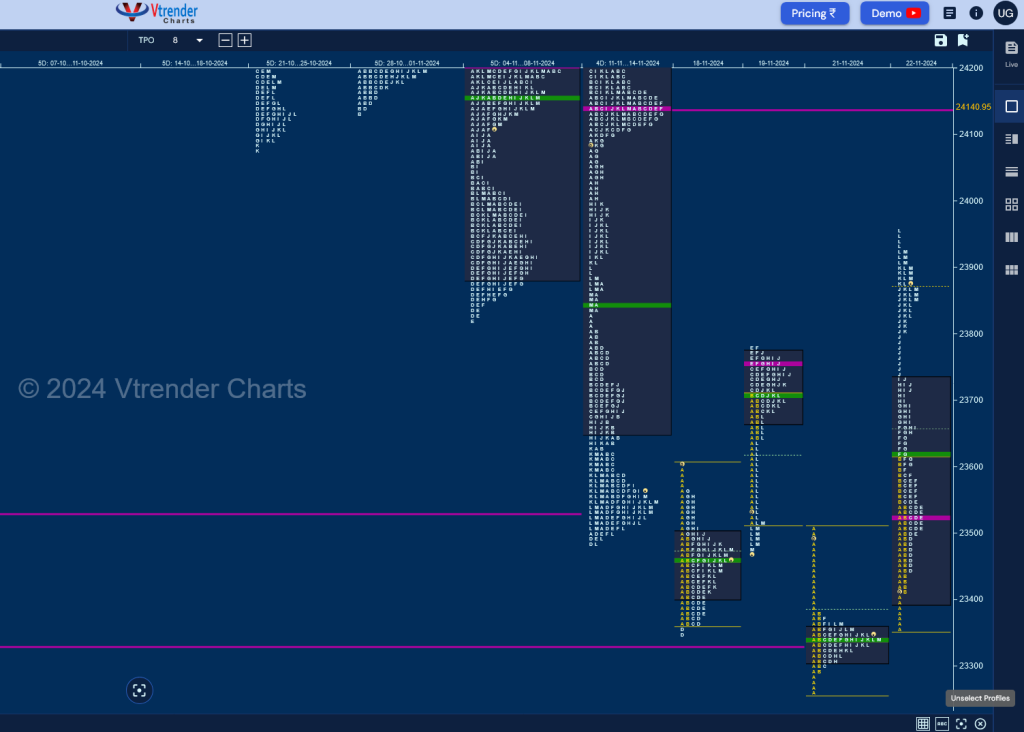
Monday – 23453 [ 23606 / 23350 ] Normal
Tuesday – 23518 [ 23780 / 23464 ] Neutral Extreme (Down)
Wednesday – Holiday
Thursday – 23349 [ 23507 / 23263 ] Normal (‘b’ shape)
Friday – 23907 [ 23956 / 23359 ] Trend (Up)
The weekly profile is a Neutral Extreme one to the Upside in a range of 693 points with completely lower Value at 23289-23339-23647 not only leaving a weekly FA (Failed Auction) at lows of 23236 but also completing the 1 ATR objective of 23872 with the help of an extension handle at 23780 which will be the support for the coming week and staying above which Nifty could continue to probe higher previous week’s VPOC of 24141 & the 2 ATR target of 24480.
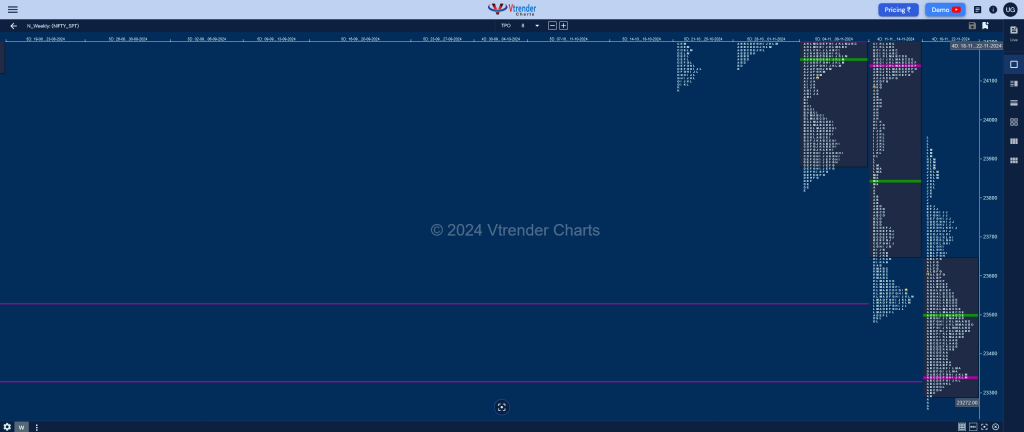
Click here to view this week’s MarketProfile of Nifty on Vtrender Charts
Hypos for 25th Nov – 23907 [ 23956 / 23359 ] Trend (Up)
| Up |
| 23920 – Sell tail (22 Nov) 23985 – 2 ATR (VPOC 23339) 24040 – 12 Nov Halfback 24100 – Ext Handle (12 Nov) 24138 – VPOC (12 Nov) 24201 – C TPO high (12 Nov) 24267 – SOC (11 Nov) |
| Down |
| 23907 – Close (22 Nov) 23854 – M TPO low (22 Nov) 23780 – Weekly Ext Handle 23731 – Ext Handle (22 Nov) 23657 – 22 Nov halfback 23606 – F TPO h/b (22 Nov) 23550 – SOC (22 Nov) |
Hypos for 26th Nov – 24221 [ 24351 / 24135 ] Neutral
| Up |
| 24239 – M TPO h/b (25 Nov) 24281 – POC (25 Nov) 24326 – E TPO h/b (25 Nov) 24382 – Sell Tail (07 Nov) 24447 – SOC (07 Nov) 24503 – Sell tail (Nov) 24562 – H TPO h/b (23 Oct) |
| Down |
| 24218 – M TPO low (25 Nov) 24161 – Buy tail (25 Nov) 24100 – Ext Handle (12 Nov) 24040 – Gap mid (25 Nov) 23985 – 2 ATR (VPOC 23339) 23920 – Tail (22 Nov) 23887 – M TPO h/b (22 Nov) |
Hypos for 27th Nov – 24194 [ 24343 / 24125 ] Normal Variation (Down)
| Up |
| 24205 – M TPO high (26 Nov) 24263 – Sell Tail (26 Nov) 24326 – E TPO h/b (25 Nov) 24382 – Sell Tail (07 Nov) 24447 – SOC (07 Nov) 24503 – Sell tail (Nov) 24562 – H TPO h/b (23 Oct) |
| Down |
| 24187 – POC (26 Nov) 24135 – Buy tail (26 Nov) 24080 – Gap mid (25 Nov) 24027 – Weekly 1.5 IB 23955 – 1 ATR (yPOC 24281) 23887 – M TPO h/b (22 Nov) 23834 – L TPO low (22 Nov) |
Hypos for 28th Nov – 24274 [ 24354 / 24145 ] Double Distribution (Up)
| Up |
| 24281 – M TPO high (27 Nov) 24341 – Sell tail (27 Nov) 24382 – Sell Tail (07 Nov) 24447 – SOC (07 Nov) 24503 – Sell tail (Nov) 24562 – H TPO h/b (23 Oct) 24606 – VPOC (22 Oct) 24658 – Ext Handle (22 Oct) |
| Down |
| 24274 – M TPO h/b (27 Nov) 24234 – SOC (27 Nov) 24184 – POC (27 Nov) 24135 – Buy tail (26 Nov) 24080 – Gap mid (25 Nov) 24027 – Weekly 1.5 IB 23955 – 1 ATR (yPOC 24281) 23887 – M TPO h/b (22 Nov) |
Hypos for 29th Nov – 23914 [ 24345 / 23873 ] Trend (Down)
| Up |
| 23959 – M TPO high (28 Nov) 24009 – K TPO high (28 Nov) 24056 – POC (28 Nov) 24109 – 28 Nov Halfback 24135 – NeuX handle 24200 – C TPO h/b (28 Nov) 24254 – Ext Handle (28 Nov) |
| Down |
| 23884 – Buy tail (28 Nov) 23834 – L TPO low (22 Nov) 23780 – Weekly Ext Handle 23731 – Ext Handle (22 Nov) 23657 – 22 Nov halfback 23606 – F TPO h/b (22 Nov) 23550 – SOC (22 Nov) |
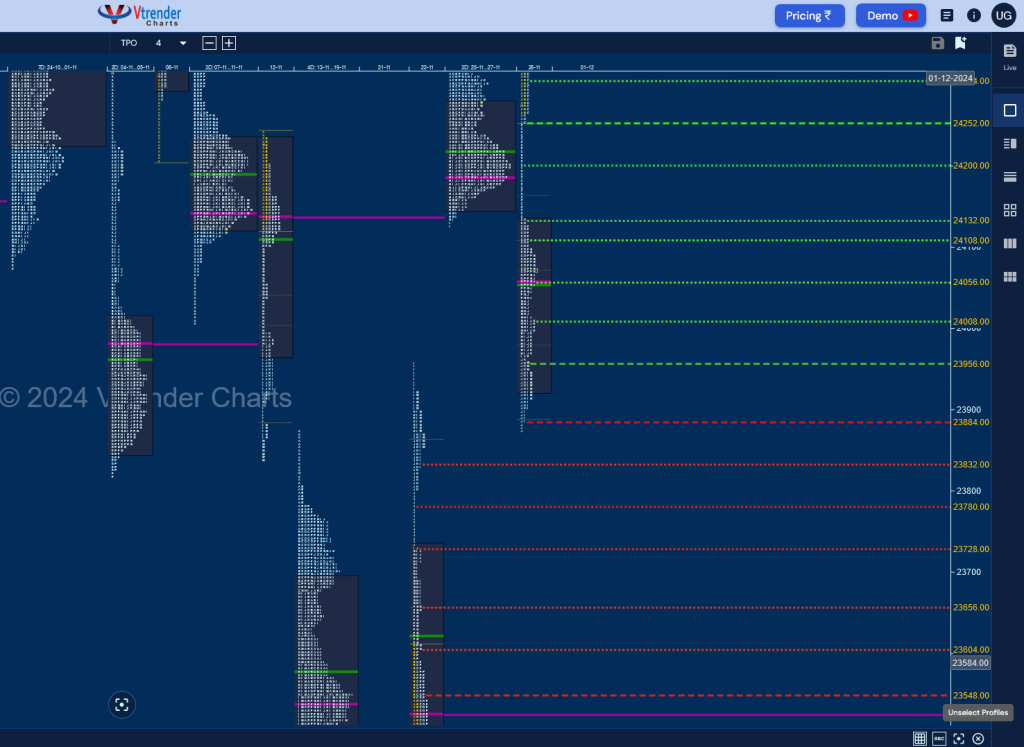
BankNifty Spot: 51135 [ 51271 / 49787 ] Neutral Extreme (Up)
Previous week’s report ended with this ‘The weekly profile is a Trend One to the downside with an elongated range of 2273 points with completely outside Value at 50518-50689-52177 along with the lower TPO HVN at 50175 which will be the immediate reference on watch for the coming week staying below which BankNifty could continue the probe lower towards the weekly VPOCs of 49733 & 49326 whereas on the upside, 50620 & 50865 will be the major supply points along with 51055‘
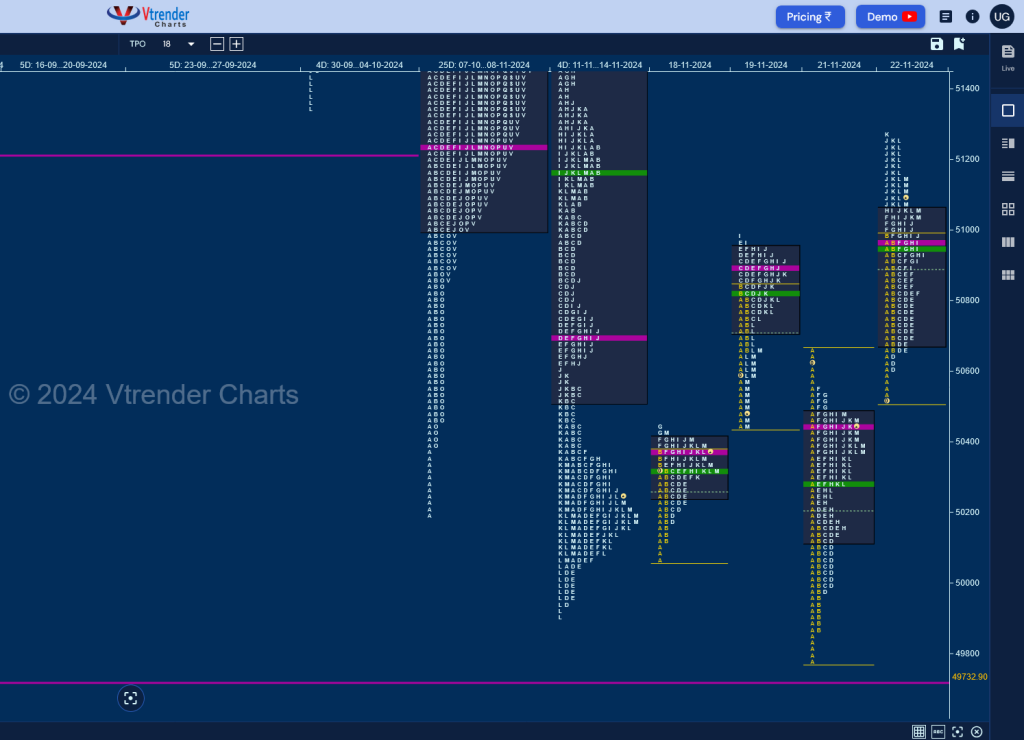
Monday – 50363 [ 50445 / 50074 ] Normal (Inside Bar)
Tuesday – 50626 [ 50983 / 50440 ] – Neutral
Wednesday – Holiday
Thursday – 50372 [ 50652 / 49787 ] – Normal (3-1-3)
Friday – 51135 [ 51271 / 50508 ] – Normal Variation (Up)
The weekly profile is a Neutral Extreme one to the Upside after BankNifty took support above the weekly VPOC of 49732 while making a low of 49787 & leaving an A period buying tail on the daily timeframe with later on also confirming a weekly FA promptly completing the 1 ATR goal of 51256 while making new highs for the week at 51271 and has an immediate supply point at 51294 which if taken out & sustained could continue the probe higher towards the Swing High of 52177 & the weekly DD zone from 52566 to 52816 along with the weekly VPOC of 53001 in the coming week
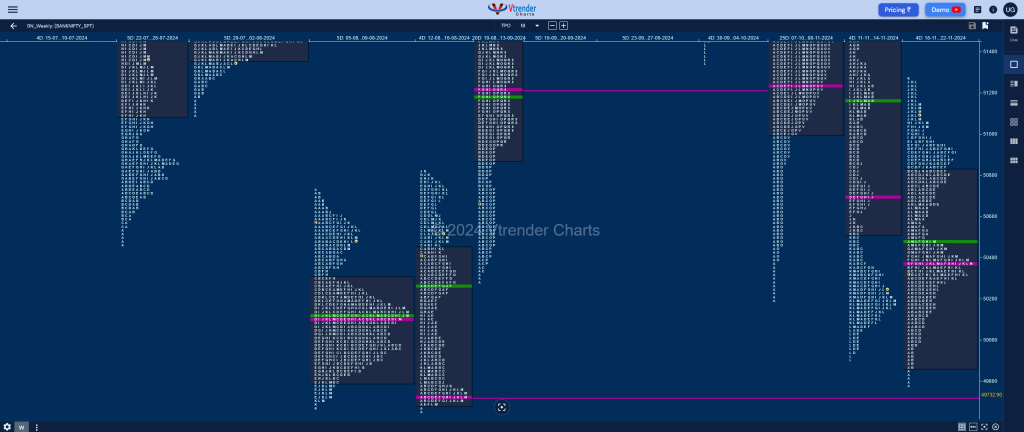
Click here to view this week’s MarketProfile of BankNifty on Vtrender Charts
Hypos for 25th Nov – 51135 [ 51271 / 50508 ] – Normal Variation (Up)
| Up |
| 51156 – L TPO h/b (22 Nov) 51294 – Daily Ext Handle 51421 – Ext Handle (12 Nov) 51588 – 12 Nov Halfback 51672 – SOC (12 Nov) 51780 – F TPO h/b (12 Nov) 51874 – PBH (12 Nov) |
| Down |
| 51097 – M TPO h/b (22 Nov) 50963 – POC (22 Nov) 50889 – 22 Nov Halfback 50766 – E TPO h/b (22 Nov) 50608 – Buy Tail (22 Nov) 50479 – VAH (21 Nov) 50371 – Weekly POC |
Hypos for 26th Nov – 52207 [ 52331 / 51774 ] Normal (‘p’ shape)
| Up |
| 52237 – M TPO h/b (25 Nov) 52335 – POC (06 Nov) 52451 – Sell Tail (06 Nov) 52577 – Swing High (21 Oct) 52691 – IB tail mid (03 Oct) 52817 – Daily Ext Handle 52977 – VPOC (01 Oct) |
| Down |
| 52200 – POC (25 Nov) 52068 – VAL (25 Nov) 51944 – Buy Tail (25 Nov) 51774 – Weekly IBL 51672 – SOC (12 Nov) 51588 – 12 Nov Halfback 51435 – 1 ATR (yPOC 52200) |
Hypos for 27th Nov – 52191 [ 52555 / 51999 ] – Normal (‘b’ shape)
| Up |
| 52195 – M TPO h/b (26 Nov) 52294 – Sell Tail (26 Nov) 52451 – Sell Tail (06 Nov) 52577 – Swing High (21 Oct) 52691 – IB tail mid (03 Oct) 52817 – Daily Ext Handle 52977 – VPOC (01 Oct) |
| Down |
| 52158 – M TPO low (26 Nov) 52044 – 25 Nov Halfback 51944 – Buy Tail (25 Nov) 51774 – Weekly IBL 51672 – SOC (12 Nov) 51591 – Gap mid (25 Nov) 51435 – 1 ATR (yPOC 52200) |
Hypos for 28th Nov – 52301 [ 52444 / 52019 ] – Normal Variation (Up)
| Up |
| 52308 – M TPO high (27 Nov) 52451 – Sell Tail (06 Nov) 52577 – Swing High (21 Oct) 52691 – IB tail mid (03 Oct) 52817 – Daily Ext Handle 52977 – VPOC (01 Oct) 53114 – Sell Tail (01 Oct) |
| Down |
| 52294 – M TPO h/b (27 Nov) 52188 – SOC (27 Nov) 52034 – Buy Tail (27 Nov) 51944 – Buy Tail (25 Nov) 51774 – Weekly IBL 51648 – 1 ATR (yPOC 52386) 51515 – Weekly 1.5 IB |
Hypos for 29th Nov – 51906 [ 52760 / 51783 ] – Trend (Down)
| Up |
| 51950 – M TPO h/b (28 Nov) 52117 – PBH (28 Nov) 52248 – PBH (28 Nov) 52364 – Ext Handle (28 Nov) 52488 – SOC (28 Nov) 52624 – B TPO h/b (28 Nov) 52718 – Sell Tail (28 Nov) 52817 – Daily Ext Handle |
| Down |
| 51903 – L TPO h/b (28 Nov) 51774 – Weekly IBL 51648 – 1 ATR (yPOC 52386) 51514 – Weekly 1.5 IB 51421 – Ext Handle (12 Nov) 51294 – SOC 51156 – L TPO h/b (22 Nov) 50992 – J TPO low (22 Nov) |
