Nifty Spot: 22957 [ 23026 / 22440 ]

Monday – Holiday
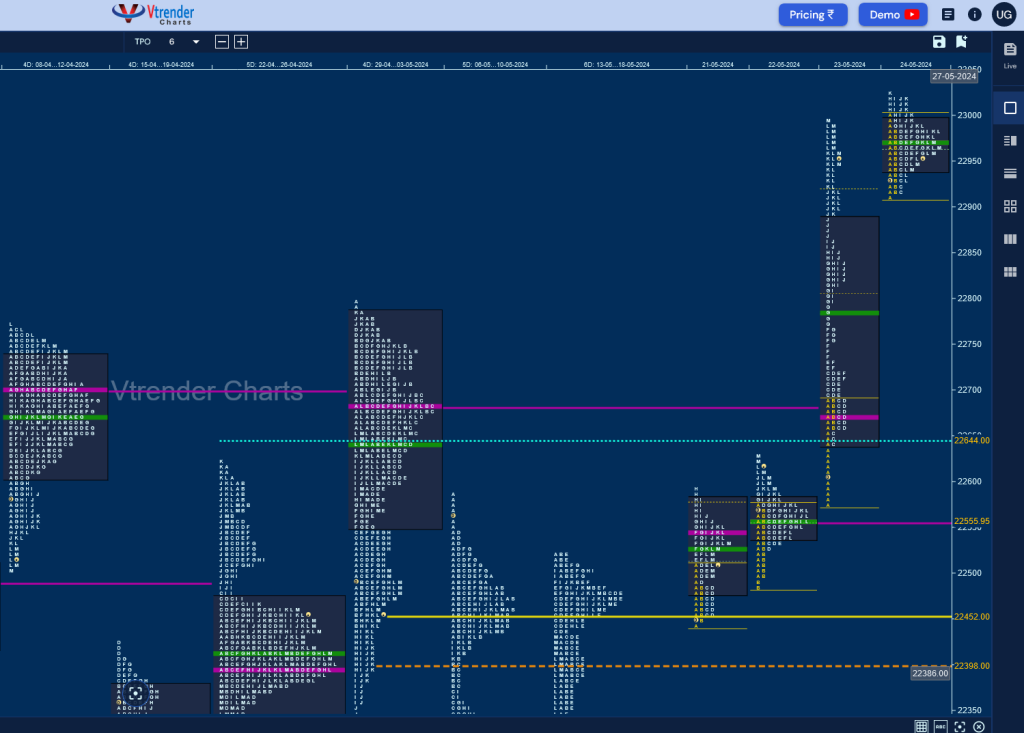
Tuesday – Nifty made an Open Auction start consolidation around previous week’s HVN of 22479 in the first half before leaving a SOC (Scene Of Crime) at 22485 & probed higher not only getting into the weekly selling tail from 22542 to 22588 (06-10 May) but completely negated while making a high of 22591 indicating that the PLR (Path of Least Resistance) was to the upside
Wednesday – saw a test of the SOC of 22485 in the IB (Initial Balance) as it made a low of 22483 and left a small but important buying tail after which it remained mostly in a narrow range forming a 2-day overlapping POC at 22545 before giving a mini spike to 22629 into the close
Thursday – opened with a test of the spike zone and an entry into previous value but could only manage to hit 22577 getting swiftly rejected and confirming an ORR (Open Rejection Reverse) as it first went on to tag the weekly VPOC of 22682 building the POC at 22673 after which it left couple of extension handles at 22733 & 22768 to hit new ATH of 22852 and gave a typical afternoon pull back down to 22795 holding the previous ATH signalling that the upside is still not over. The auction then left the third extension handle of the day at 22860 and went on to climb higher into the close making new highs of 22993 completing a big 416 point range Trend Day Up
Friday – It was a transition back to balance after recording new ATH of 23004 at the open as Nifty formed a narrow 96 point range IB and remained in it for the first half of the day and made multiple REs in the second half but could only manage similar highs in the zone of 23019 to 23026 showing that OTF was absent and it was mostly locals in play which saw a decent retracement down to 22927 in the L TPO before settling down around the prominent POC of 22971 leaving a Gaussian Curve for the day
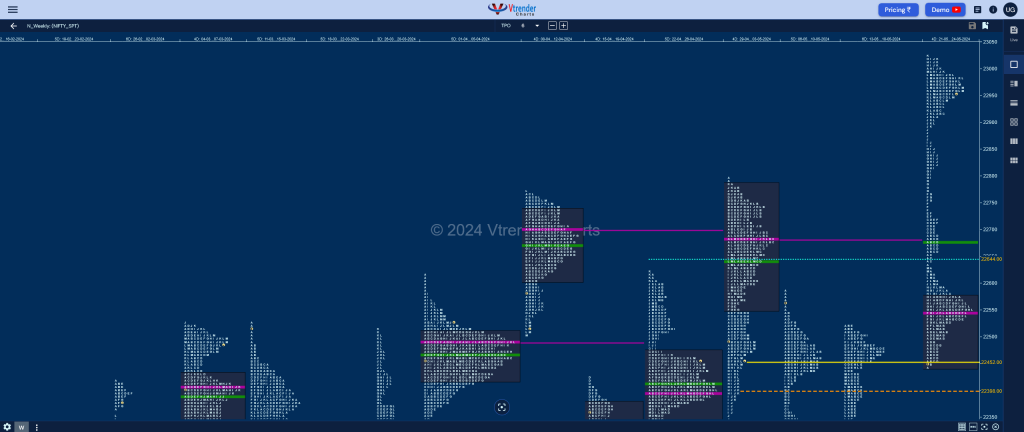
The weekly profile is a Double Distribution Trend Up one which started with a 2-day balance having a prominent POC at 22545 and gave a move away to the upside with the help of three extension handles at 22733, 22768 & 22860 and has formed a balance at the top also with the HVN at 22971 which will be the opening reference for the coming week and staying above which it could go in for the objective of 23456 in the coming week.

Click here to view this week’s MarketProfile of Nifty on Vtrender Charts
Hypos for 27th May – 22957 [ 23026 / 22908 ]
| Up |
| 22971 – POC (24 May) 23019 – Sell tail (24 May) 23045 – 2 ATR (VPOC 22555) 23103 – 2 ATR (Ext Handle 22860) 23159 – 2 ATR (VPOC 22673) |
| Down |
| 22940 – VAL (24 May) 22891 – Mid-profile tail (23 May) 22860 – Ext Handle (23 May) 22795 – PBL (23 May) 22733 – Ext Handle (23 May) |
Hypos for 28th May – 22932 [ 23110 / 22871 ]
| Up |
| 22942 – M TPO h/b (27 May) 22996 – POC (27 May) 23044 – SOC (27 May) 23108 – Sell tail (27 May) 23159 – 2 ATR (VPOC 22673) |
| Down |
| 22924 – Buy tail (27 May) 22860 – Ext Handle (23 May) 22795 – PBL (23 May) 22733 – Ext Handle (23 May) 22673 – POC (23 May) |
Hypos for 29th May – 22888 [ 22998 / 22858 ]
| Up |
| 22889 – Buy tail (28 May) 22950 – POC (28 May) 22998 – FA (28 May) 23044 – SOC (27 May) 23108 – Sell tail (27 May) |
| Down |
| 22860 – Ext Handle (23 May) 22795 – PBL (23 May) 22768 – 1 ATR (FA 22998) 22733 – Ext Handle (23 May) 22673 – VPOC (23 May) |
Hypos for 30th May – 22704 [ 22825 / 22685 ]
| Up |
| 22705 -Spike high (29 May) 22742 – POC (29 May) 22802 – PBH (29 May) 22850 – IB singles mid (29 May) 22889 – Buy tail (28 May) |
| Down |
| 22673 – VPOC (23 May) 22642 – Buy Tail (23 May) 22589 – 2-day VAH (21-22 May) 22545 – 2-day POC (21-22 May) 22518 – 2-day VAL (21-22 May) |
Hypos for 31st May – 22488 [ 22705 / 22417 ]
| Up |
| 22518 – M TPO h/b (30 May) 22567 – POC (30 May) 22602 – PBH (30 May) 22648 – A TPO h/b (30 May) 22705 -Spike high (29 May) |
| Down |
| 22459 – Buy tail (30 May) 22402 – Apr VWAP 22351 – Buy Tail (17 May) 22303 – SOC (16 May) 22267 – 3-day VAH (14-16 May) |
BankNifty Spot: 48971 [ 49053 / 47435 ]

Monday – Holiday
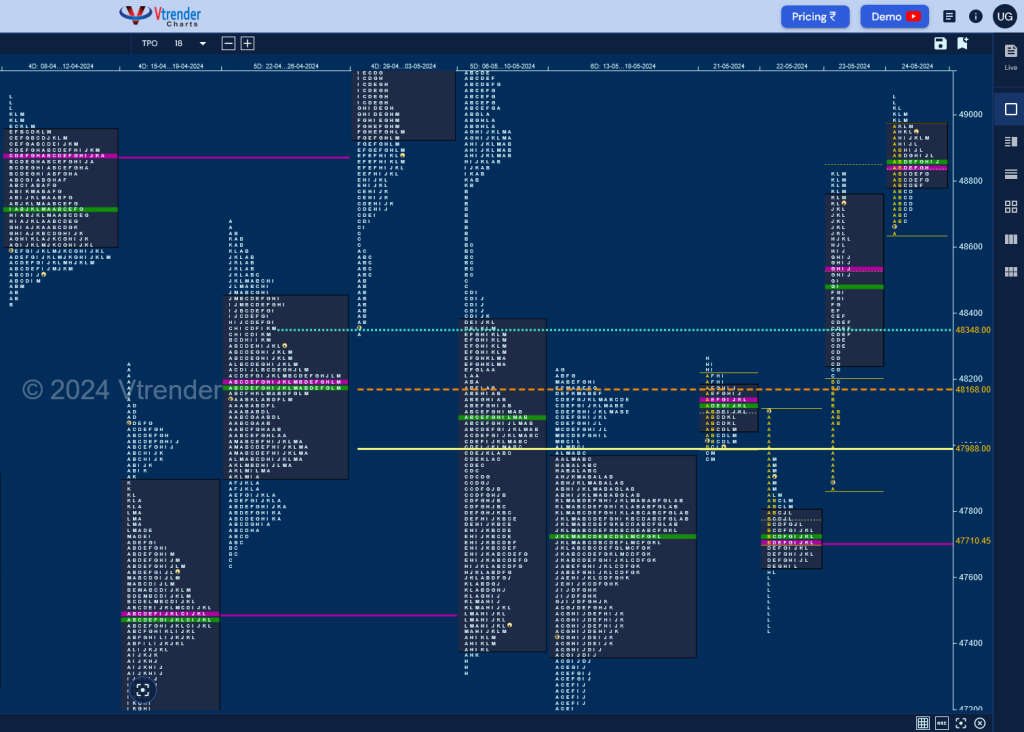
Tuesday – BankNifty opened the week with an OA taking support right at April’s POC of 47994 forming a narrow 225 point range IB after which it made a typical C side extension to 47961 where this entry into previous week’s value was rejected even briefly confirming a FA (Failed Auction) at lows as it made an attempt to extend higher in the H period but stalled right at 48259 which was the DD (Double Distribution) zone of this month’s developing profile (07th to 09th May) indicating that the sellers were active resulting in a probe lower back to 47968 into the close confirming a FA at highs also as it left a narrow range Neutral Day with a prominent POC at 48142
Wednesday – saw an Open Test Drive down as the auction negated the lower FA of 47961 leaving an A period selling tail forcing it back into previous week’s Value hitting the weekly POC of 47725 while making a low of 47702 in the IB and followed it with multiple REs lower but could only manage to tag 47625 which was also around the 1 ATR objective of 47621 from the FA of 48259 looking exhausted on the downside with the day’s profile being a ‘b’ shape with a prominent POC at 47710 but the inactivity was broken with a swipe lower to 47345 in the L TPO which got back aggressive demand coming back taking it back to 47959 into the close leaving a 3-1-3 profile for the day
Thursday – The buyers further strengthened their position with the help of an ORR start leaving an A period tail from 48075 to 47873 after which it left a rare C side extension handle to get above the FA of 48 into the the weekly DD zone from 48465 to 48784 (06-10 May) which it completely negated while making similar highs around 48829 into the close leaving a 957 point range Trend Day Up with the POC at 48540
Friday – began with a repair of the poor highs as BankNifty got into the selling tail from 48911 to 49023 (03rd May) making a high of 48976 but got back into balance mode as it remained in the A period range of 332 points for most part of the day building a prominent POC at 48837 before making couple of small REs to 49020 & 49053 into the close leaving a bell shape
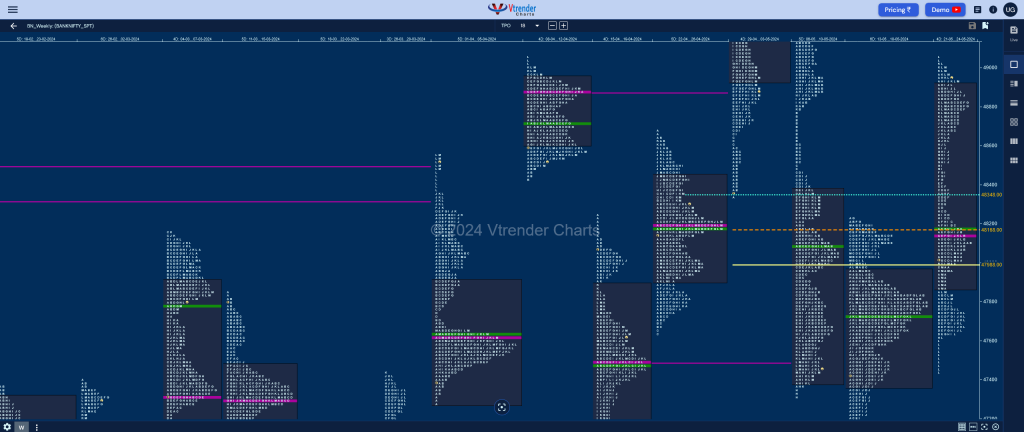
The weekly profile is a Neutral Extreme (NeuX) one to the upside with a buying tail at the lows from 47625 to 47435 and the NeuX extension handle at 48259 which has formed overlapping to higher Value at 47876-48144-48916 and is expected to continue the upside probe towards the weekly POC of 49244 (29th Apr to 03rd May) and the 03rd May Swing High of 49607 above which it can go for the 30th Apr’s sell side references of 49721 & 49896 before going for new ATH in the coming week.

Click here to view this week’s MarketProfile of BankNifty on Vtrender Charts
Hypos for 27th May – 22957 [ 23026 / 22908 ]
| Up |
| 48975 – VAH (24 May) 49091 – VAH (06 May) 49231 – Sell Tail (06 May) 49358 – B TPO h/b (03 May) 49490 – A TPO h/b (03 May) |
| Down |
| 48964 – M TPO h/b (24 May) 48838 – POC (24 May) 48675 – Buy Tail (24 May) 48540 – POC (23 May) 48406 – Ext Handle (23 May) |
Hypos for 28th May – 49281 [ 49689 / 49051 ]
| Up |
| to be updated… |
| Down |
| to be updated… |
Hypos for 29th May – 49142 [ 49511 / 49043 ]
| Up |
| 49174 – VAL (28 May) 49340 – VAH (28 May) 49505 – SOC (27 May) 49658 – Sell tail (27 May) 49721 – SOC (30 Apr) |
| Down |
| 49130 – 2-day VAL (27-28 May) 48975 – VAH (24 May) 48838 – VPOC (24 May) 48675 – Buy Tail (24 May) 48540 – POC (23 May |
Hypos for 30th May – 48501 [ 49022 / 48401 ]
| Up |
| 48523 – Monthly IBL 48670 – PBH (29 May) 48770 – Ext Handle (29 May) 48910 – A TPO h/b (29 May) 49051 – Weekly IBL |
| Down |
| 48460 – Buy tail (29 May) 48352 – 23 May Halfback 48204 – Ext Handle (23 May) 48075 – Buying Tail (23 May) 47959 – M TPO high (22 May) |
Hypos for 31st May – 48682 [ 49044 / 48313 ]
| Up |
| 48712 – POC (30 May) 48839 – VAH (30 May) 48943 – J TPO h/b (30 May) 49051 – Weekly IBL 49174 – VAL (28 May) 49283 – VPOC (28 May) |
| Down |
| 48668 – L TPO h/b (30 May) 48531 – Buy Tail (30 May) 48460 – Buy tail (29 May) 48352 – 23 May Halfback 48204 – Ext Handle (23 May) 48075 – Buying Tail (23 May) |
