Nifty Spot: 24180 [ 24978 / 24073 ] Trend (Down)
Previous week’s report ended with this ‘Value was overlapping at both ends at 24815-25064-25160 as the auction failed to move away from previous week’s balance as seen with tails at both ends so will need to negate either 24611 on the downside for a probe towards weekly HVNs of 24420 & 24304 along with the VPOC of 24149 (12-16 Aug) whereas on the upside, it will need to sustain above 25160 and negate the weekly FA of 25212 for a test of the weekly HVNs of 25272 & 25415 above which can go for Sep’s VWAP of 25539‘
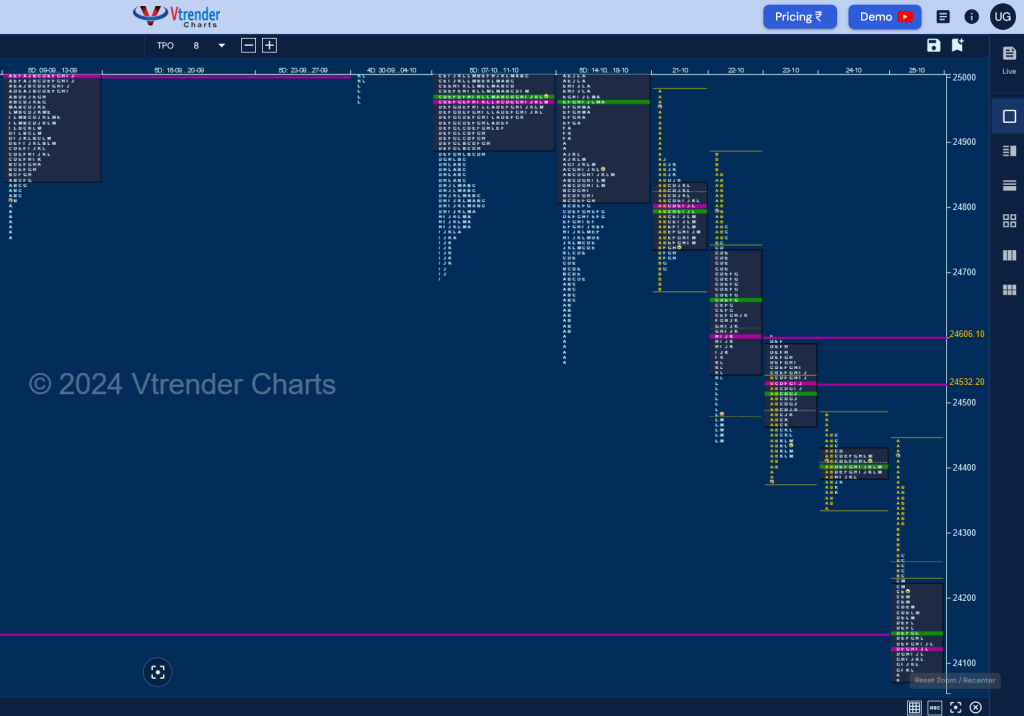
Monday – 24781 [ 24978 / 24679 ] Normal (‘b’ shape)
Tuesday – 24472 [ 24882 / 24445 ] Trend (Down)
Wednesday – 24435 [ 24604 / 24378 ] – Normal Variation (Up)
Thursday – 24399 [ 24480 / 24341 ] Normal
Friday – 24180 [ 24440 / 24073 ] – Trend (Down)
Nifty opened the week with an Open Rejection Reverse (ORR) leaving an initiative selling tail from 24882 to 24978 signalling the start of a fresh imbalance and went on to make an One Time Frame drop lower on the daily timeframe making lower lows and closing the week with another ORR start on Friday where it also left an extension handle at 24312 and went on to tag the final objective of 24148 even breaking below it as it tested the twin swing lows of 24099 & 24079 from 14th & 05th Aug while making a low of 24073 and saw a sharp bounce back to 24225 into the close.
The weekly profile is a Trend one to the downside with an initiative selling tail from 24878 to 24978 forming lower Value at 24355-24400-24808 with an extension handle at 24312 which will be the first major supply point for the coming week which the bulls will have to reclaim for a test of 24400-24451 above which it could fill up the zone till 24750 whereas on the downside, 24171-24125 will be the support zone below which Nifty could go in for a test of the swing low of 23893 and a decisive break of it could give a further drop to the weekly extension handle of 23618 & VPOC of 23533
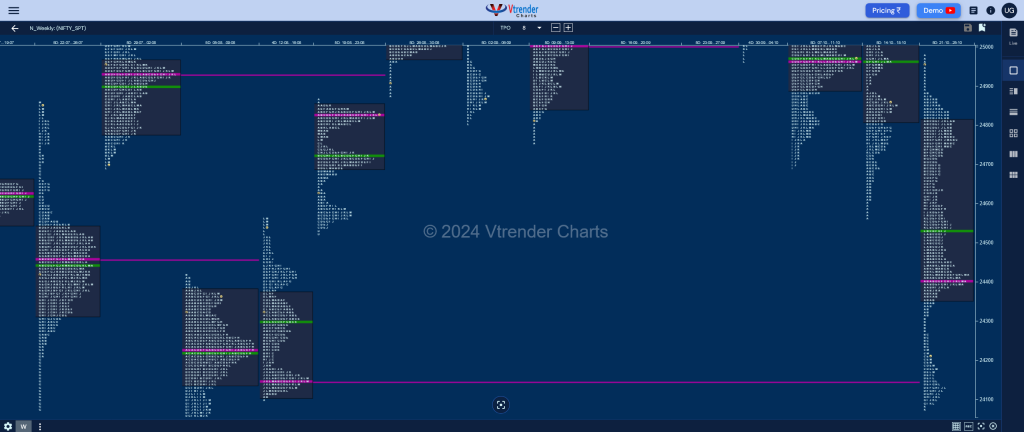
Click here to view this week’s MarketProfile of Nifty on Vtrender Charts
Hypos for 28th Oct– 24180 [ 24440 / 24073 ] – Trend (Down)
| Up |
| 24198 – M TPO h/b (25 Oct) 24257 – 25 Oct Halfback 24312 – Ext Handle (25 Oct) 24369 – Sell Tail (25 Oct) 24400 – Weekly POC 24451 – Sell Tail (24 Oct) |
| Down |
| 24171 – M TPO low (25 Oct) 24125 – POC (25 Oct) 24057 – J TPO h/b (06 Aug) 24012 – 2-day POC (05-06 Aug) 23960 – Buy tail (Aug) 23893 – Swing Low (05 Aug) |
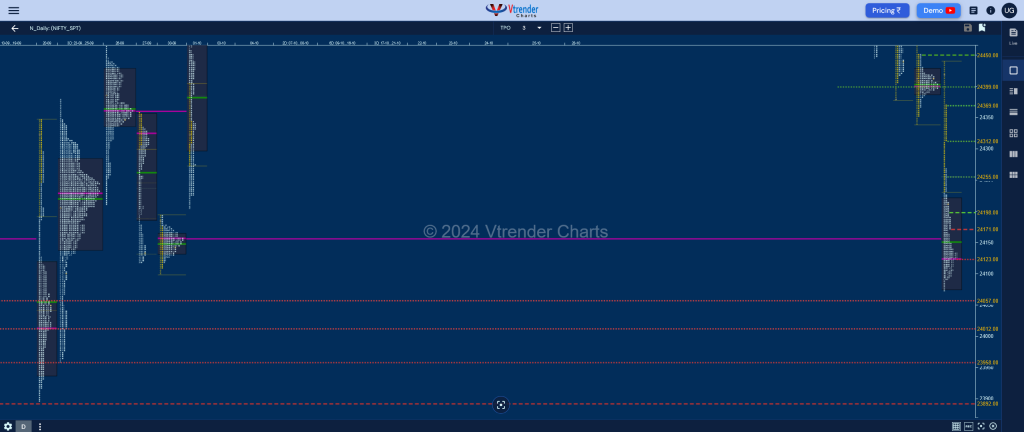
BankNifty Spot: 50787 [ 52577 / 50382 ] Trend (Down)
Previous week’s report ended with this ‘BankNifty formed a Neutral Extreme Week to the upside with overlapping to higher value at 51411-51879-52008 looking set to complete the 1 ATR objective of 52321 above which it could go for higher targets of 52566, 52818 & 53001 whereas on the downside, this week’s POC of 51879 will be the important support below which BankNifty could go for a test of 51600, 51381 & 51190‘
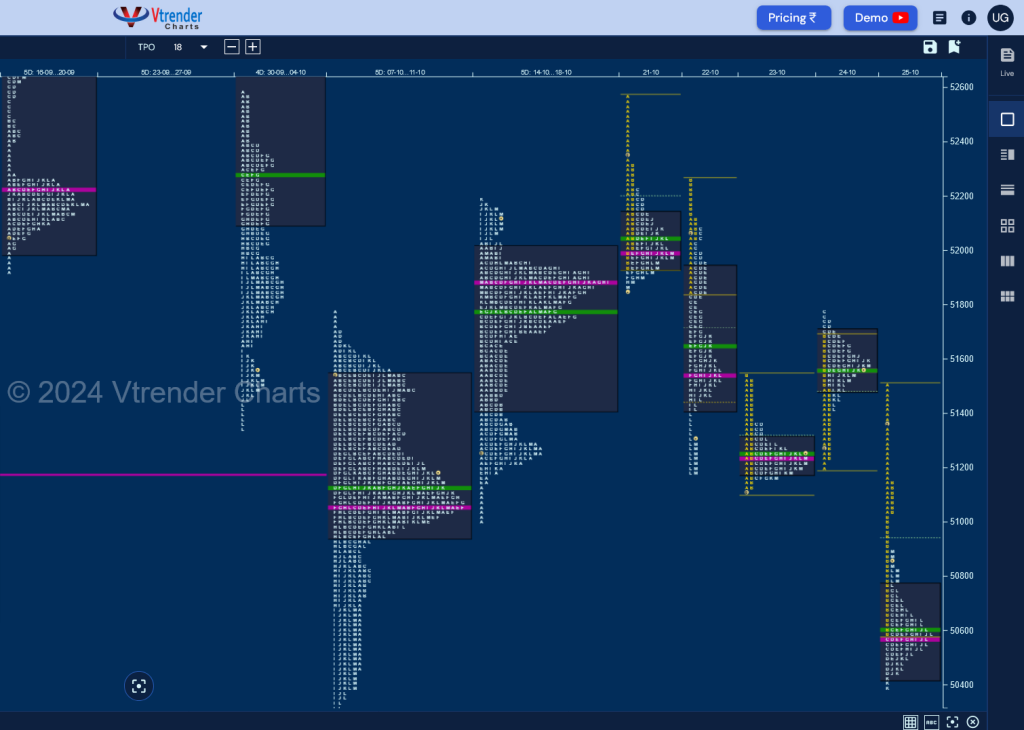
Monday – 51962 [ 52577 / 51855 ] – Normal (‘b’ shape)
Tuesday – 51257 [ 52257 / 51179 ] – Trend (Down)
Wednesday – 51239 [ 51551 / 51108 ] – Normal
Thursday – 51531 [ 51781 / 51201 ] – Normal (‘p’ shape)
Friday – 50787 [ 51501 / 50382 ] – Long Liquidation
BankNifty opened the week with a gap up not only hitting the expected objective of 52321 but went on to make a high of 52577 testing the initiative selling tail from 03rd Oct which was an important supply zone on the weekly timeframe too and could not sustain these new highs marking an Open Rejection Reverse (ORR) to the downside & forming a long liquidation ‘b’ shape profile tagging previous week’s POC of 51879 followed by more initiative selling on Tuesday where it left a selling tail in the Initial Balance and broke below 51879 decisively changing the PLR (Path of Least Resistance) to the downside and promptly swiped through the weekly value making a low of 51179 hitting the 3 lower targets as mentioned above.
The auction then took a pause forming a narrow range Normal profile on Wednesday with a prominent POC at 51236 after which the buyers made an attempt to get back with a move away on Thursday but could only manage the dreaded C side stalling at Tuesday’s halfback of 51718 forming a ‘p’ shape kind of a profile with the POC at 51566 and made yet another ORR start on Friday confirming a new Swing High at 51781 as it went on to break below the weekly FA of 51001 and forged an elongated 1119 point range long liquidation profile testing this month’s buying tail from 50466 while making a low of 50382 but saw a sharp bounce back to 50888 into the close leaving a ‘b’ shape profile with the prominent POC at 50570.
The weekly profile is a Trend one to the downside with an initiative selling tail from 52319 to 52577 and the Weekly IBL at the important level of 51879 forming outside value at both sides at 51128-51238-52067 with a late extension handle at 51030. The singles zone from 50888 to 51030 will be the immediate zone to watch on the upside above which it could go for a test of the HVNs of 51238, 51566 & 51949 whereas on the downside, a decisive break of 50570 could bring in a test of the VPOCs of 49950, 49733 & 49326 in the coming week(s)
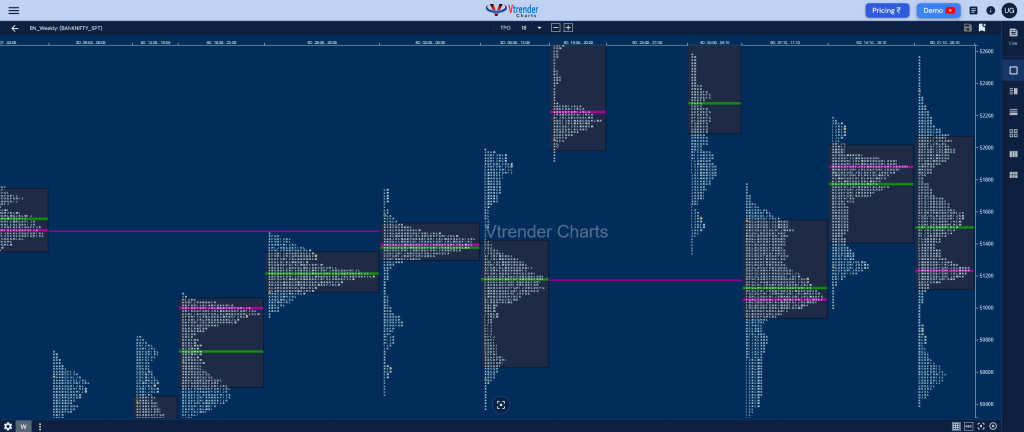
Click here to view this week’s MarketProfile of BankNifty on Vtrender Charts
Hypos for 28th Oct– 50787 [ 51501 / 50382 ] – Long Liquidation
| Up |
| 50842 – M TPO h/b (25 Oct) 50941 – 25 Oct Halfback 51030 – Ext Handle (25 Oct) 51148 – Sell Tail (25 Oct) 51265 – A TPO h/b (25 Oct) 51411 – Ext Handle (22 Oct) |
| Down |
| 50798 – M TPO low (25 Oct) 50646 – L TPO h/b (25 Oct) 50533 – SOC (25 Oct) 50442 – K TPO h/b (25 Oct) 50323 – Buy tail (07 Oct) 50194 – Swing Low (07 Oct) |
