Nifty Spot: 22420 [ 22626 / 22198 ]

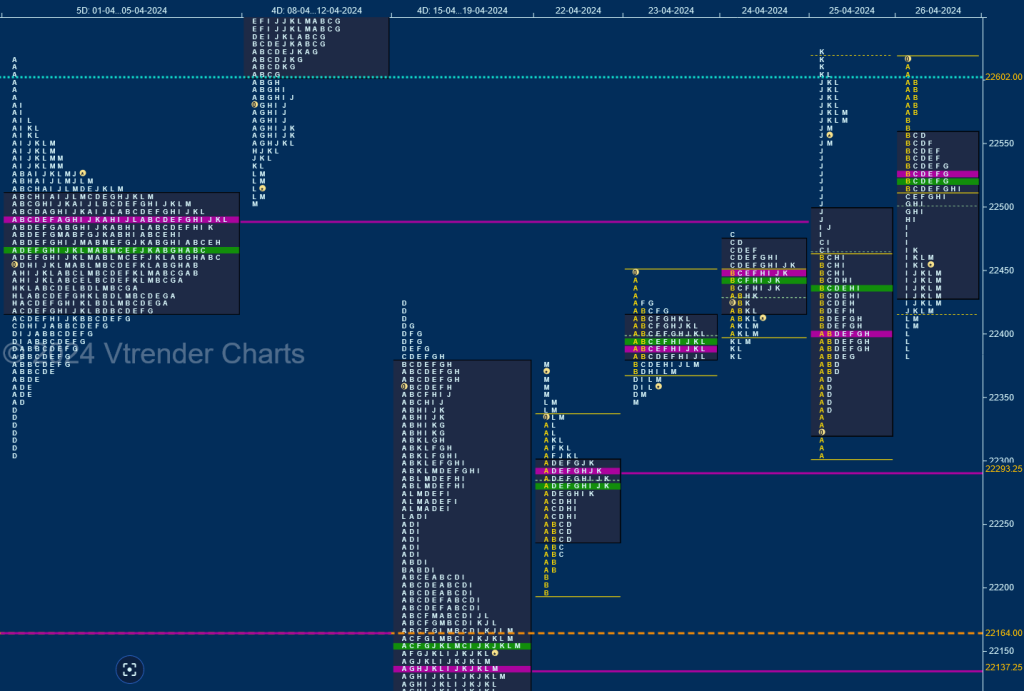
Nifty opened with a 190 point gap up on Monday but stalled just below 15th Apr’s VPOC of 22347 as it made an OH (Open=High) start at 22337 and filled up previous week’s low volumes zone taking support just above PDH of 22179 while making a low of 22198 before closing the day with a spike from 22337 to 22375 and saw yet another higher open on Tuesday but once again an OH start at 22447 as it came down to test the spike zone hitting a low of 22349 leaving a ‘b’ shape profile for the day with completely higher value with a prominent POC at 22391.
The auction stayed above this POC on Wednesday and went on to negate previous session’s A singles in the IB (Initial Balance) but made the dreaded C side extension to 22476 halting just below the weekly VPOC of 22493 and giving a retracement back to 22384 into the close forming a Neutral Day and followed it with a lower open on Thursday where it broke below the spike lows of Monday and made a low of 22305 but could not tag the VPOC of 22293 from that day showing swift rejection triggering the 80% Rule in previous 2 day’s value area zones which it completed with another typical C side move to 22475 bringing another quick retracment down to 22339.
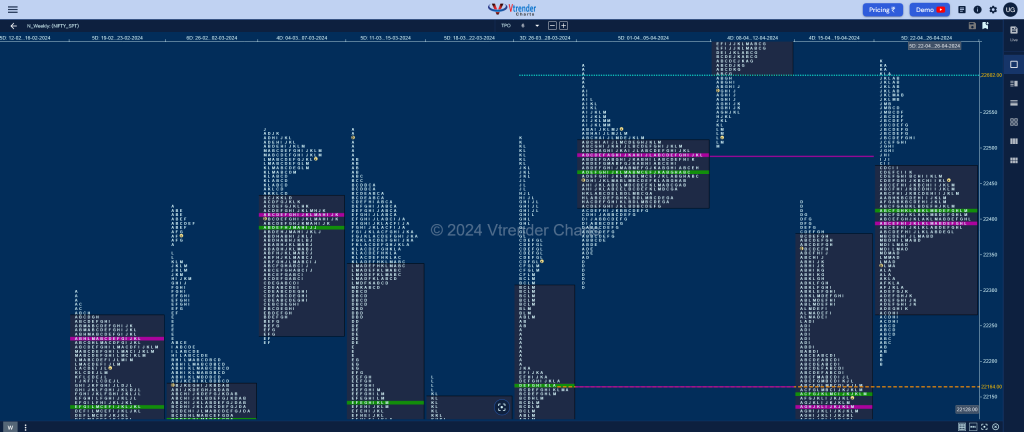
Nifty then went on to form a Double Distribution Trend Day Up after leaving an extension handle at 22485 as it made an attempt to get into the well balanced weekly Value from 08th to 12th Apr but could not sustain as it left a small responsive selling tail on Thursday and followed it with an A period selling tail confirming the end of the upside for the week which had already completed the 3 IB target of 22615 resulting in profit booking along with fresh supply coming back as it went on to close the week with a Double Distribution Trend Day Down leaving couple of important seller imprints at 22575 & 22490 while making a low of 22385. The weekly profile has formed overlapping to higher Value at 22266-22397-22475 with immediate support being at 22397 below which it could fill up the zone till Monday’s VPOC of 22293 and sustaining below which could get previous week’s prominent VPOC of 22137 into play whereas on the upside, the DD zone from 22464 to 22490 would be the first hurdle on watch above which the B period singles from 22555 to 22575 would be the higher reference.

Click here to view this week’s MarketProfile of Nifty on Vtrender Charts
Hypos for 29th Apr
| Up |
| 22435 – M TPO h/b (26 Apr) 22475 – I singles mid (26 Apr) 22524 – POC (26 Apr) 22575 – Ext Handle (26 Apr) 22619 – Monthly IBH |
| Down |
| 22408 – Buying tail (26 Apr) 22347 – Monthly IBL 22293 – VPOC (22 Apr) 22257 – PBL (22 Apr) 22212 – Buying Tail (22 Apr) |
Hypos for 30th Apr
| Up |
| 22658 – VPOC (12 Apr) 22701 – Wkly VPOC (08-12 Apr) 22755 – Selling tail (10 Apr) 22799 – 2 ATR (POC 22401) 22848 – Weekly ATR |
| Down |
| 22640 – M TPO h/b (29 Apr) 22599 – Mid-profile tail (29 Apr) 22546 – Ext Handle (29 Apr) 22500 – A TPO h/b (29 Apr) 22468 – Buy Tail (29 Apr) |
Hypos for 02nd May
| Up |
| 22611 – POC (29 Apr) 22648 – May RO point 22699 – SOC (30 Apr) 22736 – POC (30 Apr) 22780 – Sell tail (30 Apr) |
| Down |
| 22586 – M TPO h/b (30 Apr) 22546 – Ext Handle (29 Apr) 22500 – A TPO h/b (29 Apr) 22468 – Buy Tail (29 Apr) 22409 – 4-Day VPOC (23-26 Apr) |
Hypos for 03rd May
| Up |
| 22648 – May RO point 22682 – POC (02 May) 22736 – VPOC (30 Apr) 22780 – Sell tail (30 Apr) 22848 – Weekly ATR |
| Down |
| 22633 – PBL (02 May) 22586 – M TPO h/b (30 Apr) 22546 – Ext Handle (29 Apr) 22500 – A TPO h/b (29 Apr) 22457 – Apr POC |
BankNifty Spot: 48201 [ 48679 / 47628 ]

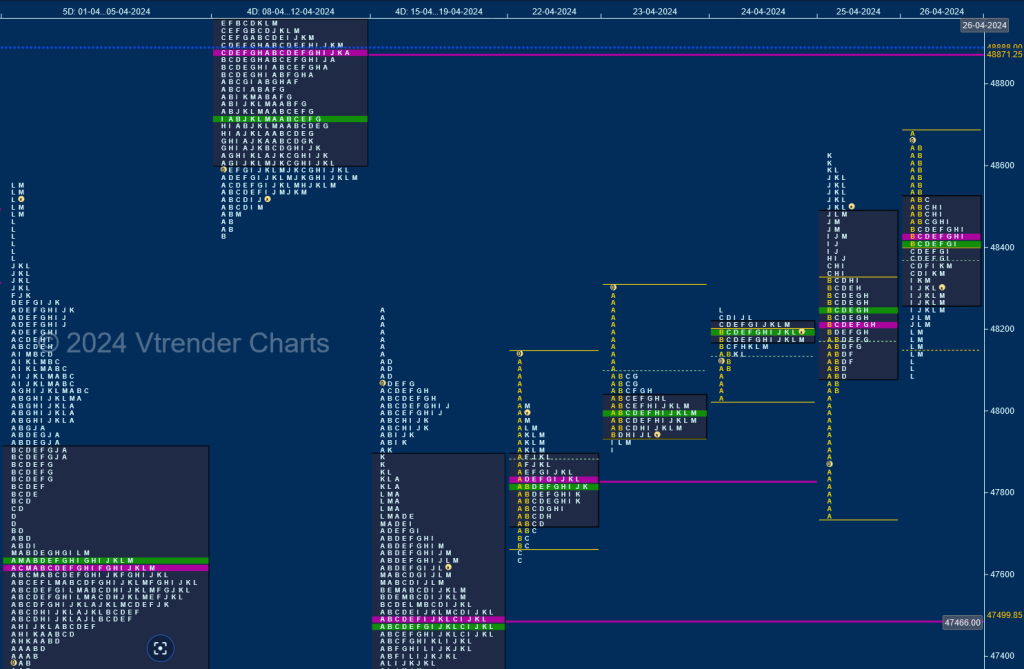
BankNifty opened with a big 571 point gap up on Monday but got rejected from previous week’s selling tail of 48119 to 48255 giving an almost OH (Open=High) start at 48146 and probed lower as it went on to close the gap zone with a C side extension to 47628 which displayed typical behaviour and held triggering a move back to 48009 into the close leaving a ‘b’ shape profile for the day with a prominent POC at 47827 and followed it up with another gap up of 374 points on Tuesday but once again left an almost OH start at 48299 stalling right below 15th Apr’s gap mid point of 48311 forming yet another ‘b’ shape profile & a Normal Day inside a narrow range of 360 points for most part of the day with a failed attempt to probe lower in the I period getting rejected right at Monday’s VAH of 47881 as it built a second prominent POC of the week at 47997.
The auction made it a hat-trick of higher opens on Wednesday allbeit on a small range of 150 points and left a small initiative buying tail from 48052 to 48028 but could not extend much on the upside leaving an inside bar and a ‘p’ shape profile within a mere range of 218 points which was the smallest in the last 5 months as it built the highest TPOs at 48200 indicating range expansion being round the corner which came in form of a big gap down of 416 points on Thursday testing the VPOCs of 47997 & 46827 from Tuesday & Monday respectively but was swiftly rejected as it left a long A TPO buying tail from 48052 to 47737 marking the return of aggressive demand who then pushed it up further to tag the 12th Apr’s VPOC of 48613 while making new highs for the week at 48625.
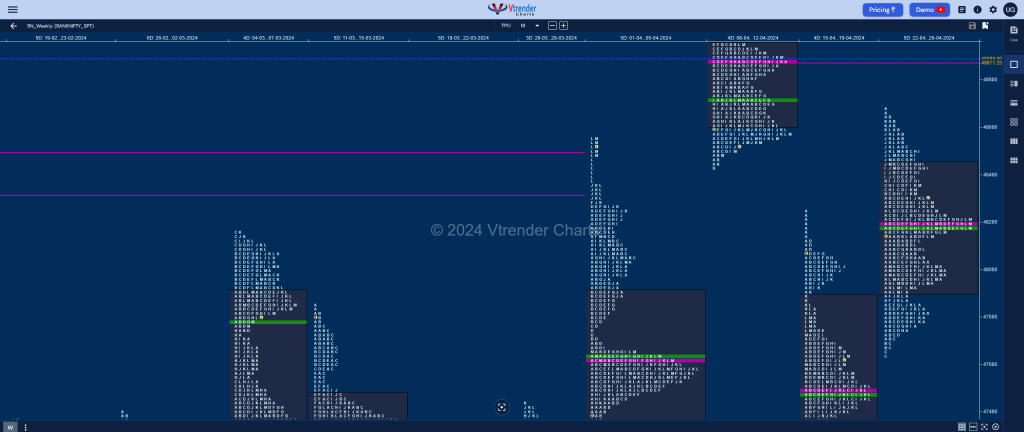
BankNifty resumed the trend of opening higher on Friday but could not sustain above the monthly SOC (Scene Of Crime) at 48669 as it made a high just below 12th Apr’s halfback of 48680 hinting that the sellers were still defending this zone resulting in a mean reversion down to the 2-day overlapping of 48200 and taking support just above Thursday’s PBL of 48087 leaving a well balanced weekly profile with completely higher Value at 47904-48200-48449 with a close right at the prominent POC of 48200 and has a good chance of giving a move away from here in the coming week with the higher weekly VPOC of 48871 being the first objective whereas on the downside, previous week’s VPOC of 47500 could come into play.

Click here to view this week’s MarketProfile of BankNifty on Vtrender Charts
Hypos for 29th Apr
| Up |
| 48249 – M TPO h/b (26 Apr) 48360 – PBH (26 Apr) 48529 – A TPO h/b (26 Apr) 48647 – Sell Tail (26 Apr) 48757 – F TPO h/b (12 Apr) 48871 – Weekly VPOC (08-12 Apr) |
| Down |
| 48146 – Buy tail (26 Apr) 47994 – Apr POC 47827 – POC (22 Apr) 47737 – PDL 47628 – FA (22 Apr) 47500 – Weekly VPOC (15-19 Apr) |
Hypos for 30th Apr
| Up |
| 49464 – M TPO high (29 Apr) 49612 – Monthly Range Tgt 49747 – 1 ATR (29 Apr h/b 49170) 49827 – Weekly ATR 49928 – Weekly 1.5 IB 50001 – 1 ATR (Prev close) |
| Down |
| 49399 – Weekly IBH 49253 – PBL (29 Apr) 49170 – T TPO h/b (29 Apr) 49031 – Ext Handle (29 Apr) 48908 – Halfback (29 Apr) 48778 – Ext Handle (29 Apr) |
Hypos for 02nd May
| Up |
| 49409 – M TPO high (30 Apr) 49529 – POC (30 Apr) 49672 – SOC (30 Apr) 49818 – SOC (30 Apr) 49953 – Selling tail (30 Apr) 50110 – 1 ATR (yPOC 49529) |
| Down |
| 49354 – Buying tail (30 Apr) 49170 – T TPO h/b (29 Apr) 49031 – Ext Handle (29 Apr) 48908 – Halfback (29 Apr) 48778 – Ext Handle (29 Apr) 48649 – C TPO h/b (29 Apr) |
Hypos for 03rd May
| Up |
| 49244 – POC (02 May) 49381 – VAH (02 May) 49529 – VPOC (30 Apr) 49672 – SOC (30 Apr) 49818 – SOC (30 Apr) |
| Down |
| 49174 – VAL (02 May) 49031 – Ext Handle (29 Apr) 48908 – Halfback (29 Apr) 48778 – Ext Handle (29 Apr) 48649 – C TPO h/b (29 Apr) |
