Nifty Spot: 19047 [ 19556 / 18837 ]
Previous week’s report ended with this ‘The weekly profile is a Neutral Extreme one to the downside which made a look up above previous week’s high and got rejected and seems to have filled up the low volume zone from previous profile forming overlapping to lower Value at 19515-19542-19758 with the POC shifting down to 19542 which will be the opening reference for the next week staying above which, the 2 daily VPOCs at 19645 & 19703 along with the HVN at 19831 would be the probable objectives on the upside whereas on the downside, this month’s buying tail from 19479 will be the immediate support break of which could trigger a probe lower towards 04th Oct’s references of 19420 (VPOC), 19369 (Scene Of Crime) & 19333 (Swing Low) and a break of which could bring in a test of the 01st Sep’s initiative buying tail from 19288‘

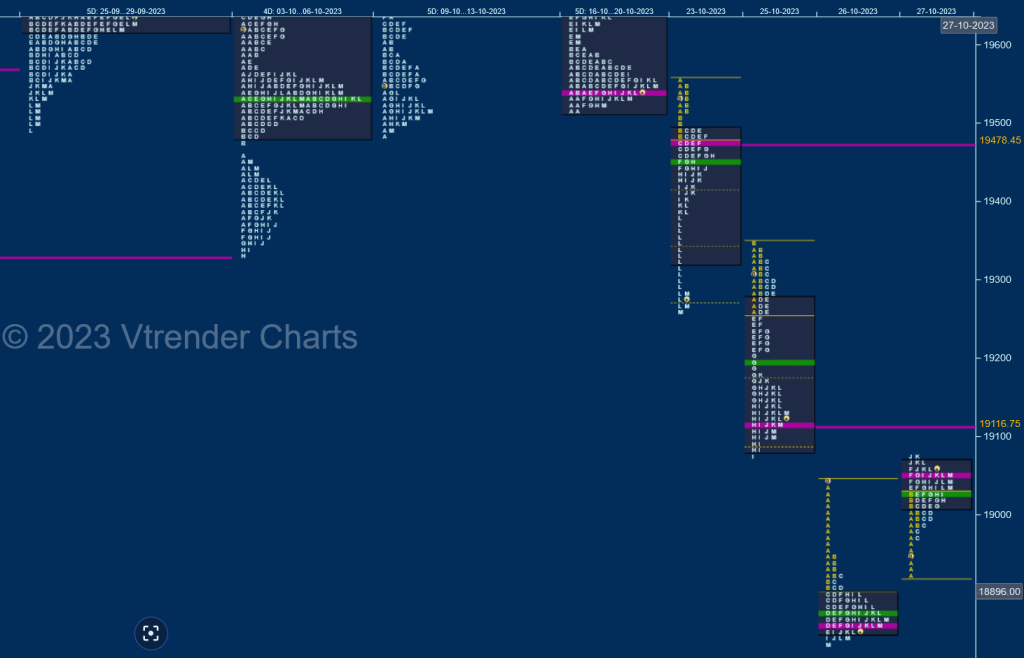
Monday
Nifty made an Open Auction start first testing previous lows followed by a probe above the weekly POC of 19542 but could only manage to hit 19566 indicating lack of demand after which it left an important extension handle 19514 in the B TPO which was the first sign of OTF (Other Time Frame) sellers coming in as they not only negated the monthly buying singles from 19479 to 19333 with the help of another set of extension handles at 19404 & 19390 but got into 01st Sep’s initiative tail from 19288 closing with a spike down to 19257 forming a Trend Day Down
Tuesday
Holiday
Wednesday
made an OAIR start as it made an attempt to fill up Monday’s spike zone from 19283 to 19390 in the Initial Balance where it made a high of 19347 but could not extend any further as the sellers came back driving the auction lower after leaving yet another extension handle at 19259 after which it negated the weekly FA of 19223 from 31st Aug and entered into the Trend Day profile of 30th Jun first out the extension handle of 19194, then tagging the VPOC of 19148 while making a low of 19074 taking support right at the buying tail of that day as it closed as a Double Distribution Trend Day Down with the POC shifting to the lower half at 19116
Thursday
Nifty continued the downside imbalance with a gap down of 95 points after which it continued to drive lower eating up the rest of the fast zone of 28th to 30th Jun as it made a low of 18908 in the IB leaving an initiative selling tail from 18949 to 19041 and went on to negate the monthly buying extension handle of 18886 while making a low of 18849 in the E TPO which marked the end of the OTF move lower and formed a balance for the rest of the day leaving a ‘b’ shape profile with a prominent POC at 18861 which did make marginal new lows of 18837 into the close taking support just above the weekly buying extension handle of 18829 (26th to 30th Jun)
Friday
A ‘b’ shape profile at new lows is not a good sign for any follow up as it indicates that the downside is getting exhausted which was seen in the higher open and a small drive up at the open as the auction got accepted in previous day’s selling singles and even went on to make few REs to the upside as it hit 19076 leaving a ‘p’ shape short covering profile with a close around the dPOC of 19050

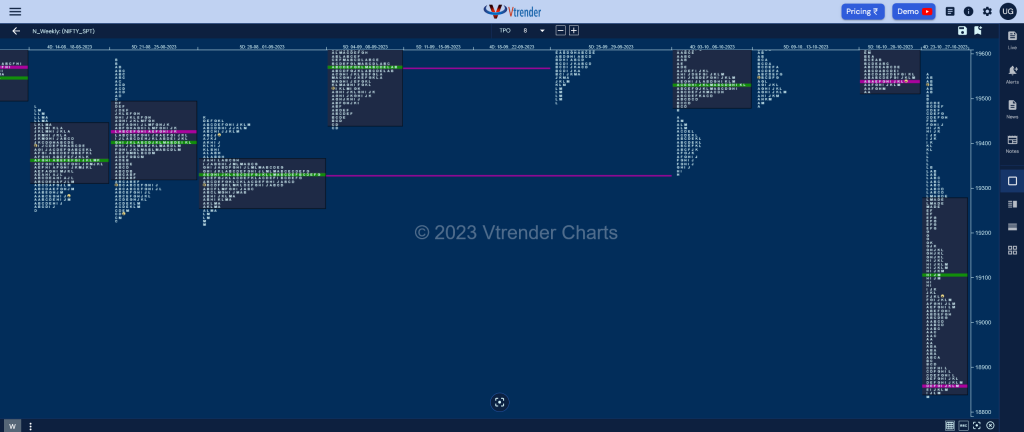
The weekly profile is an elongated Trend Down One of 719 points with multiple extension handles at 19514, 19390, 19259 & 19209 along with the immediate daily VPOC at 19116 which will be the levels to watch out for on the upside for the coming week where as on the downside, this week’s POC which has shifted down to 18861 showing that the sellers have booked profits will need to be taken out by fresh initiative activity for a probe towards the weekly VPOC of 18671 with this week’s Value being completely lower at 18840-18861-19279.
Click here to view this week’s MarketProfile of Nifty on Vtrender Charts
Hypos for the week 30th Oct to 03rd Nov 2023
| Up |
| 19076 – Mid-profile singles (Oct) 19116 – VPOC from 25 Oct 19177 – Mid-profile tail (Weekly) 19209 – Ext Handle (Weekly) 19259 – Ext Handle (Monthly) |
| Down |
| 19050 – dPOC from 27 Oct 18974 – Buying Tail (27 Oct) 18926 – Ext Handle (26 Oct) 18861 – VPOC from 26 Oct 18829 – Weekly Ext Handle (26-30 Jun) |
BankNifty Spot: 42782 [ 43831 / 42105 ]
to be updated…
