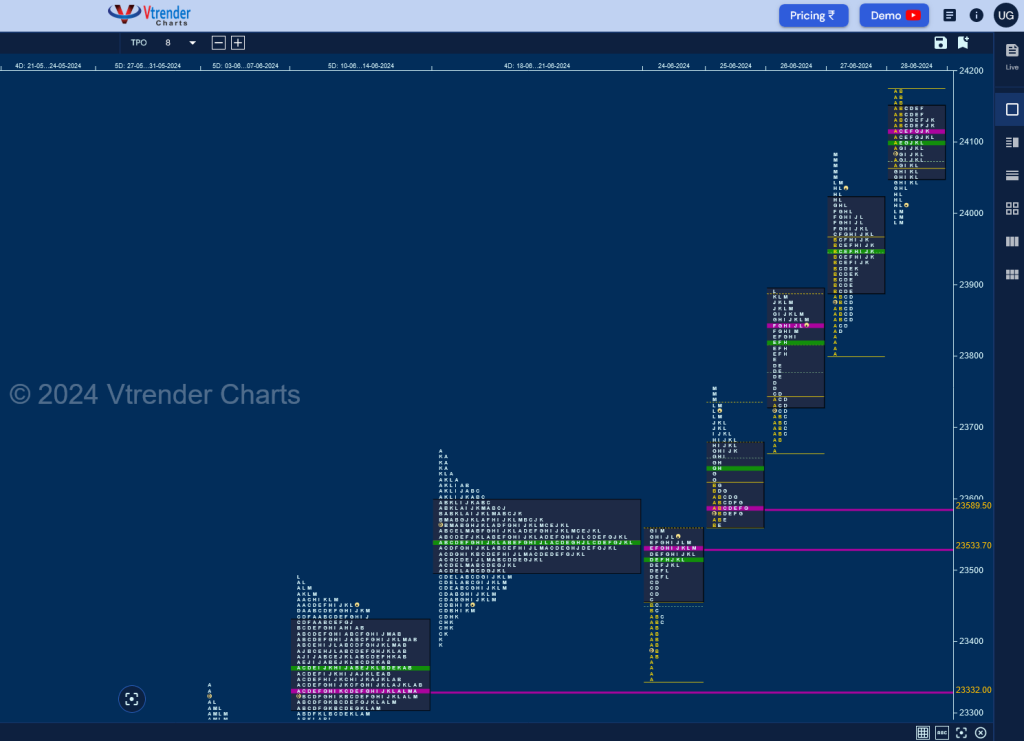
Nifty Spot: 24010 [ 24174 / 23350 ]

Monday – 23538 [ 23558 / 23350 ] – Double Distribution (Up)
Tuesday – 23721 [ 23754 / 23562 ] – Neutral Extreme (Up)
Wednesday – 23868 [ 23890 / 23670 ] – Trend Day (Up)
Thursday – 24044 [ 24087 / 23805 ] – Normal Variation (Up)
Friday – 24010 [ 24174 / 23985 ] – Normal Variation (Down)
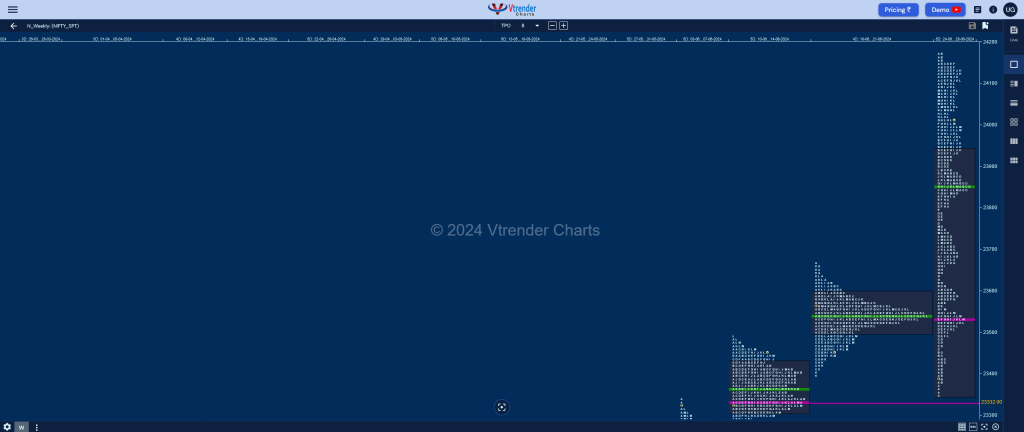
Nifty opened the week with an attempt to move away from previous balance to the downside with a lower open on Monday but took support just above the weekly VPOC of 23332 (10th-14th Jun 2024) while making a low of 23350 and got back into the weekly Value tagging the ultra-prominent POC 23538 and was further fuelled by a FA (Failed Auction) on Tuesday at 23562 triggering a trending move higher for the rest of the week as it completed the 1 ATR objective of 23938 on Thursday and looked set for the 2 ATR target of 24314 as it made a high of 24174 on Friday before closing the week at 24010 leaving a Trend Up profile in a above average range of 824 points with each day forming higher value than the previous one.

Click here to view this week’s MarketProfile of Nifty on Vtrender Charts
Hypos for 01st July – 24010 [ 24174 / 23985 ] – Normal Variation
| Up |
| 24013 – M TPO high (28 Jun) 24079 – 28 Jun Halfback 24118 – POC (28 Jun) 24171 – Sell Tail (28 Jun) 24226 – 1 ATR (24013) |
| Down |
| 23999 – M TPO h/b (28 Jun) 23950 – VPOC (27 Jun) 23887 – PBL (27 Jun) 23834 – Buy Tail (27 Jun) 23780 – 26 Jun Halfback |
Hypos for 02nd July – 24142 [ 24164 / 23992 ] – Normal Variation
| Up |
| 24144 – L TPO h/b (01 Jul) 24174 – Swing High (28 Jun) 24226 – 1 ATR (24037) 24267 – 1 ATR (24078) 24329 – 1 ATR (yPOC 24140) |
| Down |
| 24140 – POC (01 Jul) 24099 – PBL (01 Jul) 24037 – A TPO POC 23992 – Weekly IBL 23950 – VPOC (27 Jun) |
Hypos for 03rd July – 24123 [ 24236 / 24056 ] – Normal (‘b’ shape)
| Up |
| 24146 – 02 Jul Halfback 24190 – Sell Tail (02 Jul) 24236 – PDH 24263 – 1 ATR (24074) 24327 – 1 ATR (yPOC 24138) |
| Down |
| 24110 – PBL (02 Jul) 24074 – 3-day VAL (28Jun-02Jul) 24037 – A TPO POC (01 Jul) 23992 – Weekly IBL 23950 – VPOC (27 Jun) |
Hypos for 04th July – 24286 [ 24309 / 24207 ] – Normal (‘p’shape)
| Up |
| 24295 – M TPO h/b 24330 – 1 ATR (24146) 24374 – 1 ATR (24190) 24413 – 1 ATR (24229) 24465 – 1 ATR (yPOC 24281) 24498 – 1 ATR (PDH) |
| Down |
| 24281 – POC (03 Jul) 24229 – Buy Tail (03 Jul) 24190 – SOC (02 Jul) 24146 – 02 Jul H/B 24110 – PBL (02 Jul) 24075 – 3-day VAL (28Jun-02Jul) |
Hypos for 05th July – 24302 [ 24401 / 24281 ] – Normal Variation
| Up |
| 24311 – M TPO high 24341 – 04 Jul H/B 24372 – SOC (04 Jul) 24411 – 1 ATR (24229) 24463 – 1 ATR (VPOC 24281) 24517 – 1 ATR (yPOC 24335) |
| Down |
| 24281 – VPOC (03 Jul) 24229 – Buy Tail (03 Jul) 24190 – SOC (02 Jul) 24146 – 02 Jul H/B 24110 – PBL (02 Jul) 24075 – 3-day VAL (28Jun-02Jul) |
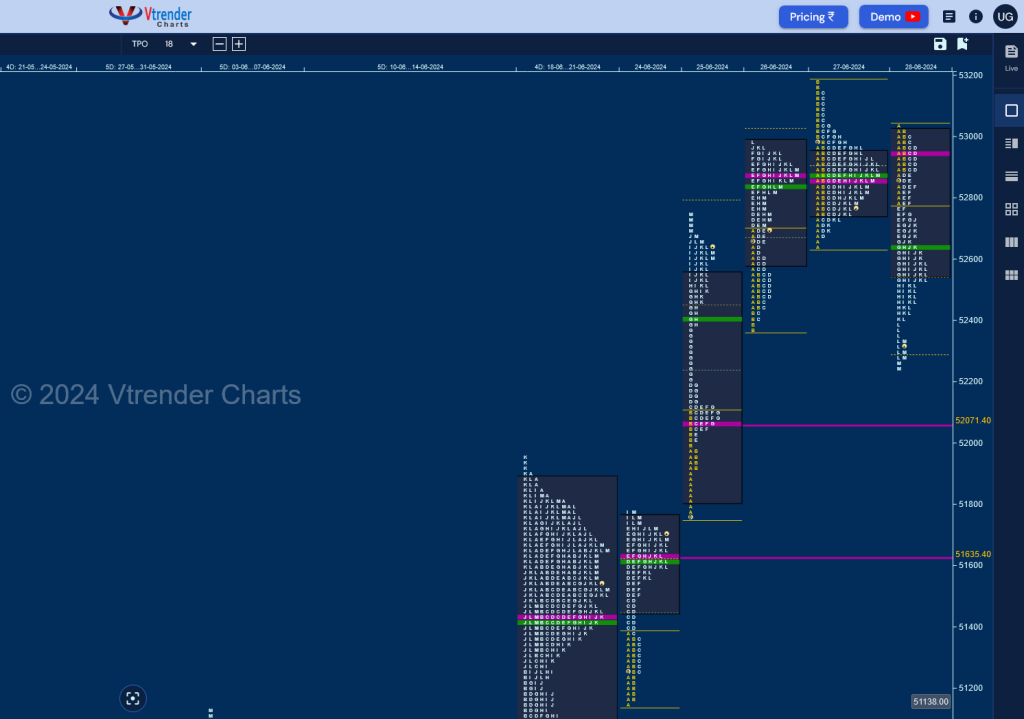
BankNifty Spot: 52342 [ 53180 / 51139 ]

Monday – 51704 [ 51784 / 51139 ] Double Distribution (Up)
Tuesday – 52606 [ 52746 / 51747 ] – Trend Day (Up)
Wednesday – 52870 [ 52988 / 52373 ] – Normal Variation (Up)
Thursday – 52811 [ 53180 / 52639 ] – Normal
Friday – 52342 [ 53030 / 52242 ] – Trend Day (Down)
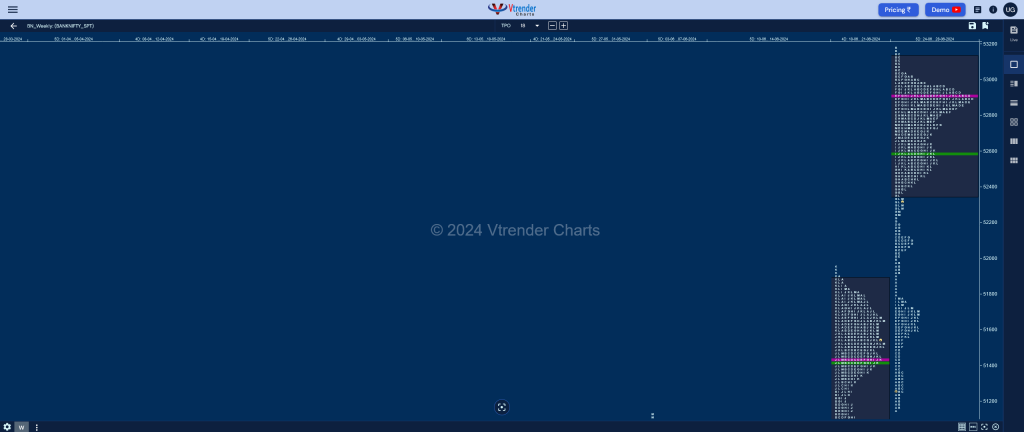
BankNifty opened the week below previous POC of 51439 and made an attempt to probe lower but took support right above the extension handle & 19th Jun’s VPOC of 51136 as it made a low of 51139 and formed reversed the PLR to the upside forming a Double Distribution Trend Day Up on Monday and followed it up with an initiative buying tail on Tuesday moving away from previous week’s Value forging a Trend Day Up of 999 points leaving a VPOC at 52071 and hitting new ATH of 52746. The auction continued to make higher highs on Wednesday & Thursday as it tagged 53180 but for the first time in the week failed to make a RE forming a nice Gaussian Curve signalling the end of the upmove as more confirmation came in form of a Trend Day Down on Friday as it dropped back lower to 52242 leaving a 3-day balance to close the week leaving yet another composite ‘p’ shape with the POC at 52904 and completely higher Value at 52358-52904-53125.

Click here to view this week’s MarketProfile of BankNifty on Vtrender Charts
Hypos for 01st July – 52342 [ 53030 / 52242 ] – Trend Day
| Up |
| 52407 – Ext Handle (28 Jun) 52620 – 3-day VAL (26-28 Jun) 52784 – SOC (28 Jun) 52904 – Weekly POC 53013 – 3-day VAH (26-28 Jun) 53136 – Sell tail (27 Jun) |
| Down |
| 52279 – Buy tail (28 Jun) 52188 – Ext Handle (25 Jun) 52071 – VPOC (25 Jun) 51957 – Daily Ext Handle 51784 – Ext Handle (25 Jun) 51635 – VPOC (24 Jun) |
Hypos for 02nd July – 52574 [ 52656 / 52166 ] Normal (p shape)
| Up |
| 52621 – VAH (01 Jul) 52784 – SOC (28 Jun) 52904 – Weekly POC 53013 – 3-day VAH (26-28 Jun) 53136 – Sell tail (27 Jun) 53220 – 1 ATR (yPOC 52558) |
| Down |
| 52558 – POC (01 Jul) 52448 – VAL (01 Jul) 52338 – Buy Tail )01 Jul) 52252 – IB tail mid 52071 – VPOC (25 Jun) 51957 – Daily Ext Handle |
Hypos for 03rd July – 52168 [ 52828 / 51996 ] – Normal (b shape)
| Up |
| 52166 – Weekly IBL 52251 – PBH (02 Jul) 52412 – Sell Tail (02 Jul) 52558 – POC (01 Jul) 52656 – 01 Jul high 52828 – PDH |
| Down |
| 52160 – POC (02 Jul) 52057 – Buy tail (02 Jul) 51957 – Daily Ext Handle 51784 – Ext Handle (25 Jun) 51635 – VPOC (24 Jun) 51460 – 24 Jun H/B |
Hypos for 04th July – 53089 [ 53256 / 52482 ] – Normal (p shape)
| Up |
| 53111 – Weekly 2 IB 53256 – ATH (03 Jul) 53422 – 1 ATR (52724) 53620 – 1 ATR (WFA 51996) 53782 – 1 ATR (yPOC 53084) |
| Down |
| 53054 – VAL (03 Jul) 52879 – 03 Jul Halfback 52724 – IB tail mid (03 Jul) 52558 – POC (01 Jul) 52412 – 02 Jul Halfback |
Hypos for 05th July – 3103 [ 53357 / 52816 ] – Normal Variation (b shape)
| Up |
| 53123 – M TPO high 53256 – Jul Sell tail 53357 – ATH (04 Jul) 53422 – 1 ATR (52724) 53620 – 1 ATR (WFA 51996) 53798 – 1 ATR (2D_POC 53100) |
| Down |
| 53100 – 2-day POC (03-04 Jul) 52989 – 2-day VAL (03-04 Jul) 52863 – Buy tail (04 Jul) 52724 – IB tail mid (03 Jul) 52558 – POC (01 Jul) 52412 – 02 Jul Halfback |
