Nifty Spot: 22327 [ 22516 / 21947 ]

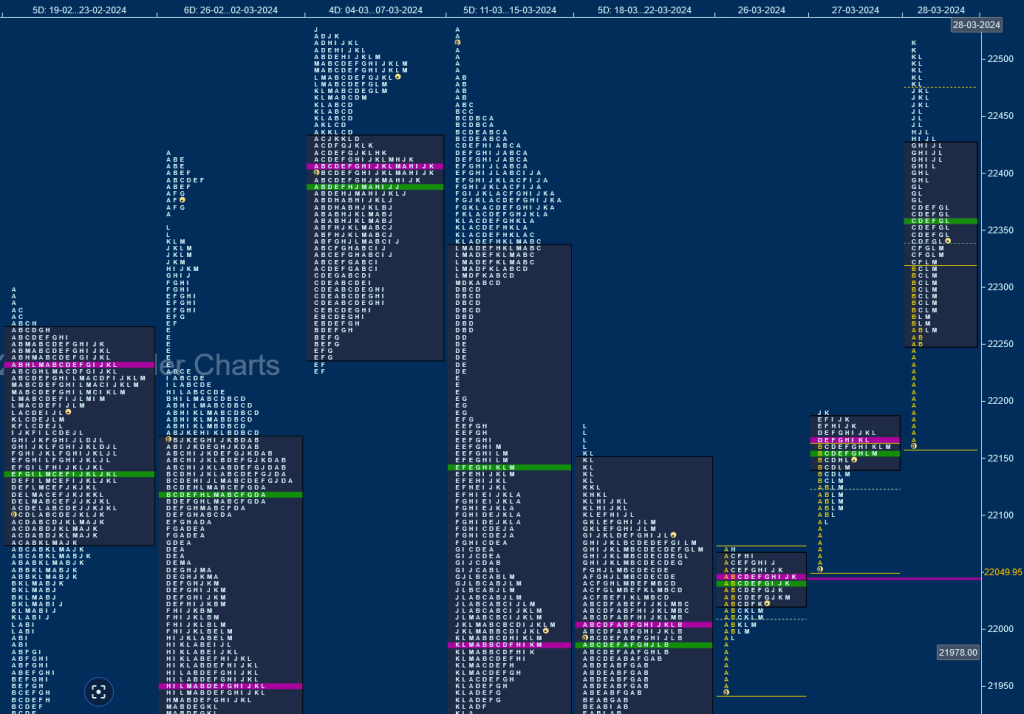
Nifty opened the week with a narrow 126 point range Normal Day and a ‘p’ shape profile leaving an important A period buying tail at the weekly POC of 22002 indicating that the PLR (Path of Least Resistance) was to the upside though it got stalled at the HVN of 22068 forming a prominent POC at 22050 and confirmed yet another A period buying tail on Wednesday from 22106 to 22052 as it went on to probe above previous week’s high but recorded similar highs of 22193 & 22191 leaving a second successive Normal Day and a ‘p’ shape profile with the prominent POC at 22166.
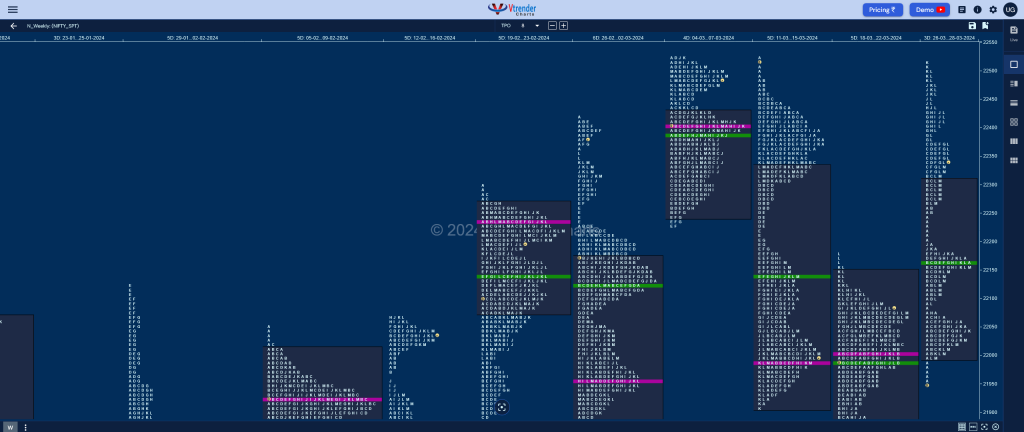
The auction then gave an Open Drive Up on Thursday making it a hat-trick of A period singles and the biggest of all from 22252 to 22163 negating the weekly extension handle of 22224 (11-15 Mar) as it no only climbed above the TPO HVN of 22376 but went on to test the initiative weekly selling tail from 22486 to 22526 as it hit 22516 but saw supply coming back in this zone triggering a quick long liquidation break in the L TPO back to 22265 before closing at 22327 leaving a Triple Distribution Trend Up weekly profile with overlapping to higher Value at 21992-22166-22306. Nifty will need to get back above Thursday’s POC of 22360 for buyer to get back in control for a move towards new ATH in the coming week whereas on the downside, the buying tail from 22252 will be the immediate support below which it could go for a test of the daily POCs of 22166 & 22050.

Click here to view this week’s MarketProfile of Nifty on Vtrender Charts
Hypos for 01st Apr
| Up |
| 22339 – 28 Mar halfback 22376 – SOC (28 Mar) 22444 – J TPO h/b (28 Mar) 22503 – Selling tail (28 Mar) 22573 – 1 ATR (POC 22360) |
| Down |
| 22304 – M TPO h/b (28 Mar) 22263 – Ext Handle (28 Mar) 22213 – A TPO h/b (28 Mar) 22166 – Weekly POC 22093 – Buying Tail (27 Mar) |
Hypos for 03rd Apr
| Up |
| 22483 – Selling Tail (02 Apr) 22524 – Selling Tail (01 Apr) 22573 – 1 ATR (POC 22360) 22632 – Weekly 2 IB 22681 – 1 ATR (POC 22460) |
| Down |
| 22423 – POC (02 Apr) 22360 – VPOC (28 Mar) 22304 – M TPO h/b (28 Mar) 22263 – Ext Handle (28 Mar) 22213 – A TPO h/b (28 Mar) |
Hypos for 04th Apr
| Up |
| 22450 – POC (03 Apr) 22485 – 3-day VAH (01-03 Apr) 22524 – Selling Tail (01 Apr) 22573 – 1 ATR (POC 22360) 22632 – Weekly 2 IB 22681 – 1 ATR (POC 22460) |
| Down |
| 22414 – 3-day VAL (01-03 Apr) 22362 – Buying Tail (03 Apr) 22304 – M TPO h/b (28 Mar) 22263 – Ext Handle (28 Mar) 22213 – A TPO h/b (28 Mar) 22166 – Weekly POC |
Hypos for 05th Apr
| Up |
| 22530 – M TPO h/b (04 Apr) 22580 – Selling Tail (04 Apr) 22632 – Weekly 2 IB 22681 – 1 ATR (HVN 22460) 22734 – Weekly 3 IB 22770 – 1 ATR (yPOC 22544) |
| Down |
| 22508 – 4-day VAH (01-04 Apr) 22461 – 04 Apr halfback 22406 – 4-day VAL (01-04 Apr) 22350 – Buying Tail (04 Apr) 22304 – M TPO h/b (28 Mar) 22263 – Ext Handle (28 Mar) |
BankNifty Spot: 47124 [ 47440 / 46529 ]

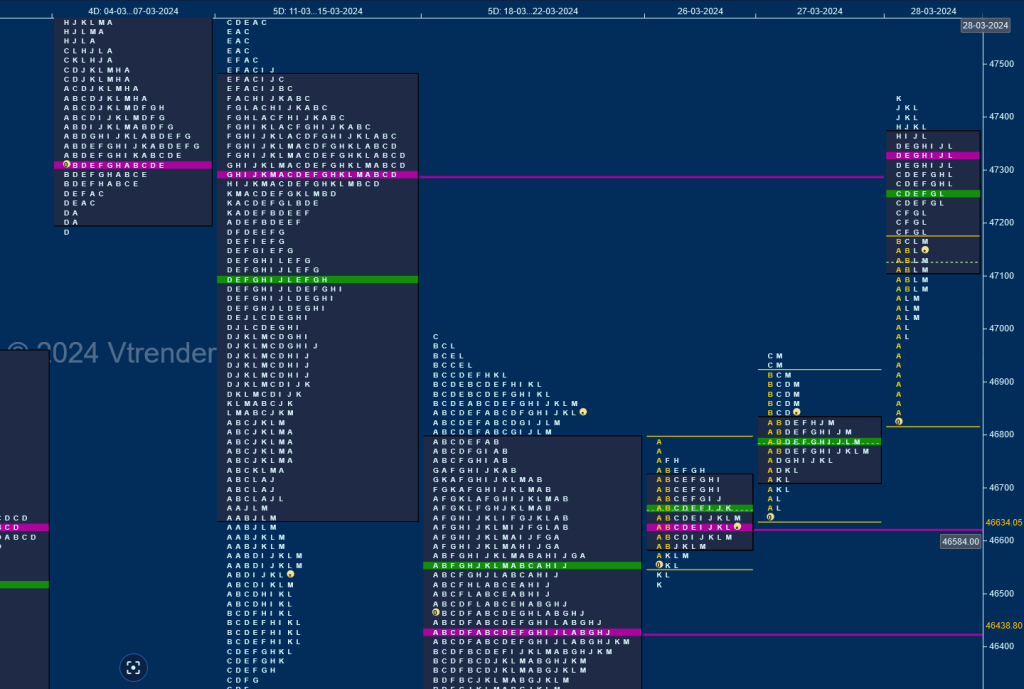
BankNifty opened the week with an uncharacteristic Non-Trend Day in a range of just 259 points as it filled up the upper part of previous week’s profile making a look down below last Friday’s low of 46566 but only managed to tag 46529 forming a nice Gaussian Curve with a prominent POC at 46634 and gave a move away to the upside from this POC on Wednesday in the Initial Balance leaving an A period buying tail from 46769 to 46643 but made the dreaded C side extension to 46946 stalling just below the FA of 46990 (21 Mar) triggering a retracement down to 46671 where it once again took support just above 46634 and made a sharp bounce back to 46956 into the close.
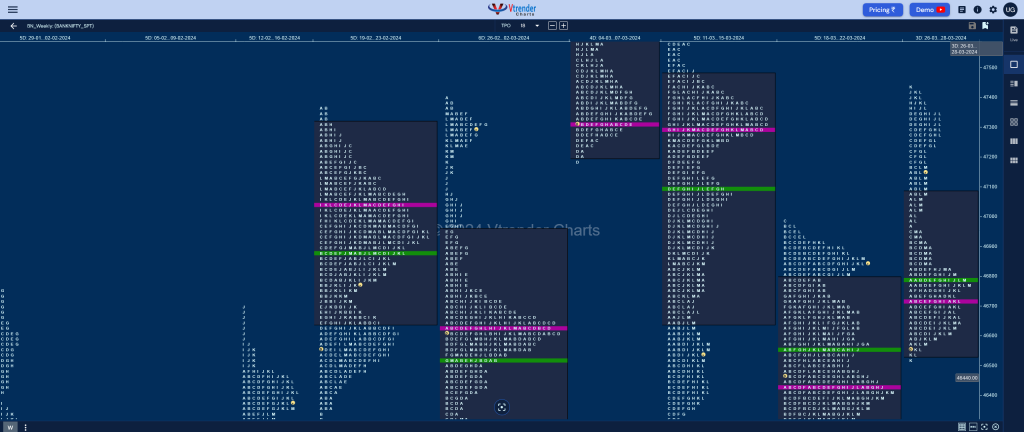
The auction then made an Open Drive Up on Thursday with an OL (Open=Low) start at 46827 well above the prominent yPOC of 46788 as it went on to negate the FA of 46990 with an A period buying tail till 47087 and followed it up with a big C side extension tagging the weekly VPOC of 47300 (11-15 Mar) after which it began to show signs of exhaustion as made marignal new REs upto 47440 in the K before making a sharp move lower forcing out the laggard longs getting into the A period singles and leaving a PBL at 46997 taking support just above the negated FA of 46990 before closing the week at 47124 leaving a Neutral Extreme profile up which also represents a Double Distribution with overlapping to higher Value at 46534-46713-47084 with a small zone of singles from 46997 to 46954.

Click here to view this week’s MarketProfile of BankNifty on Vtrender Charts
Hypos for 01st Apr
| Up |
| 47134 – 28 Mar halfback 47263 – G TPO POC (28 Mar) 47377 – SOC (28 Mar) 47468 – FA (13 Mar) 47577 – SOC (12 Mar) 47710 – 1 ATR |
| Down |
| 47098 – M TPO h/b (28 Mar) 46988 – A TPO h/b (28 Mar) 46851 – 4-day VAH (21-27 Mar) 46710 – 4-day VPOC (21-27 Mar) 46634 – VPOC (26 Mar) 46529 – Swing Low (26 Mar) |
Hypos for 05th Apr
| Up |
| 48089 – M TPO h/b (04 Apr) 48145 – Selling Tail (04 Apr) 48254 – Monthly IBH 48381 – Jan Sell tail 48492 – Weekly VPOC (26-29 Dec) 48614 – Selling tail (28 Dec) |
| Down |
| 48039 – M TPO low (04 Apr) 47945 – G TPO h/b (04 Apr) 47869 – POC (04 Apr) 47769 – Buy tail (04 Apr) 47630 – 3-day VAH (01-03 Apr) 47507 – 3-day VAL (01-03 Apr) |
