Nifty Spot: 22378 [ 22419 / 21860 ]

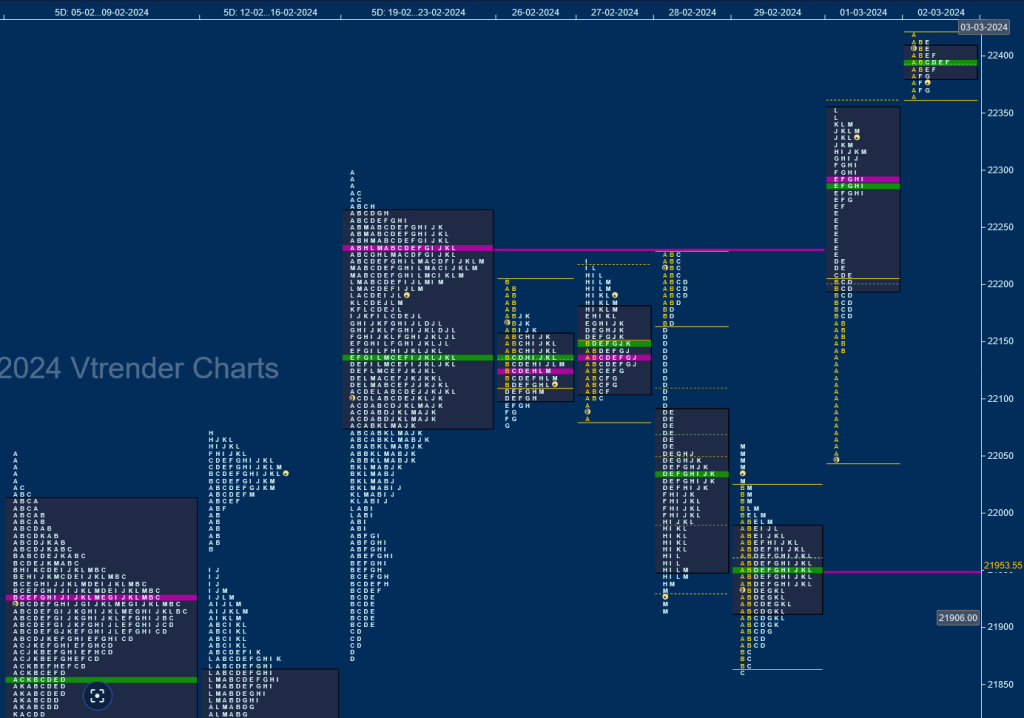
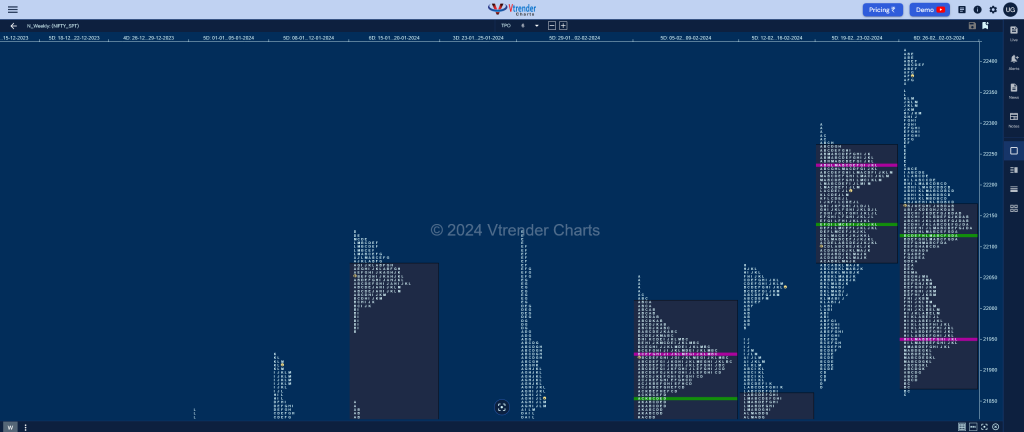
Nifty continued to build on previous week’s balanced profile and Value for the first 2 days forming a nice 2-day composite with a prominent POC at 22125 and made an attempt to probe higher on Wednesday but could only manage to leave similar highs just below previous week’s POC of 22232 and this lack of demand brought in initiaitve sellers causing a trending move lower to 21860 on Thursday where it tagged the daily VPOC from 15th Feb and confirmed a FA (Failed Auction) marking the end of the downside for the week.
The auction then made an Open Drive Up on Friday leaving an initiative buying tail and a Trend Day Up hitting new ATH of 22353 and continued this imbalance in the special session on Saturday where it tagged 22419 leaving an Outside Week & a Neutral Extreme profile to the upside though Value formed was overlapping to lower at 21873-21953-22168. Nifty has left buying extensions at 22229 & 22297 which will be the immediate support levels going forward with the main one being the buying tail from 22145 to 21982 whereas on the upside, getting accepted above 22395 can bring in higher levels of 22750.

Click here to view this week’s MarketProfile of Nifty on Vtrender Charts
Weekly Hypos
| Up |
| 22395 – dPOC (02 Mar) 22438 – 1 ATR (EH 22222) 22506 – 1 ATR (VPOC 22290) 22611 – 1 ATR (yPOC 22395) 22652 – Weekly ATR (HVN 22125) 22750 – 1 ATR (WFA 22229) |
| Down |
| 22343 – Closing tail (01 Mar) 22290 – VPOC (01 Mar) 22229 – Weekly Ext Handle 22145 – Buying Tail (01 Mar) 22096 – IB singles mid (01 Mar) 22022 – IBH (29 Feb) |
BankNifty Spot: 47297 [ 47433 / 45661 ]

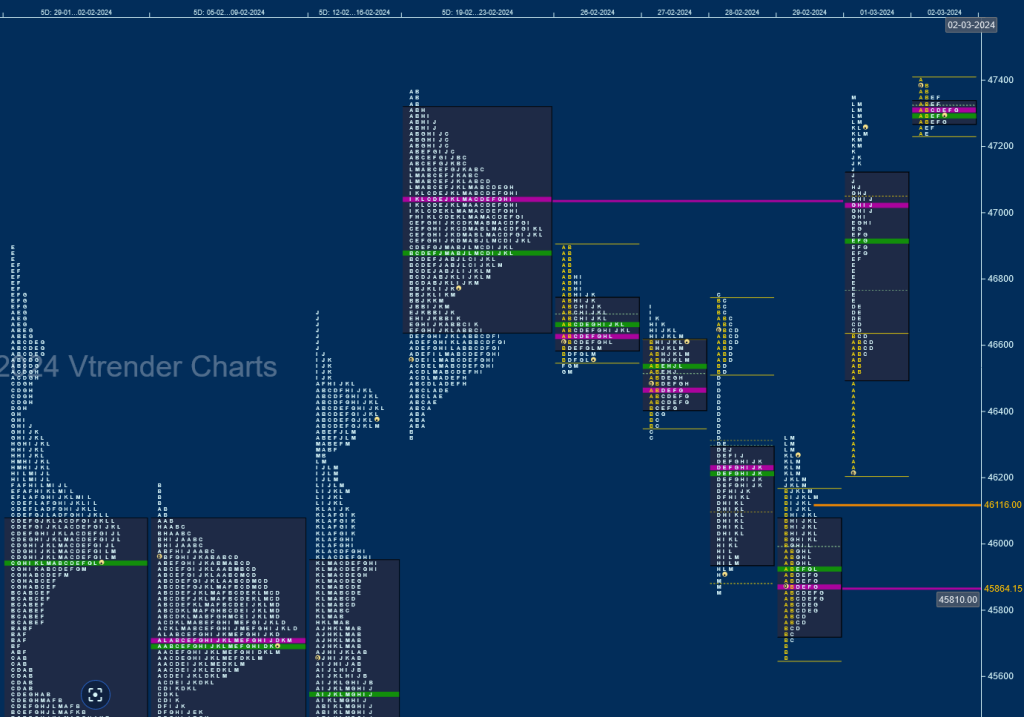
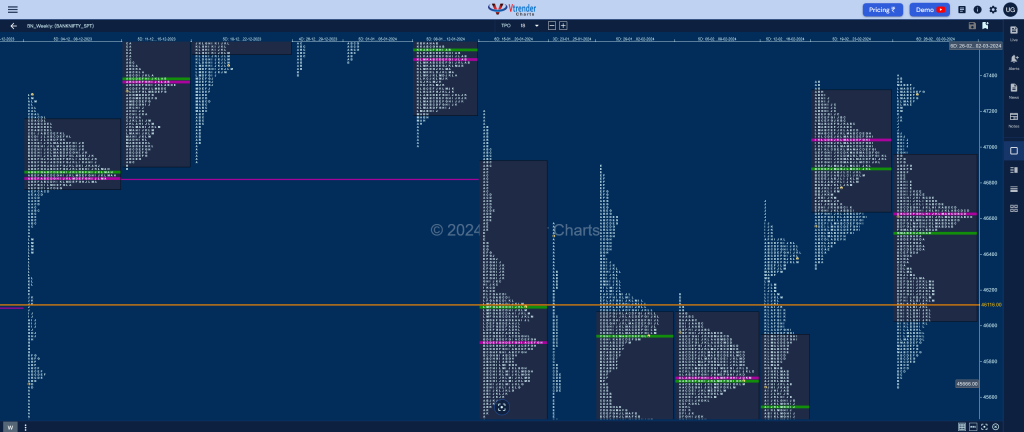
BankNifty started with a Normal Day and a Gaussian Curve on Monday filling up previous week’s low volume zone between 46910 & 46580 as it made a high of 46893 & similar lows at 46526 & 46513 which were repaied on Tuesday as it made new lows for the week at 46324 but came via the dreaded C side extension taking support right above previous week’s low of 46317 and confirming a FA (Failed Auction) at lows triggering a bounce back to 46731 in the IB (Initial Balance) on Wednesday but made yet another typical C side move to 46754 which was swiftly rejected resulting in a new FA at highs and a fresh imbalance lower till the B period of Thursday where it completed the 2 ATR objective of 45758 from 23rd Feb’s FA of 47245 while making a low of 45661.
The auction however left a small but important buying tail at the close of the IB on Thursday which not only marked the lows of the week but gave a good ground for the buyers to come back which they did with an open drive up on Friday which was the first day of March resulting in a Trend Up profile which negated both the FAs of 46754 & 47245 as it hit 47342 and continued this imbalance in the special session held on 02nd Mar where it made a high of 47433. The weekly profile is a Neutral Extreme one to the upside with overlapping to lower Value at 46097-46622-46879 and has left couple of extension handles at 47082 & 47174 which will be the immediate support levels for the coming week along with the lower swing references staying at this week’s POC of 46622 and Feb series VWAP of 46119 whereas on the upside, BankNifty is looking good to test the weekly VPOCs of 48312 & 48492 provided it can sustain above 47308.

Click here to view this week’s MarketProfile of BankNifty on Vtrender Charts
Weekly Hypos
| Up |
| 47308 – dPOC (02 Mar) 47463 – 1 ATR (FA 46754) 47586 – Ext Handle (12 Jan) 47729 – VPOC (12 Jan) 47850 – Monthly HVN (Jan 2024) 48119 – Monthly VPOC (16 Jan) |
| Down |
| 47279 – VAL (02 Mar) 47174 – Ext Handle (01 Mar) 47029 – VPOC (01 Mar) 46869 – Mid-profile singles 46726 – Ext Handle (01 Mar) 46526 – Buying Tail (01 Mar) |
