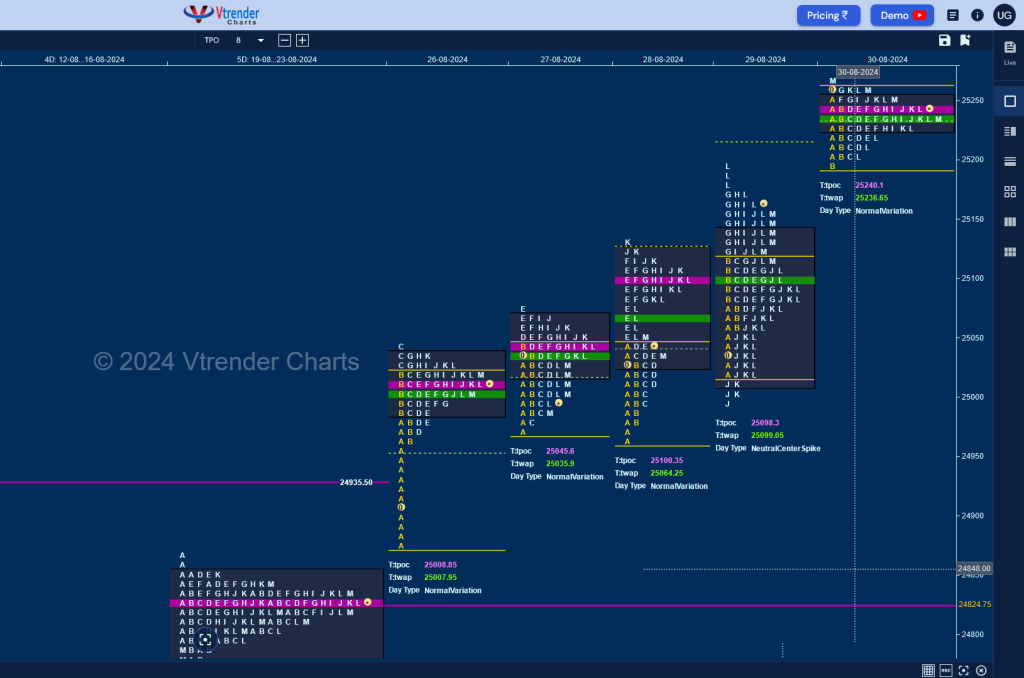
Nifty Spot: 25236 [ 25268 / 24874 ] Double Distribution (Up)
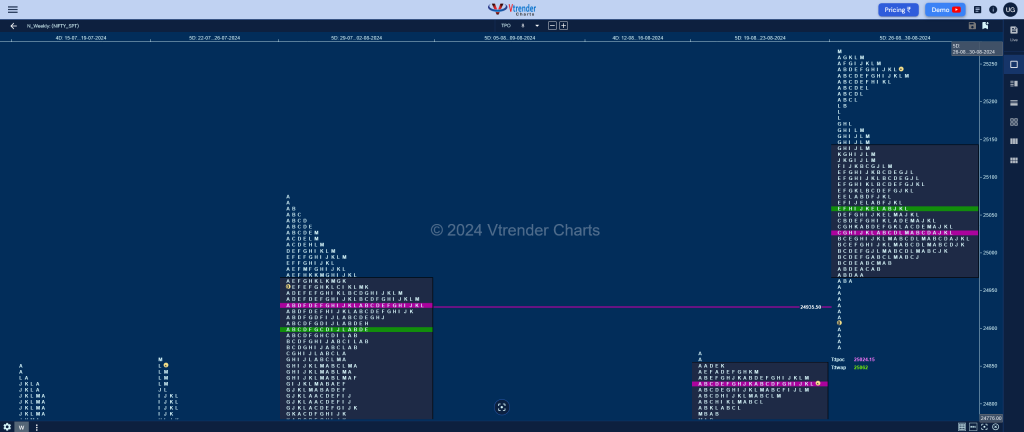
Previous week’s report ended with this ‘The weekly profile is a Triple Distribution one to the upside with completely higher Value at 24689-24824-24853 with the lower HVNs being at 24722 & 24581 and the next week’s auction will be bullish as long as it stays above 24824 for a probe to the VPOCs of 24935 & 24987 as immediate objectives whereas on the downside, 24754 will be the first support below which Nifty can go for a test of that buying tail from 24654‘

Monday – 25010 [ 25043 / 24878 ] – Normal (‘p’ profile)
Tuesday – 25017 [ 25073 / 24973 ] – Normal Variation (Up)
Wednesday – 25052 [ 25129 / 24964 ] – Double Distribution (Up)
Thursday – 25152 [ 25193 / 24998 ] Neutral Extreme (Up)
Friday – 25236 [ 25268 / 25199 ] – Normal
Nifty opened the week with an A period buying tail on Monday from 24964 to 24874 confirming that the imbalance to the upside would continue and went on to leave couple of more small but important A period tails on Tuesday & Wednesday forming higher highs even scaling previous ATH of 25078 as it tagged 25129 but value was overlapping which suggested a return to balance with a prominent 3-day POC at 25024.
The auction made an attempt to move away from this POC with another A period buying tail on Thursday where it went on to hit new ATH of 25174 in the G TPO but saw a long liquidation break triggering a Range Extension to the downside for the first time in the week which however was swiftly rejection resulting in a FA (Failed Auction) being confirmed at 24998 and a Neutral Extreme higher to 25193 into the close which was followed by an expected gap up open on Friday but got back into balance more for the rest of the day forming a narrow 69 point range Normal profile with a close around the ultra prominent POC of 25240.
The weekly profile was shaping up to be a composite ‘p’ shape one over the first 3 days but has turned into a Double Distribution Trend Up one with an initiative buying tail from 24964 to 24867 along with completely higher Value at 24970-25024-25136 with the DD extension handle at 25174 with the upper HVN at 25240 which will be the immediate reference for the coming week and staying above it can expect the probe to continue towards 25332 & 25490 in the Bappa week.

Click here to view this week’s MarketProfile of Nifty on Vtrender Charts
Hypos for 02nd Sep – 25236 [ 25268 / 25199 ] – Normal
| Up |
| 25240 – POC (30 Aug) 25283 – 1 ATR (EH 25129) 25332 – 2 ATR (FA 24998) 25394 – 1 ATR (yPOC 25240) 25432 – 2 ATR (yPOC 25098) 25490 – Monthly ATR (24323) |
| Down |
| 25225 – VAL (30 Aug) 25174 – Weekly Ext Handle 25129 – Monthly Ext Handle 25098 – POC (29 Aug) 25045 – SOC (29 Aug) 24998 – FA (29 Aug) |
Hypos for 03rd Sep – 25278 [ 2533 / 25235 ] – Normal Variation (Down)
| Up |
| 25290 – PBH (02 Sep) 25333 – Weekly IBH 25383 – Weekly 1.5 IB 25448 – 1 ATR (yPOC 25294) 25490 – Monthly ATR (24323) 25530 – Weekly 3 IB |
| Down |
| 25270 – RO point 25235 – Weekly IBL 25174 – Weekly Ext Handle 25129 – Monthly Ext Handle 25098 – POC (29 Aug) 25045 – SOC (29 Aug) |
Hypos for 04th Sep – 25279 [ 25321 / 25235 ] – Normal (Inside Bar)
| Up |
| 25287 – L TPO h/b (03 Sep) 25333 – Weekly IBH 25383 – Weekly 1.5 IB 25432 – Weekly 2 IB 25490 – Monthly ATR (24323) 25530 – Weekly 3 IB |
| Down |
| 25276 – VAH (03 Sep) 25235 – Weekly IBL 25174 – Weekly Ext Handle 25129 – Monthly Ext Handle 25098 – POC (29 Aug) 25045 – SOC (29 Aug) |
Hypos for 05th Sep – 25198 [ 25216 / 25083 ] – Normal Variation (Up)
| Up |
| 25211 – Sell tail (04 Sep) 25250 – 2-day VAL (02-03 Sep) 25292 – 2-day VAH (02-03 Sep) 25333 – Weekly IBH 25383 – Weekly 1.5 IB 25432 – Weekly 2 IB |
| Down |
| 25192 – Spike low (04 Sep) 25145 – PBL (04 Sep) 25089 – Buy Tail (04 Sep) 25045 – SOC (29 Aug) 24998 – FA (29 Aug) 24940 – Prev Week Range |
Hypos for 06th Sep – 25145 [ 25275 / 25127 ] Normal Variation (Down)
| Up |
| 25152 – M TPO h/b 25199 – 05 Sep H/B 25250 – 2-day VAL (02-03 Sep) 25292 – 2-day VAH (02-03 Sep) 25333 – Weekly IBH 25383 – Weekly 1.5 IB |
| Down |
| 25136 – POC (04 Sep) 25089 – Buy Tail (04 Sep) 25045 – SOC (29 Aug) 24998 – FA (29 Aug) 24959 – Monthly 1.5 IB 24929 – A TPO h/b (26 Aug) |
BankNifty Spot: 51351 [ 51466 / 50938 ] Neutral (Gaussian Curve)
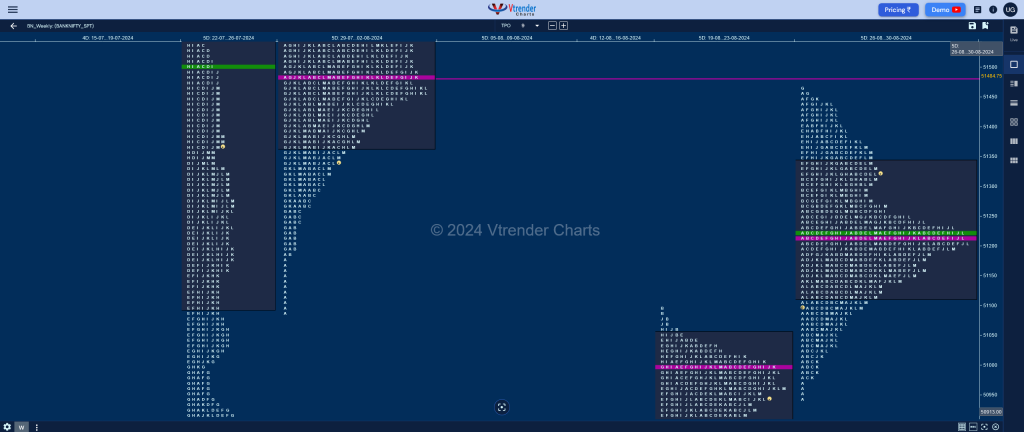
Previous week’s report ended with this ‘The weekly profile is a Neutral Extreme one to the upside with completely higher Value at 50511-50995-51050 with the prominent POC of 50995 being the immediate upside reference for the coming week if it wants to continue the imbalance towards the weekly VPOC of 51484 & the 2 ATR objective of 51929 from the weekly FA of 50283 whereas on the downside, 50856 to 50728 will be the support zone and a break of it could get a drop towards the daily VPOCs of 50520 & 499501‘

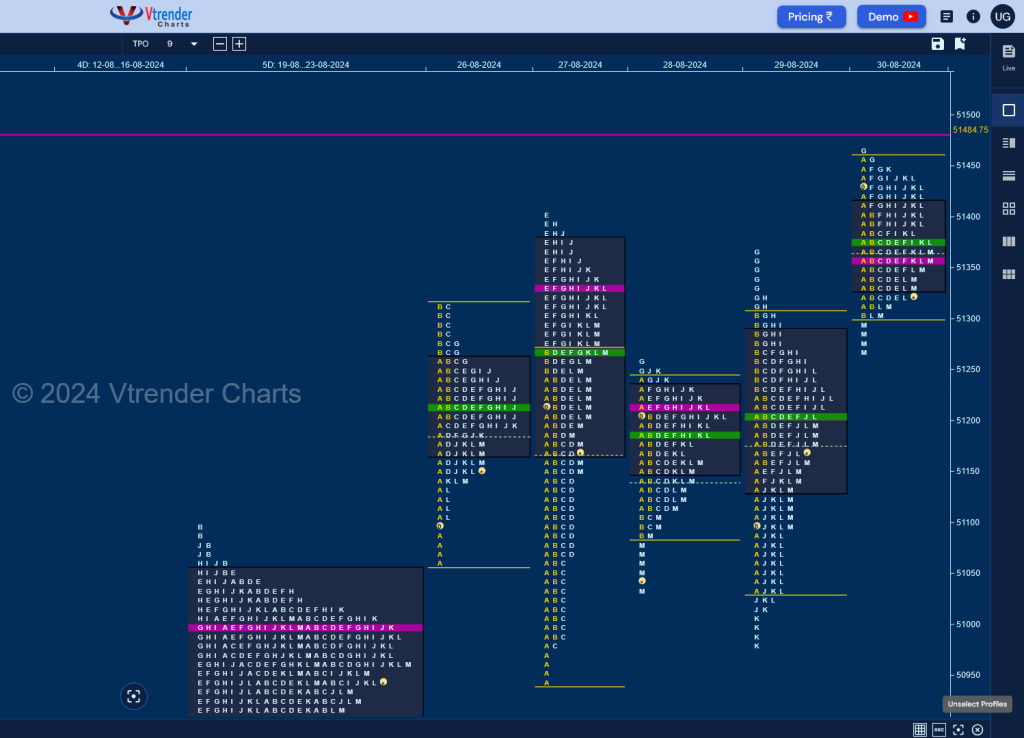
Monday – 51148 [ 51318 / 51061 ] Normal (‘p’ shape)
Tuesday – 51278 [ 51404 / 50938 ] – Normal Variation (Up)
Wednesday – 51143 [ 51260 / 51033 ] – Neutral Extreme (Down)
Thursday – 51152 [ 51369 / 50984 ] – Neutral Centre (OB)
Friday – 51351 [ 51466 / 51256 ] – Neutral
BankNifty opened higher and stayed above previous week’s Value most part of the week as the attempts it made to get back on the first four days was met with swift rejection as the auction built a base around previous POC of 50995 and left couple of daily Swing Lows at 50938 & 50984 forming a nice 4-day balance with value at 51114-51214-51278 from where it made an attempt to move away to the upside on the last day of the week but the test of the monthly extension handle of 51456 resulted in a FA being confirmed at 51466 & a Neutral profile with the adjusted close around the prominent daily POC of 51360.
The weekly profile is also a Neutral one and a Gaussian Curve with completely higher Value at 51112-51214-51338 with a close above VAH which means the PLR (Path of Least Resistance) for the coming week will be to the upside but the auction will need to negate the FA of 51466 & sustain above the weekly VPOC of 51486 towards the 2 ATR objective of 51929 from the weekly FA of 50283 and the July VPOC of 52133 as the immediate objectives in the coming week above which the weekly FAs of 52547 & 52794 could come into play whereas on the downside, this week’s prominent POC of 51214 will be the immediate support below which the swing zone of 50984 to 50934 will need to be broken by the sellers for a probable drop to the lower daily VPOCs of 50520 & 49950 with the weekly FA of 50283 being a reference in between.

Click here to view this week’s MarketProfile of BankNifty on Vtrender Charts
Hypos for 02nd Sep – 51351 [ 51466 / 51256 ] – Neutral
| Up |
| 51360 – POC (30 Aug) 51484 – Weekly VPOC (29Jul-02Aug) 51586 – Sell tail (02 Aug) 51708 – VPOC (31 Jul) 51929 – 1 ATR (WFA 50283) 52133 – Jul VPOC |
| Down |
| 51317 – M TPO h/b (30 Aug) 51174 – 29 Aug Halfback 51018 – Buy Tail (29 Aug) 50856 – Buy Tail (22-23 Aug) 50728 – Weekly SOC (19-23 Aug) 50610 – L TPO h/b (21 Aug) |
Hypos for 03rd Sep – 51439 [ 51579 / 51295 ] Normal
| Up |
| 51464 – L TPO h/b (02 Sep) 51586 – Sell tail (02 Aug) 51708 – VPOC (31 Jul) 51863 – Weekly 2IB 51958 – SOC 52133 – Jul VWAP |
| Down |
| 51422 – 2-day VAH 51295 – Weekly IBL 51174 – 29 Aug Halfback 51018 – Buy Tail (29 Aug) 50856 – Buy Tail (22-23 Aug) 50728 – Weekly SOC (19-23 Aug) |
Hypos for 04th Sep – 51689 [ 51750 / 51240 ] – Neutral Extreme (Up)
| Up |
| 51733 – Sell tail (03 Sep) 51863 – Weekly 2IB 51958 – SOC 52133 – July VWAP 52244 – Sell tail (29 Jul) 52333 – July VPOC |
| Down |
| 51664 – L TPO tail (03 Sep) 51501 – Ext Handle (03 Sep) 51374 – POC (03 Sep) 51240 – FA (03 Sep) 51174 – 29 Aug Halfback 51018 – Buy Tail (29 Aug) |
Hypos for 05th Sep – 51400 [ 51503 / 51260 ] – Normal (Inside Bar)
| Up |
| NA |
| Down |
| NA |
Hypos for 06th Sep – 51473 [ 51636 / 51389 ] – Normal (‘b’ shape)
| Up |
| 51526 – Sell Tail (05 Sep) 51627 – L TPO h/b (04 Sep) 51750 – Swing High (04 Sep) 51863 – Weekly 2IB 51958 – SOC 52133 – July VWAP |
| Down |
| 51445 – M TPO low 51338 – 5-day VAL (30Aug-05Sep) 51214 – Weekly POC 51114 – 4-day VAL (26-29 Aug) 50984 – Swing Low (29 Aug) 50856 – Buy Tail (22-23 Aug) |
