Nifty Spot: 22530 [ 23110 / 22417 ]

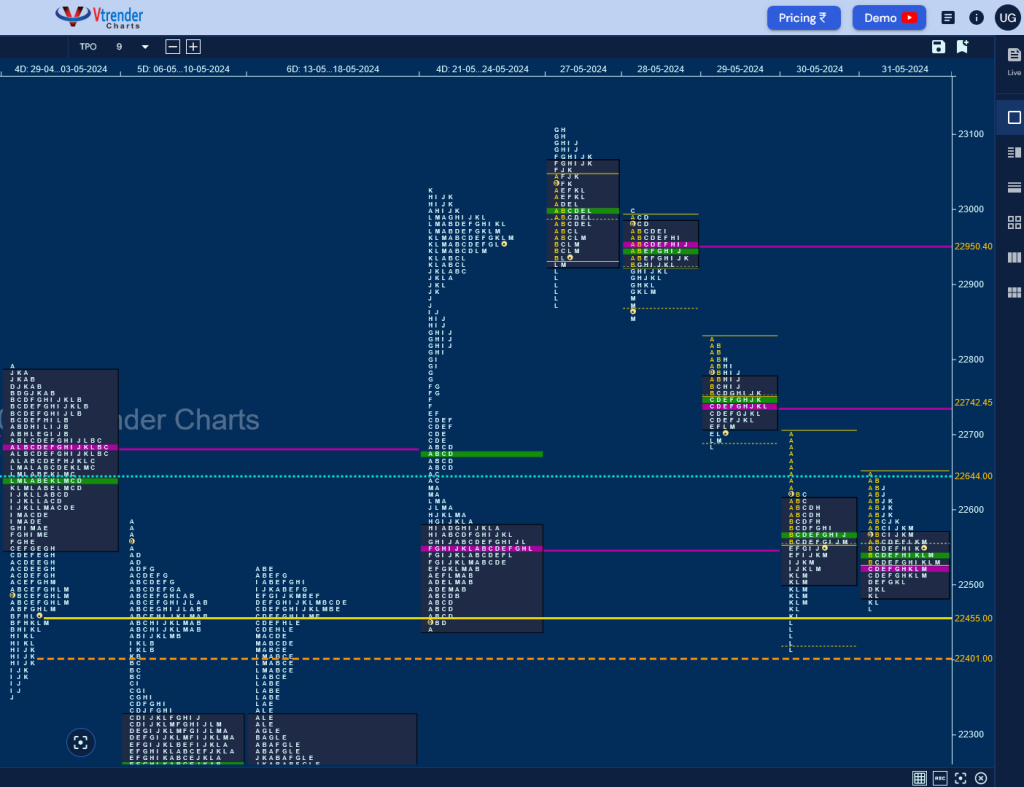
Monday – 22932 [ 23110 / 22871 ] – Neutral Day
Tuesday – 22888 [ 22998 / 22858 ] – Neutral Extreme Day Down with FA confirmed at 22998
Wednesday – 22704 [ 22825 / 22685 ] – Normal Variation Day Down
Thursday – 22488 [ 22705 / 22417 ] – Normal Variation Day (3-1-3 profile)
Friday – 22530 [ 22653 / 22465 ] – Normal Variation Day Down (Inside bar)
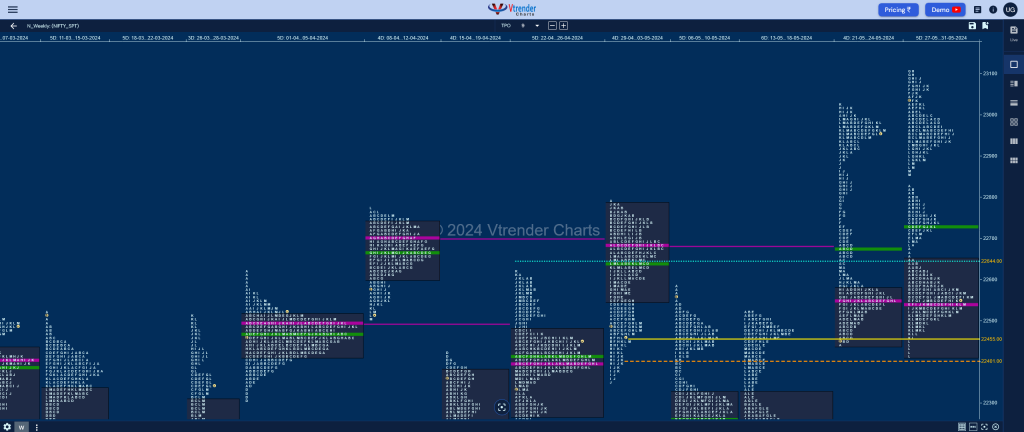
Nifty continued previous week’s imbalance to the upside by opening at new ATH of 23039 but could not sustain triggering a probe lower to the HVN of 22971 as it made a low of 22932 in the IB but left a buying tail causing a fresh upmove resulting in new ATH but poor highs at 23110 indicating exhaustion to the upside which in turn set up a huge downmove of 1290 points over the next 3 sessions aided by a FA at 22998 on 28th forming a Triple Distribution Trend Down weekly profile with completely overlapping Value at 22418-22541-22649 with the selling handles at 22693 & 22971. The only solace for bulls is that the POC has shifted lower to 22541 from 22950 indicating profit booking by the sellers.

Click here to view this week’s MarketProfile of Nifty on Vtrender Charts
Hypos for 03rd June – 22530 [ 22653 / 22465 ] Normal Variation
| Up |
| 22541 – Weekly POC 22606 – 2-day VAH (30-31 May) 22645 – RO Point (June) 22693 – Weekly Ext Handle 22742 – VPOC (29 May) 22802 – PBH (29 May) |
| Down |
| 22509 – 2-day VAL (30-31 May) 22459 – Buy tail (30 May) 22402 – Apr VWAP 22351 – Buy Tail (17 May) 22303 – SOC (16 May) 22267 – 3-day VAH (14-16 May) |
Hypos for 04th June – 23263 [ 23338 / 23062 ] Normal Day (3-1-3 profile)
| Up |
| 23286 – M TPO h/b (03 Jun) 23338 – Weekly IBH 23369 – 1 ATR (yVAL 23150) 23419 – 1 ATR (h/b 23200) 23456 – 2 ATR (FA 22998) 23520 – Monthly ATR (22481) |
| Down |
| 23264 – M TPO low (03 Jun) 23229 – POC (03 Jun) 23161 – PBL (03 Jun) 23110 – Prev Swing High (27 May) 23062 – Weekly IBL 22998 – FA (28 May) |
Hypos for 05th June – 21884 [ 23169 / 21281 ] Trend Day
| Up |
| 21929 – POC (04 Jun) 22068 – Closing PBH (04 Jun) 22110 – J TPO h/b (04 Jun) 22221 – 04 Jun Halfback 22305 – D TPO h/b (04 Jun) 22389 – Ext Handle (04 Jun) |
| Down |
| 21871 – M TPO low (04 Jun) 21725 – PBL (04 Jun) 21560 – G TPO h/b (04 Jun) 21481 – Buy tail (04 Jun) 21381 – RB tail mid (04 Jun) 21281 – PDL |
Hypos for 06th June – 22620 [ 22670 / 21791 ] Trend Day
| Up |
| 22639 – Sell tail (05 Jun) 22683 – C TPO h/b (04 Jun) 22755 – Monthly VAH 22880 – Sell Tail (04 Jun) 23024 – IB singles mid 23062 – Ext Handle (04 Jun) |
| Down |
| 22597 – M TPO h/b (05 Jun) 22516 – K TPO h/b (05 Jun) 22445 – SOC (05 Jun) 22335 – POC (05 Jun) 22241 – PBL (05 Jun) 22197 – D TPO h/b (05 Jun) |
Hypos for 07th June – 22821 [ 22910 / 22642 ] Gaussian Curve
| Up |
| 22835 – M TPO h/b (06 Jun) 22904 – Sell tail (06 Jun) 23016 – 1 ATR (PL FA 22645) 23062 – Ext Handle (04 Jun) 23160 – PBL (03 Jun) 23229 – VPOC (03 Jun) |
| Down |
| 22805 – VAH (06 Jun) 22692 – VAL (06 Jun) 22645 – Poor Low FA (06 Jun) 22597 – M TPO h/b (05 Jun) 22516 – K TPO h/b (05 Jun) 22445 – SOC (05 Jun) |
BankNifty Spot: 48984 [ 49688 / 48313 ]

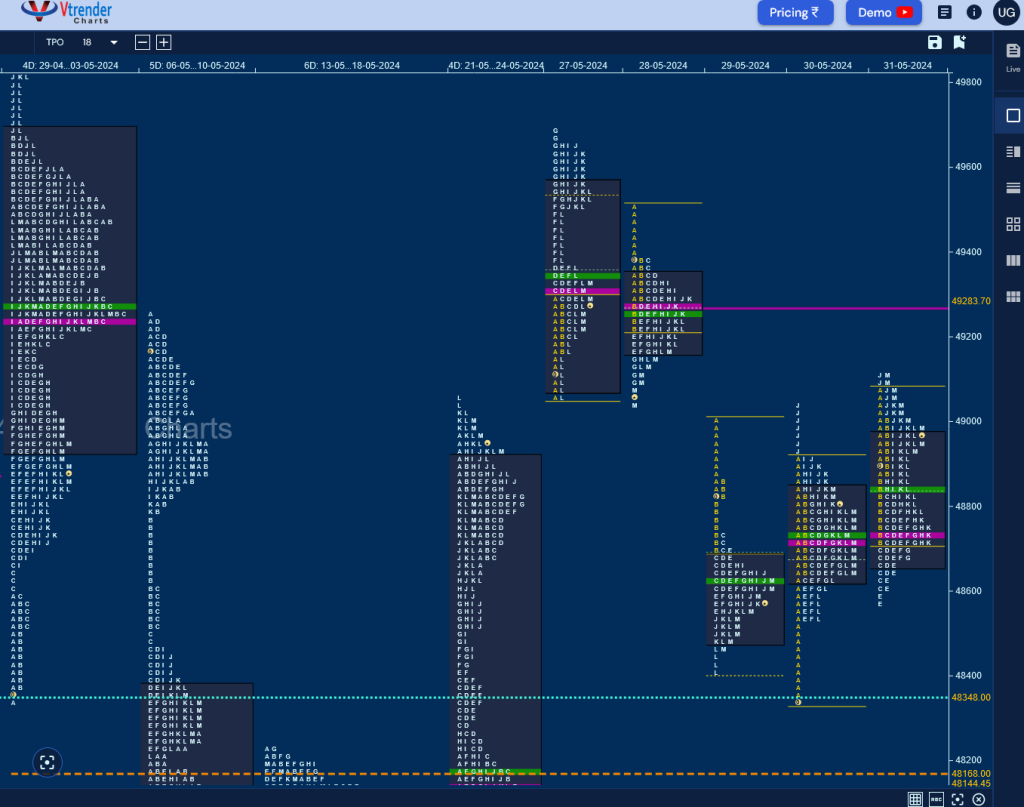
Monday – 49281 [ 49688 / 49051 ] – Neutral Day
Tuesday – 49142 [ 49511 / 49043 ] – Normal Varation
Wednesday – 48501 [ 49022 / 48401 ] – ‘b’ shape profile
Thursday – 48682 [ 49044 / 48313 ] – Normal Day (3-1-3 profile)
Friday – 48984 [ 49122 / 48569 ] – Neutral Day
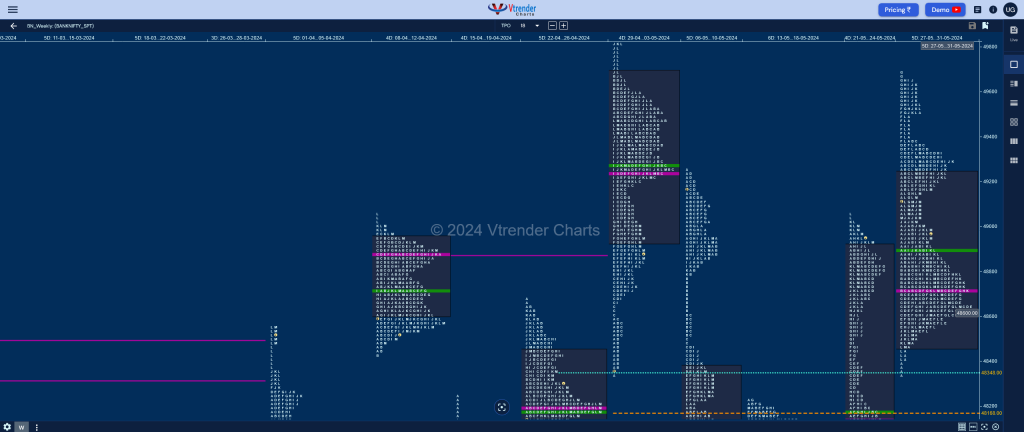
The weekly profile is a Normal Variation one to the downside but seems more like a DD (Double Distribution) which started with a 2-day balance with a prominent POC at 49283 and moved lower to tag the RO point of 48360 but ended up forming another nice balance over the remaining 3 days with the POC at 48720. Value for the week was overlapping to higher at 48462-48721-49231 and will need to take out one of the POCs with an initiative move for an imbalance in that direction for the coming week.

Click here to view this week’s MarketProfile of BankNifty on Vtrender Charts
Hypos for 03rd Jun – 48984 [ 49122 / 48569 ]
| Up |
| 49047 – RO point (June) 49278 – VPOC (27-28 May) 49505 – SOC (27 May) 49658 – Sell tail (27 May) 49818 – SOC (30 Apr) 49974 – ATH |
| Down |
| 48894 – 3-day VAH (29-31 May) 48721 – 3-day POC (29-31 May) 48578 – 3-day VAL (29-31 May) 48367 – May Series VWAP 48144 – Weekly VPOC (20-24 May) 47990 – A TPO h/b (23 May) |
Hypos for 04th June – 23263 [ 23338 / 23062 ]
| Up |
| 50990 – Weekly IBH 51133 – PDH 51222 – 1 ATR (03 Jun h/b 50612) 51363 – 2 ATR (WPOC 48721) 51468 – Prev Week Range 51564 – 1 ATR (yVAH 50954) |
| Down |
| 50956 – Spike low (03 Jun) 50814 – POC (03 Jun) 50611 – 03 Jun Halfback 50490 – SOC (03 Jun) 50292 – A TPO h/b (03 Jun) 50105 – Buy Tail (03 Jun) |
Hypos for 05th June – 46928 [ 50667 / 46078 ] Trend Day
| Up |
| 46928 – Prev Close 47195 – POC (04 Jun) 47418 – HVN (04 Jun) 47600 – PBH (04 Jun) 47726 – May POC 48084 – PBH (04 Jun) 48367 – May VWAP |
| Down |
| 46887 – M TPO low (04 Jun) 46652 – PBL (04 Jun) 46438 – SOC (04 Jun) 46138 – Buy Tail (04 Jun) 46012 – D TPO h/b (20 Mar) 45864 – VPOC (20 Mar) 45700 – Monthly VPOC (Feb 2024) |
Hypos for 06th June – 49054 [ 49362 / 46446 ] Neutral Extrme Day
| Up |
| 49100 – M TPO high (05 Jun) 49375 – SOC (04 Jun) 49699 – Sell Tail (04 Jun) 49937 – Gap mid (03 Jun) 50092 – Ext Handle (04 Jun) 50339 – IB tail mid (04 Jun) |
| Down |
| 48950 – M TPO h/b (05 Jun) 48800 – Ext Handle (05 Jun) 48515 – J TPO tail (05 Jun) 48367 – May VWAP 48000 – Ext Handle (05 Jun) 47833 – POC (05 Jun) |
Hypos for 07th June – 49291 [ 49672 / 48906 ] Neutral Extrme Day
| Up |
| 49294 – POC (06 Jun) 49414 – VAH (06 Jun) 49578 – D TPO h/b (06 Jun) 49699 – Sell Tail (04 Jun) 49937 – Gap mid (03 Jun) 50092 – Ext Handle (04 Jun) |
| Down |
| 49280 – M TPO h/b (06 Jun) 49193 – TPO HVN (06 Jun) 49088 – VAL (06 Jun) 48948 – Buy tail (06 Jun) 48800 – Ext Handle (05 Jun) 48515 – J TPO tail (05 Jun) |
