Nifty Spot: 24205 [ 24498 / 24134 ] Normal (Gaussian + Inside Bar)
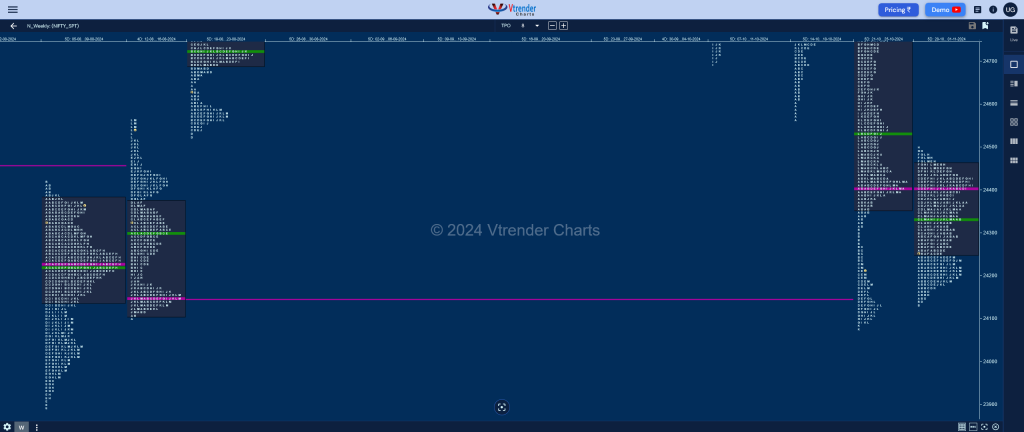
Previous week’s report ended with this ‘The weekly profile is a Trend one to the downside with an initiative selling tail from 24878 to 24978 forming lower Value at 24355-24400-24808 with an extension handle at 24312 which will be the first major supply point for the coming week which the bulls will have to reclaim for a test of 24400-451 above which it could fill up the zone till 24750 whereas on the downside, 24171-125 will be the support zone below which Nifty could go in for a test of the swing low of 23893 and a decisive break of it could give a further drop to the weekly extension handle of 23618 & VPOC of 23533‘
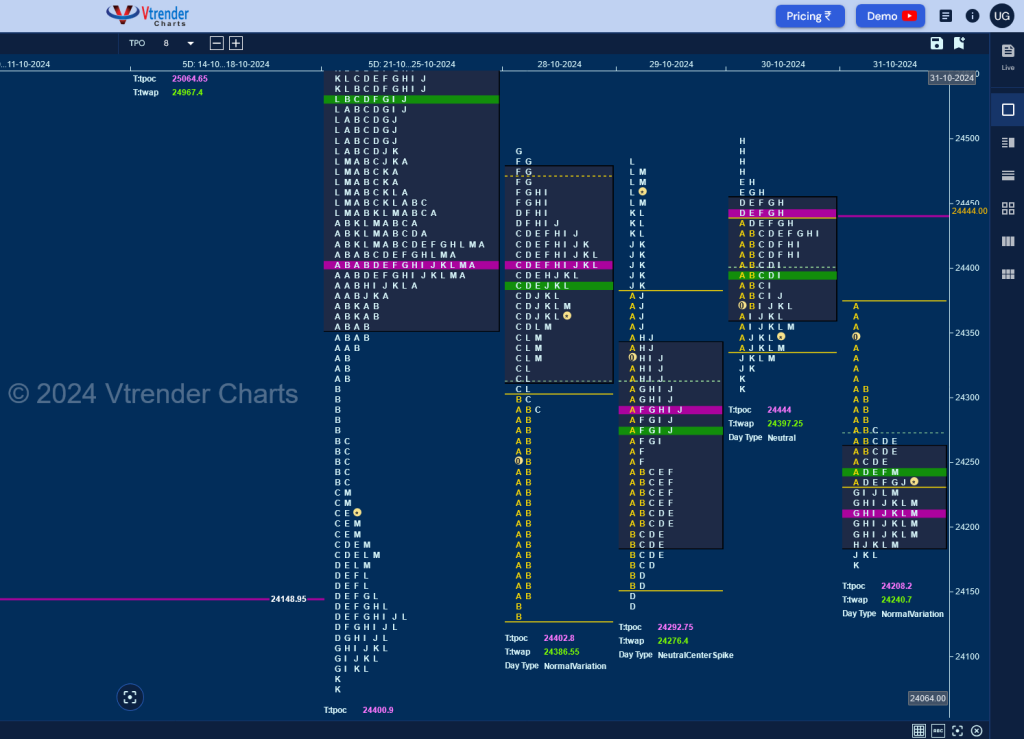
Monday – 24339 [ 24492 / 24134 ] Normal Variation (Up)
Tuesday – 24466 [ 24484 / 24140 ] Neutral Extreme (Up)
Wednesday – 24340 [ 24498 / 24307 ] – Neutral Extreme (Down)
Thursday – 24205 [ 24480 / 24341 ] Normal Variation (Down)
Friday – Holiday (Diwali)
In Market Profile, balance leads to imbalance and vice versa which we got to witness in Nifty as previous week’s Trend Down profile of 904 points paved way for a Normal Gaussian Curve of mere 363 points as the auction tested the 24400-24451 zone multiple times on the upside but could not sustain whereas on the downside it confirmed a FA (Failed Auction) at 24140 which will be the immediate support for the coming week below which it could resume the downside towards the Swing Low of 23893 & the weekly extension handle of 23618. This week’s Value was overlapping to lower at 24250-24402-24459 so will need to stay above this balance for any up move towards 24649 & 24750 in the coming sessions.
Click here to view this week’s MarketProfile of Nifty on Vtrender Charts
Hypos for 04th Nov– 24205 [ 24480 / 24341 ] Normal Variation (Down)
| Up |
| 24208 – POC (31 Oct) 24263 – VAH (31 Oct) 24304 – Sell Tail (31 Oct) 24359 – M TPO high (30 Oct) 24402 – Weekly POC 24444 – VPOC (30 Oct) |
| Down |
| 24186 – VAL (31 Oct) 24140 – FA (29 Oct) 24107 – SOC (25 Oct) 24057 – J TPO h/b (06 Aug) 24012 – 2-day POC (05-06 Aug) 23960 – Buy tail (Aug) |
Hypos for 05th Nov– 23995 [ 24316 / 23816 ] Normal Variation (Down)
| Up |
| NA |
| Down |
| NA |
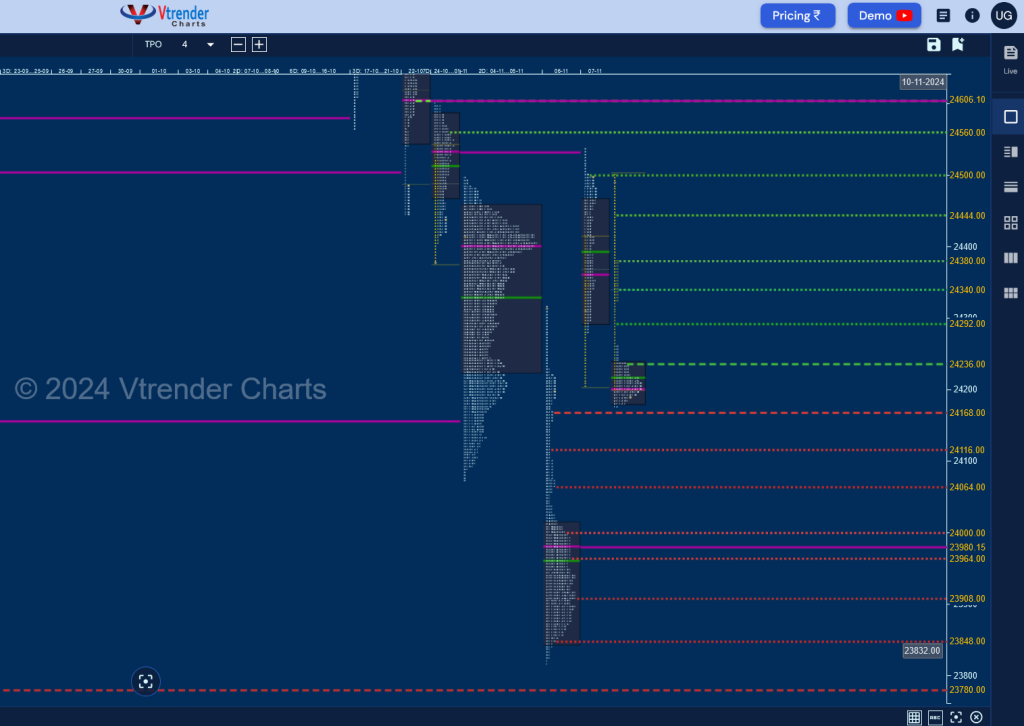
Hypos for 06th Nov– 24213 [ 24229 / 23842 ] Neutral Extreme (Up)
| Up |
| 24220 – M TPO high (05 Nov) 24272 – 31 Oct Halfback 24316 – Weekly IBH 24359 – M TPO high (30 Oct) 24402 – Weekly POC 24444 – VPOC (30 Oct) 24498 – Swing High (30 Oct) 24562 – H TPO h/b (23 Oct) |
| Down |
| 24205 – M TPO h/b (05 Nov) 24171 – Ext Handle (05 Nov) 24118 – J TPO h/b (05 Nov) 24065 – I TPO tail (05 Nov) 24000 – I TPO h/b (05 Nov) 23964 – SOC (05 Nov) 23908 – SOC (05 Nov) 23848 – Buy tail (05 Nov) |
Hypos for 07th Nov– 24484 [ 24537 / 24204 ] – Normal Variation Up (3-1-3)
| Up |
| 24500 – Sell tail (06 Nov) 24562 – H TPO h/b (23 Oct) 24606 – VPOC (22 Oct) 24658 – Ext Handle (22 Oct) 24702 – PBH (22 Oct) 24750 – Ext Handle (22 Oct) 24816 – B TPO h/b (22 Oct) 24864 – 3-day VAH (17-21 Oct) |
| Down |
| 24485 – M TPO h/b (06 Nov) 24447 – PBL (06 Nov) 24371 – 06 Nov Halfback 24316 – Weekly IBH 24278 – A TPO h/b (06 Nov) 24229 – SOC (Nov) 24171 – Ext Handle (05 Nov) 24118 – J TPO h/b (05 Nov) |
Hypos for 08th Nov– 24199 [ 24503 / 24179 ] Normal (‘b’ shape)
| Up |
| 24239 – PBH (07 Nov) 24292 – B TPO h/b (07 Nov) 24340 – 07 Nov Halfback 24382 – Sell Tail (07 Nov) 24447 – SOC (07 Nov) 24503 – Sell tail (Nov) 24562 – H TPO h/b (23 Oct) 24606 – VPOC (22 Oct) |
| Down |
| 24171 – Ext Handle (05 Nov) 24118 – J TPO h/b (05 Nov) 24065 – I TPO tail (05 Nov) 24000 – I TPO h/b (05 Nov) 23964 – SOC (05 Nov) 23908 – SOC (05 Nov) 23848 – Buy tail (05 Nov) 23780 – 26 Jun Halfback |
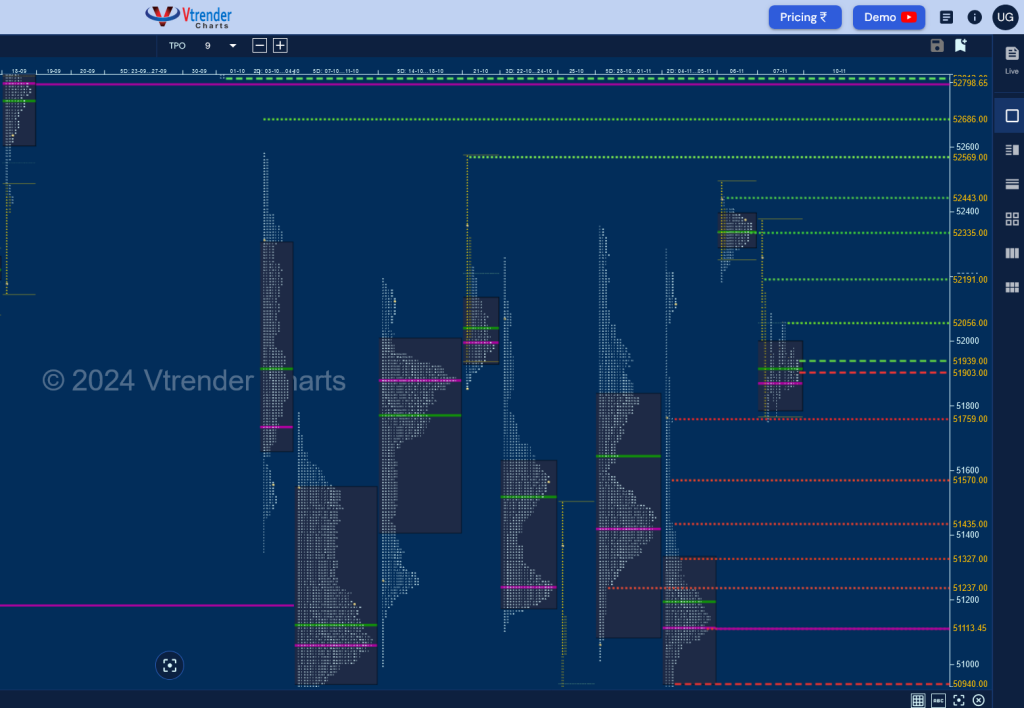
BankNifty Spot: 51475 [ 52354 / 51012 ] Normal Variation (Up)
Previous week’s report ended with this ‘The weekly profile is a Trend one to the downside with an initiative selling tail from 52319 to 52577 and the Weekly IBL at the important level of 51879 forming outside value at both sides at 51128-51238-52067 with a late extension handle at 51030. The singles zone from 50888 to 51030 will be the immediate zone to watch on the upside above which it could go for a test of the HNVs of 51238, 51566 & 51949 whereas on the downside, a decisive break of 50570 could bring in a test of the VPOCs of 49950, 49733 & 49326 in the coming week(s)‘
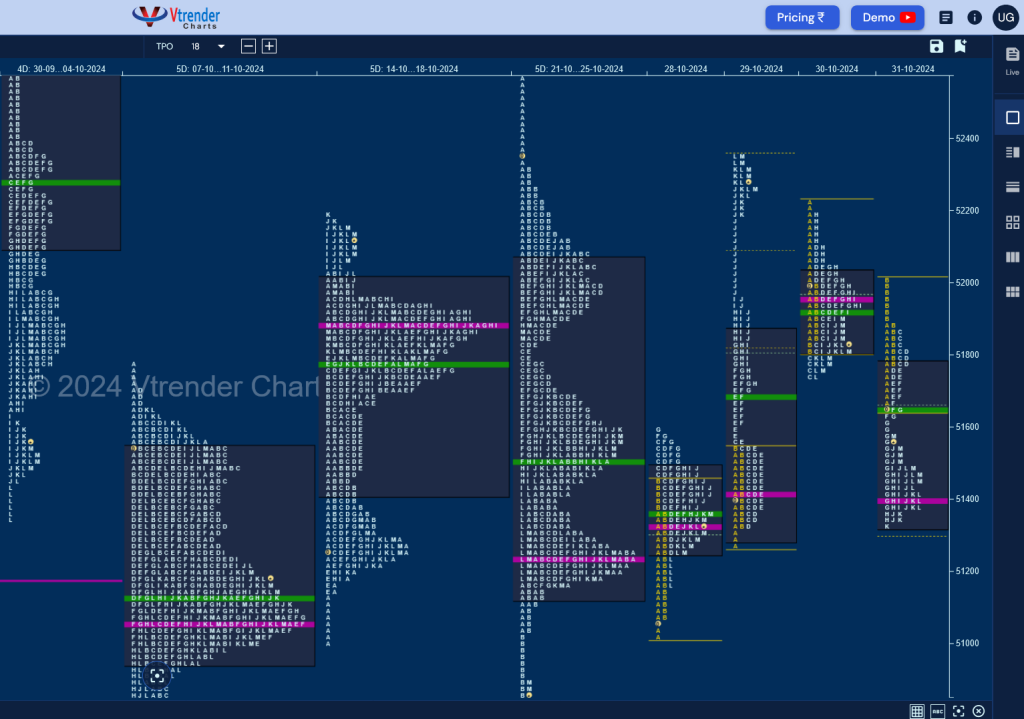
Monday – 51259 [ 51589 / 51012 ] – Normal Variation (Up)
Tuesday – 52320 [ 52354 / 51278 ] – Triple Distribution Trend (Up)
Wednesday – 51807 [ 52220 / 51733 ] – Normal (‘b’ shape)
Thursday – 51475 [ 52005 / 51318 ] – Double Distribution (Down)
Friday – Holiday (Diwali)
BankNifty opened higher and showed change of polarity in the singles from 51030 to 50888 resulting in a big probe to the upside as it went on to swipe through previous week’s value and went on to form a Trend Day Up on Tuesday testing the initiative selling tail from 52319 to 52577 while making a high of 52354. However, this big supply zone could not be sustained as the auction got back into previous week’s value on Wednesday forming a long liquidation ‘b’ shape profile and followed it with a DD (Double Distribution) Trend one down on Thursday while making a low of 51318.
The weekly profile is a Normal Variation one to the upside but also an Inside bar both in terms of value & range with value at 51075-51421-51845 and the wait for a move away from this overlapping balance of 4 weeks continue into the new week & month for either a test of the weekly VPOC of 53001 on the upside whereas the immediate downside objective would be the daily VPOC of 49950.
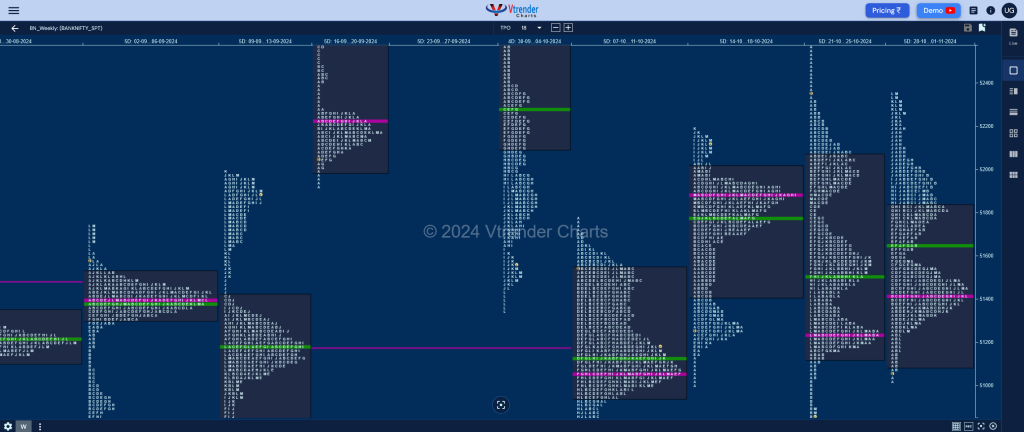
Click here to view this week’s MarketProfile of BankNifty on Vtrender Charts
Hypos for 04 Nov– 51475 [ 52005 / 51318 ] – Double Distribution (Down)
| Up |
| NA |
| Down |
| NA |
Hypos for 05 Nov– 51215 [ 51764 / 51066 ] – Normal Variation (Down)
| Up |
| NA |
| Down |
| NA |
Hypos for 06 Nov– 52207 [ 52289 / 50865 ] – Neutral Extreme (Up)
| Up |
| NA |
| Down |
| NA |
Hypos for 07 Nov– 52207 [ 52289 / 50865 ] – Neutral Extreme (Up)
| Up |
| 52335 – POC (06 Nov) 52451 – Sell Tail (06 Nov) 52577 – Swing High (21 Oct) 52691 – IB tail mid (03 Oct) 52817 – Daily Ext Handle 52977 – VPOC (01 Oct) 53114 – Sell Tail (01 Oct) 53248 – VPOC (30 Sep) |
| Down |
| 52293 – VAL (06 Nov) 52152 – M TPO h/b (05 Nov) 52059 – J TPO tail (05 Nov) 51942 – J TPO h/b (05 Nov) 51764 – Weekly IBH 51577 – 05 Nov Halfback 51443 – Ext Handle (05 Nov) 51328 – 2-day VAH (04-05 Nov) |
Hypos for 08 Nov– 51916 [ 52377 / 51752 ] – Normal (‘b’)
| Up |
| 51941 – M TPO high (07 Nov) 52064 – 07 Nov Halfback 52192 – A TPO h/b (07 Nov) 52335 – POC (06 Nov) 52451 – Sell Tail (06 Nov) 52577 – Swing High (21 Oct) 52691 – IB tail mid (03 Oct) 52817 – Daily Ext Handle |
| Down |
| 51905 – M TPO low (07 Nov) 51764 – Weekly IBH 51577 – 05 Nov Halfback 51443 – Ext Handle (05 Nov) 51328 – 2-day VAH (04-05 Nov) 51239 – Oct POC 51113 – VPOC (05 Nov) 50944 – 2-day VAL (04-05 Nov) |
