Nifty Spot: 22475 [ 22794 / 22348 ]

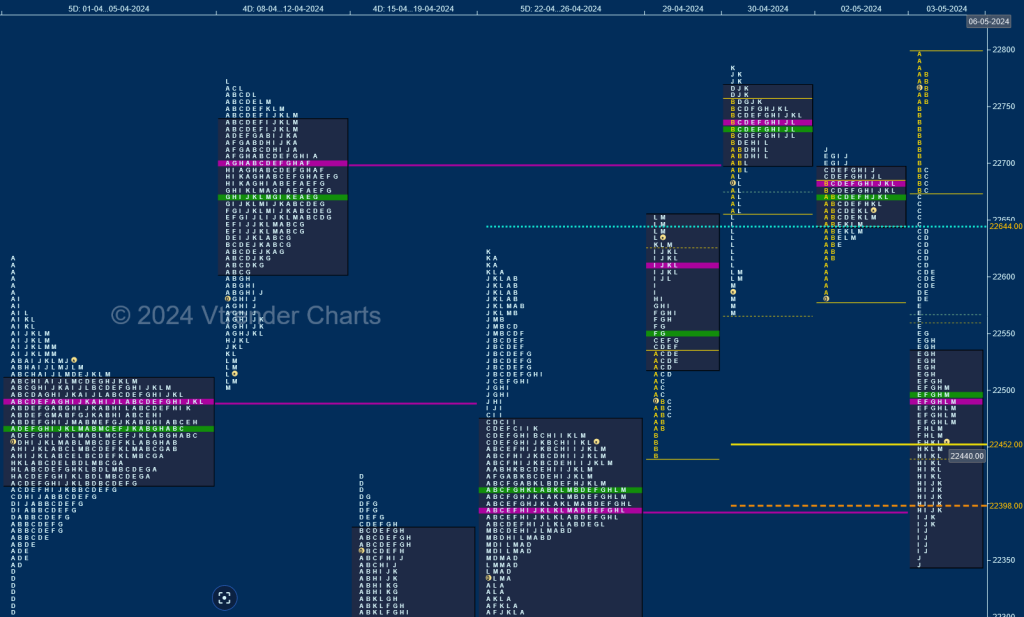
Nifty opened the week with a small gap up on Monday rejecting the lower distribution of 26th Apr’s Double Distribution profile leaving a B period buying tail from 22468 to 22441 and forming a Trend Day Up scaling above previous week’s high of 22626 as it hit 22655 into the close and continued this imbalance with another initiative buying tail from 22696 to 22661 on Tuesday where it went on to tag new ATH of 22783 in the K period but saw some big month end profit booking triggering a huge liquidation drop down to 22568 into the close leaving a Neutral Extreme (NeuX) Day Down.
The auction did not give any follow through to Tuesday’s NeuX close forming an inside bar and a ‘p’ shape profile with a prominent POC at 22682 filling up the low volume zone below yPOC of 22736 which was followed by a big gap up on Friday with a look up above the NeuX highs of 22783 as it recorded new ATH of 22794 but once again could not sustain and left an initiative selling tail along with an extension handle at 22754 as it not only got back into previous range completing the 80% Rule with the help of the second extension handle at 22675 but continued to trend lower making a hat-trick of extension handles at 22583 resulting in a test of April’s POC of 22457 & the series VWAP of 22402 while hitting new lows for the week at 22348 taking support just above 25th Apr’s A period buying tail from 22339 from where it gave a bounce back to the POC of 22490 into the close.
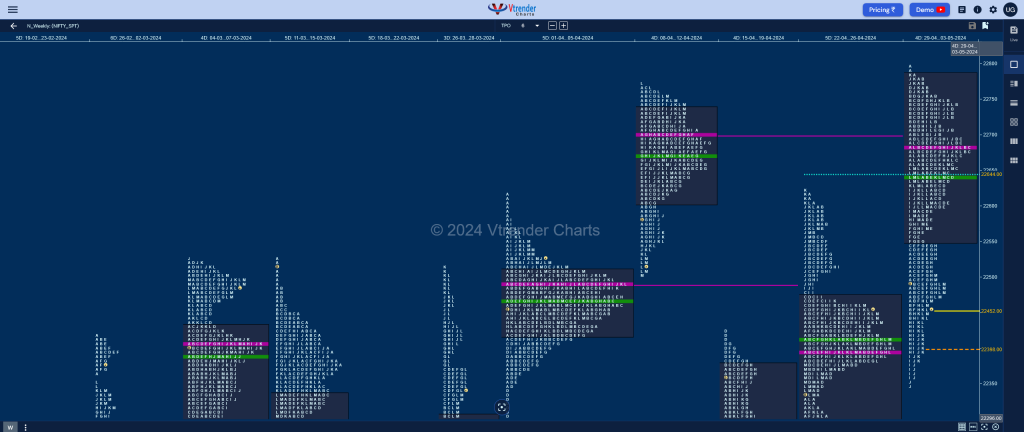
Nifty has formed a Neutral Extreme weekly profile on the downside though the Value is completely higher at 22548-22682-22784 so can continue to experience 2-way mode in the coming week with the probable upside objectives being at 22583 / 22682 & 22778 whereas on the downside, 22457 will be the immediate support below which 22358 & 22257 could come into play for the coming week.

Click here to view this week’s MarketProfile of Nifty on Vtrender Charts
Hypos for 06th May – 22475 [ 22794 / 22348 ]
| Up |
| 22490 – POC (03 May) 22548 – PBH (03 May) 22583 – Ext Handle (03 May) 22644 – C TPO h/b (03 May) 22682 – Weekly POC |
| Down |
| 22457 – Apr POC 22416 – K TPO h/b (03 May) 22358 – Buy tail (03 May) 22305 – Swing Low (25 Apr) 22257 – PBL (22 Apr) |
Hypos for 07th May – 22442 [ 22588 / 22409 ]
| Up |
| 22463 – M TPO high (06 May) 22504 – VAH (06 May) 22542 – Sell Tail (06 May) 22588 – Weekly IBH 22644 – C TPO h/b (03 May) |
| Down |
| 22446 – POC (06 May) 22412 – Buy tail (06 May) 22358 – Buy tail (03 May) 22305 – Swing Low (25 Apr) 22257 – PBL (22 Apr) |
Hypos for 08th May – 22302 [ 22499 / 22232 ]
| Up |
| to be updated… |
| Down |
| to be updated… |
Hypos for 09th May – 22302 [ 22368 / 22185 ]
| Up |
| 22335 – 2-day VAH (07-08 May) 22376 – Ext Handle (07 May) 22435 – VAL (06 May) 22482 – Sell Tail (07 May) 22542 – Sell Tail (06 May) |
| Down |
| 22291 – IBH (08 May) 22244 – PBL (08 May) 22185 – FA (08 May) 22137 – Weekly POC 22060 – Ext Handle (19 Apr |
Hypos for 10th May – 21957 [ 22307 / 21932 ]
| Up |
| 21982 – L TPO h/b (09 May) 22022 – Ext Handle (09 May) 22081 – PBH (09 May) 22122 – Ext Handle (09 May) 22185 – Negated FA (08 May) 22221 – Ext Handle (09 May) |
| Down |
| 21950 – M TPO h/b (09 May) 21903 – IBH (19 Apr) 21864 – VPOC (19 Apr) 21824 – A TPO h/b (19 Apr) 21777 – Swing Low (19 Apr) 21724 – 2 ATR (FA 22185) |
BankNifty Spot: 48923 [ 49974 / 48432 ]

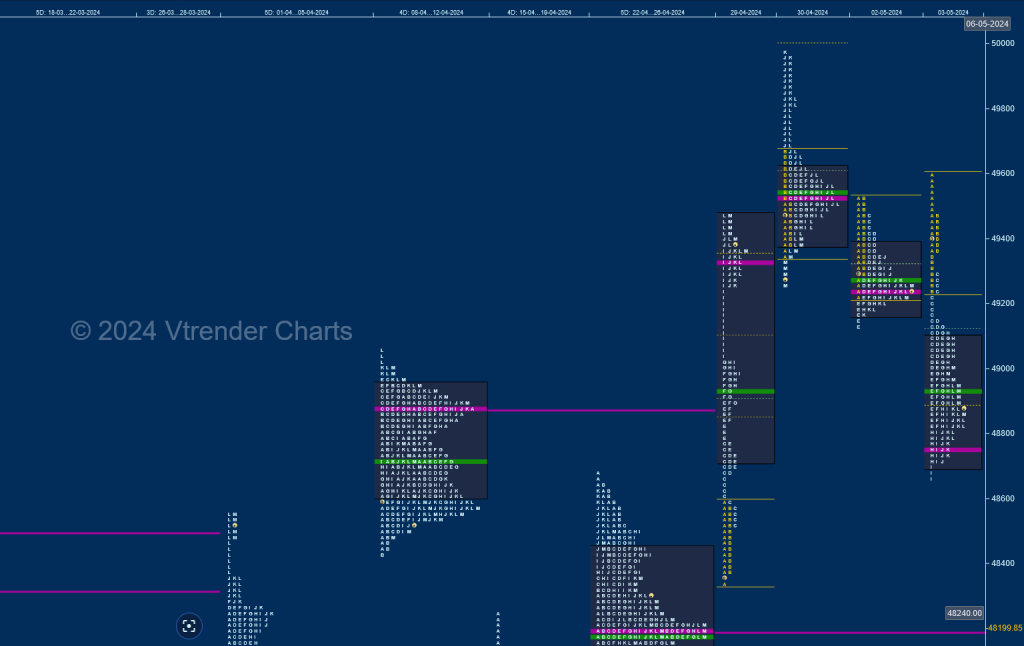
BankNifty opened higher on Monday well above previous week’s prominent POC of 48200 and gave the expected move away from previous week’s Value leaving an extension handle at 48592 & forming a huge 1131 point Trend Day Up as it scaled above previous ATH of 49057 and went on to hit 49473 but saw the POC shifting higher to 49234 indicating profit booking by the longs after which it got back to balance mode on Tuesday forming a narrow range IB (Initial Balance) above 49473 and remained within it till the I TPO.
However, the J TPO had other plans and made a big extension higher followed by new highs of 49974 in the K as the auction stalled just below the BRN (Big Round Number) of 50000 and saw some aggressive selling coming in as it left a small tail at top along with a SOC (Scene Of Crime) at 49818 not only getting back into the IB but went on to make new lows for the day at 49249 forming a Neutral Day with the POC at 49529. Thursday opened with a look down below previous lows but was immediately rejected triggering a probe higher for the rest of the IB which stalled right at 49529 displaying that the sellers were still in control and they made an attempt to extend lower in the E period but took support in the 29th Apr mid-profile singles from 49253 to 49031 while making a low of 49123 forming a balanced profile for the day with lower value and a close near the prominent POC of 49244. BankNifty opened with an unexpected gap up on Friday even scaling above Tuesday’s POC of 49529 while making a high of 49607 in the A TPO but could not sustain and left an initiative selling tail triggering the 80% rule in previous value after which it continued to extend lower till the I period testing 29th Apr’s trend day buying levels making a low of 48659 where it left a small tail just 48592 showing profit booking by the sellers as even the POC shifted lower to 48757 resulting in a bounce back to 48997 into the close leaving a ‘b’ shape profile for the day with completely lower Value once again.
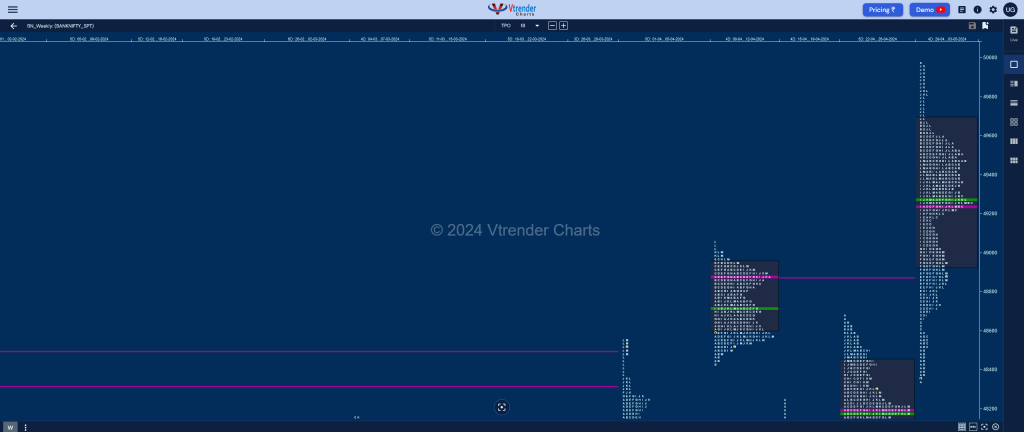
The weekly profile however is a 3-1-3 type with an elongated range of 1632 points forming completely higher Value at 48936-49244-49681 though has closed around the VAL and could fill up the zone upto 49244 in the coming session(s) as long as it stays above 48592 with the selling tail from 49470 to 49607 being an important zone to watch for buyers to make a fresh attempt to test the higher levels of 49818 & 49953 in the coming week whereas on the downside, 48757 & 48592 will be the support levels below which the sellers could play for a probe to 48200 & 47904.

Click here to view this week’s MarketProfile of BankNifty on Vtrender Charts
Hypos for 06th May – 48923 [ 49607 / 48659 ]
| Up |
| 48997 – M TPO high (03 May) 49130 – PBH (03 May) 49246 – Ext Handle (03 May) 49358 – B TPO h/b (03 May) 49490 – A TPO h/b (03 May) |
| Down |
| 48853 – M TPO low (03 May) 48710 – Buy tail (03 May) 48592 – Ext Handle (29 Apr) 48467 – A TPO h/b (29 Apr) 48360 – May RO point |
Hypos for 07th May – 48895 [ 49252 / 48780 ]
| Up |
| 48954 – M TPO high (06 May) 49091 – VAH (06 May) 49231 – Sell Tail (06 May) 49358 – B TPO h/b (03 May) 49490 – A TPO h/b (03 May) |
| Down |
| 48907 – POC (06 May) 48757 – VPOC (03 May) 48592 – Ext Handle (29 Apr) 48467 – A TPO h/b (29 Apr) 48360 – May RO point |
Hypos for 08th May – 48285 [ 48965 / 48213 ]
| Up |
| to be updated… |
| Down |
| to be updated… |
Hypos for 09th May – 48021 [ 48223 / 47851 ]
| Up |
| 48087 – POC (08 May) 48198 – Sell Tail (08 May) 48300 – VPOC (07 May) 48406 – J TPO h/b (07 May) 48522 – Ext Handle (07 May) |
| Down |
| 48008 – VAL (08 May) 47904 – Buy tail (08 May) 47737 – Swing Low (25 Apr) 47628 – FA (22 Apr) 47500 – Weekly VPOC (15-19 Apr) |
Hypos for 10th May – 47474 [ 48258 / 47440 ]
| Up |
| 47551 – L TPO h/b (09 May) 47659 – K TPO h/b (09 May) 47839 – POC (09 May) 47965 – Ext Handle (09 May) 48087 – POC (08 May) 48173 – Sell Tail (09 May) |
| Down |
| 47460 – Buy tail (09 May) 47357 – Ext Handle (19 Apr) 47200 – Mid-profile tail (19 Apr) 47045 – Ext Handle (19 Apr) 46952 – IBH (19 Apr) 46829 – VPOC (19 Apr) |
