Nifty Spot: 21853 [22126 / 21429 ]
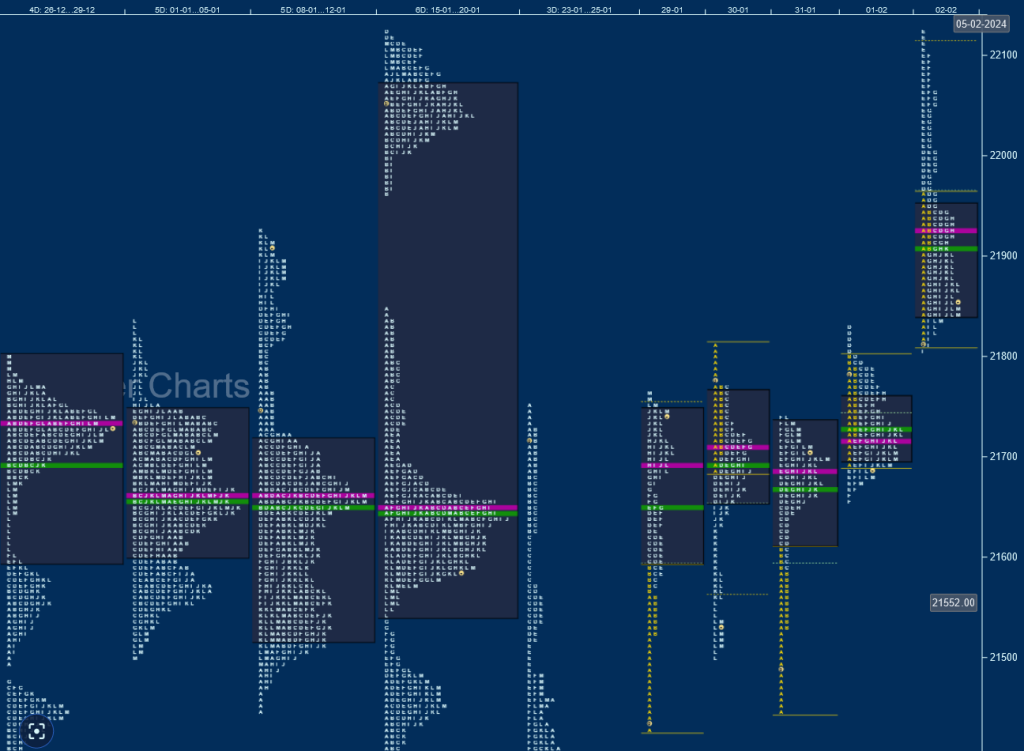
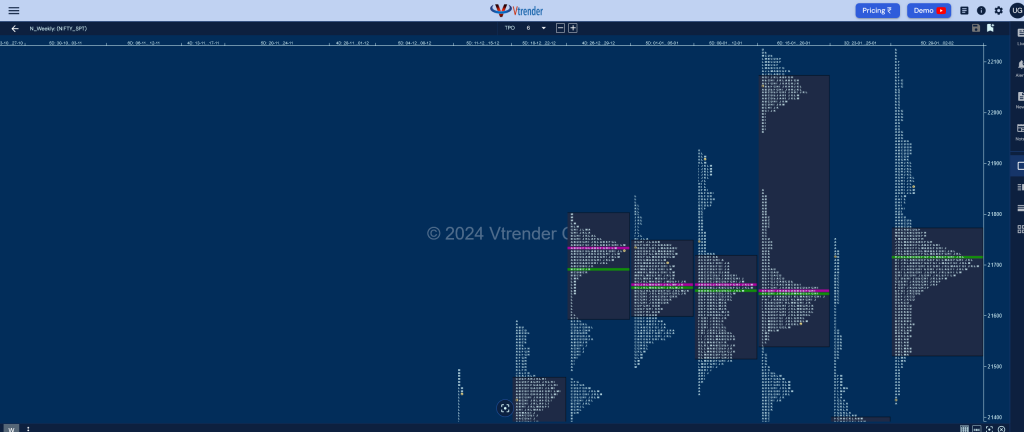
Previous week’s profile represented a ‘b’ shape one with completely lower Value at 21231-21300-21399 but had left a good responsive buying tail from 21192 to 21137 with a close at 21352 but has an initiative selling tail from 21731 to 21750 along with couple of extension handles at 21629 & 21519 which were the important upside levels to watch.

Nifty opened the week well above previous week’s Value and left an initiative buying tail from 21526 to 21429 as it went on to negate all the selling references of previous week while making a high of 21763 on Monday but found supply coming back at the higher open in the next session as it confirmed an A period tail from 21773 to 21813 and went on to test Monday’s singles while making a low of 21501.
The auction continued this downside imbalance with a lower open on Wednesday but took support just above 21429 and left another A period buying tail from 21531 to 21448 confirming presence of OTF (Other Time Frame) in this zone who managed to pushed it above 21813 on Thursday but formed a Neutral Day with overlapping value for the 4th consecutive day also confirming a FA (Failed Auction) at 21833.
Nifty then gave a move away from this 4-day balance with Value at 21640-21700-21765 with a gap up plus a drive open on Friday and went on to trend higher in the first half of the day even recording new ATH of 22126 in the E period but left a responsive selling tail till 22102 along with a SOC (Scene Of Crime) at 22051 triggering a big liquidation break completely retracing the entire upmove of the day and even making marginal new lows of 21805 before closing at 21853 leaving an elongated 697 point range weekly profile with completely higher Value at 21523-21700-21773 but has left seller footprints at 21910 / 21963 & 22003 apart from 22051 & 22102 which will be the important references for the coming week whereas on the downside, break of 21765 could trigger the 80% Rule towards 21640.

Click here to view this week’s MarketProfile of Nifty on Vtrender Charts
Hypos for 05th Feb 2024
| Up |
| 21910 – SOC from 02 Feb 21963 – IBH from 02 Feb 22003 – SOC from 02 Feb 22051 – SOC from 02 Feb 22102 – Selling tail (02 Feb) |
| Down |
| 21826 – Closing PBL (02 Feb) 21760 – 4-day VAH (29Jan-01Feb) 21700 – 4-day VPOC (29Jan-01Feb) 21640 – 4-day VAL (29Jan-01Feb) 21581 – Jan Series VWAP |
Hypos for 06th Feb 2024
| Up |
| 21777 – M TPO high (05 Feb) 21816 – Mid-profile singles 21853 – SOC from 05 Feb 21911 – POC from 05 Feb 21952 – Selling Tail (05 Feb) |
| Down |
| 21752 – Closing tail (05 Feb) 21700 – 4-day VPOC (29Jan-01Feb) 21640 – 4-day VAL (29Jan-01Feb) 21581 – Jan Series VWAP 21531 – Buying Tail (31 Jan) |
Hypos for 07th Feb 2024
| Up |
| 21952 – Selling Tail (05 Feb) 22003 – SOC from 02 Feb 22051 – SOC from 02 Feb 22102 – Selling tail (02 Feb) 22170 – 1 ATR from yPOC (21918) |
| Down |
| 21926 – 3-day POC (02-06 Feb) 21897 – PBL from 06 Feb 21843 – 3-day VAL (02-06 Feb) 21776 – Buying Tail (06 Feb) 21718 – VPOC from 01 Feb |
Hypos for 08th Feb 2024
| Up |
| 21937 – M TPO halfback 21984 – PBH from 07 Feb 22021 – Selling Tail (07 Feb) 22076 – F TPO halfback (02 Feb) 22126 – Swing High (02 Feb) 22164 – 1 ATR from yPOC (21896) |
| Down |
| 21920 – M TPO low 21881 – PBL from 07 Feb 21844 – 06 Feb halfback 21776 – Buying Tail (06 Feb) 21737 – 2-day buy tail (05-06 Feb) 21700 – 4-day VPOC (29Jan-01Feb) |
Hypos for 09th Feb 2024
| Up |
| 21760 – M TPO high (08 Feb) 21820 – Mid-profile singles (08 Feb) 21866 – Ext Handle (08 Feb) 21910 – Ext Handle (08 Feb) 21955 – B TPO halfback 21998 – Selling Tail (08 Feb) |
| Down |
| 21699 – L TPO halfback (08 Feb) 21640 – 4-day VAL (29Jan-01Feb) 21581 – Jan Series VWAP 21531 – Buying Tail (31 Jan) 21489 – IB tail mid (31 Jan) 21448 – Buy tail (29 Jan) |
BankNifty Spot: 45970 [ 46892 / 45071 ]
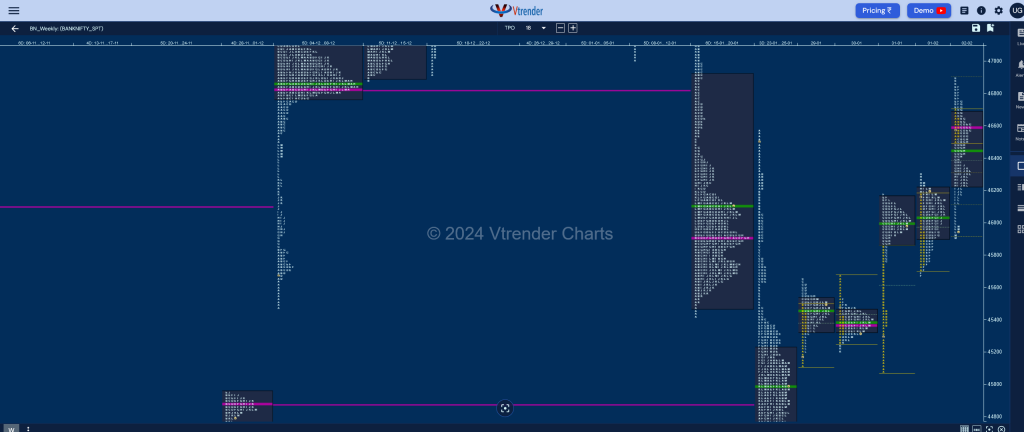
Previous week’s profile represented a ‘b’ shape one with completely lower Value at 44474-44572-45223 recording new lows for the year 2024 at 44429 on 25th Jan taking support just above 30th Nov’s VPOC of 44391 which was also incidentally a ‘b’ shape profile signalling seller exhaustion making way for a bounce back to 45139 into the close and has an initiative selling tail from 46301 to 46580 along with couple of extension handles at 45898 & 45645 which will be the important levels on the upside to watch

BankNifty opened the week with a small but important A period buying tail on Monday at previous value signalling that it wanted to probe higher and went on to tag the immediate extension handle of 45645 but could not sustain above it and left an opposite A period selling tail from 45524 to 45678 on Tuesday as it formed a 2-day balance with value at 45335-45433-45496.
The auction then made new lows for the week at 45071 in an attempt to probe lower at open on Wednesday but was swiftly rejected leaving a fresh initiative buying tail till 45360 and not only swiped through the 2-day value but left another zone of singles from 45760 to 45467 and scaled above the higher extension handle of 45898 from last week while making a high of 46179 and accepted this higher value on Thursday where it formed a Neutral Extreme Day Up after confirming a FA (Failed Auction) at 45668 making a look up into the weekly selling singles from 46301 leaving another 2-day balance with value at 45881-46033-46173.
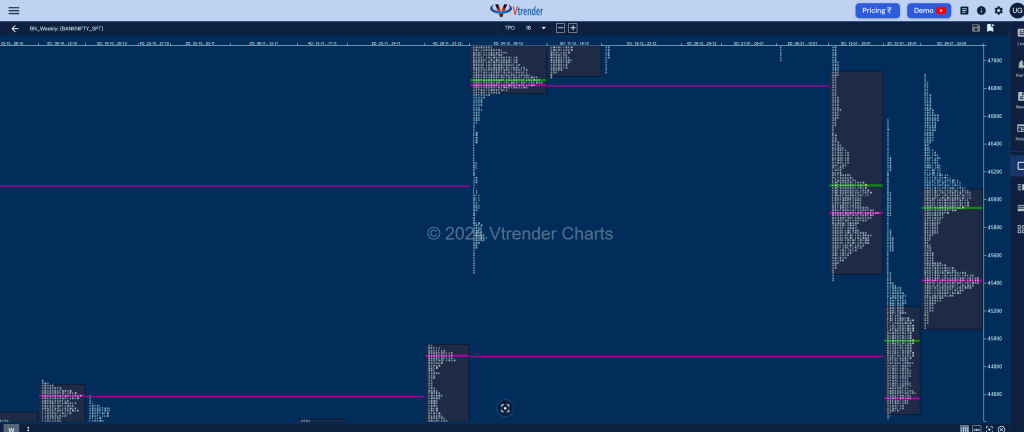
BankNifty then gave a rare follow up to a NeuX profile by opening higher on Friday not only completing the 1 ATR objective of 46387 but went on to scale above previous week’s high while hitting 46699 at the open after which it even made an extension higher to 46892 but stalled right at weekly VAH of 46912 (15-20 Jan) first leaving a responsive selling tail followed by a big liquidation break as it went on to give up all the gains getting back into the 2-day balance almost completing the 80% Rule while making a low of 45901 leaving a NeuX day down. The weekly profile is also a NeuX one but to the upside with mostly higher Value at 45089-45431-45998 and has a low volume zone between the 2 TPO HVNs of 45431 to 46007 which could see some filling up in the coming week if it remains below Friday’s extension handle of 46130.

Click here to view this week’s MarketProfile of BankNifty on Vtrender Charts
Hypos for 05th Feb 2024
| Up |
| 45977 – L TPO singles (02 Feb) 46130 – Ext Handle (02 Feb) 46353 – Jan series VWAP 46531 – G TPO halfback (02 Feb) 46699 – SOC from 02 Feb |
| Down |
| 45941 – Closing tail (02 Feb) 45828 – 2-day anomaly (31Jan-01Feb) 45668 – FA from 01 Feb 45496 – 2-day VAH (29-30 Jan) 45334 – 2-day VAL (29-30 Jan) |
Hypos for 06th Feb 2024
| Up |
| 45785 – VAL from 05 Feb 45952 – VAH from 05 Feb 46130 – Ext Handle (02 Feb) 46353 – Jan series VWAP 46532 – G TPO halfback (02 Feb) |
| Down |
| 45745 – M TPO low (05 Feb) 45615 – PDL 45496 – 2-day VAH (29-30 Jan) 45334 – 2-day VAL (29-30 Jan) 45206 – 2-day buy tail (29-30 Jan) |
Hypos for 07th Feb 2024
| Up |
| 45744 – VAF from 06 Feb 45869 – Selling Tail (06 Feb) 45952 – VAH from 05 Feb 46048 – Weekly IBH 46174 – SOC from 02 Feb 46353 – Jan series VWAP |
| Down |
| 45674 – POC from 06 Feb 45570 – Buying tail (06 Feb) 45467 – Ext Hanlde (31 Jan) 45334 – 2-day VAL (29-30 Jan) 45206 – 2-day buy tail (29-30 Jan) 45019 – Gap Mid point (29 Jan) |
Hypos for 08th Feb 2024
| Up |
| 45837 – POC from 07 Feb 45975 – A TPO halfback 46063 – Sell Tail high (07 Feb) 46174 – SOC from 02 Feb 46305 – TPO HVN (02 Feb) 46431 – SOC from 02 Feb |
| Down |
| 45801 – L halfback (07 Feb) 45670 – PBL from 07 Feb 45570 – Buying tail (06 Feb) 45467 – Ext Hanlde (31 Jan) 45334 – 2-day VAL (29-30 Jan) 45206 – 2-day buy tail (29-30 Jan) |
Hypos for 09th Feb 2024
| Up |
| 45108 – M TPO high (08 Feb) 45227 – Ext Handle (08 Feb) 45330 – SOC from 08 Feb 45441 – dPOC from 08 Feb 45592 – D TPO halfback 45726 – 3-day POC (05-07 Feb) |
| Down |
| 45028 – M TPO halfback 44865 – SOC from 25 Jan 44721 – L TPO halfback (25 Jan) 44572 – VPOC from 25 Jan 44444 – Buying Tail (25 Jan) 44284 – PBL from 30 Nov |
