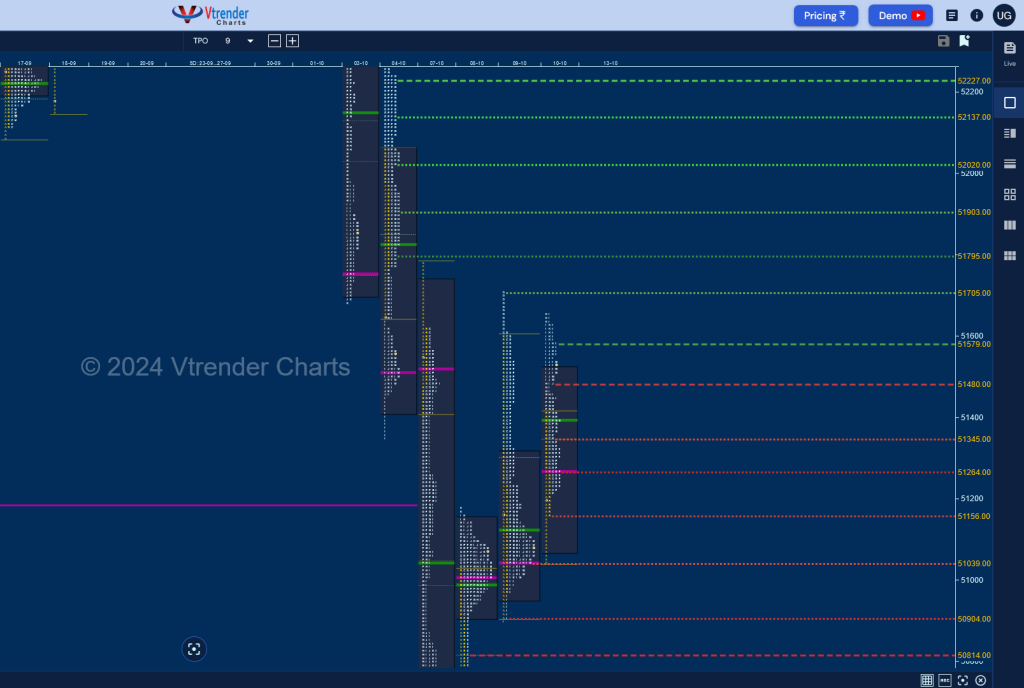
Nifty Spot: 25014 [ 26134 / 24966 ] Trend Down
Previous week’s report ended with this ‘Value was completely higher at 25849-25933-26094 with an extension handle at 26114 and a zone of singles till 26151 which will be the immediate support to watch for in the coming week as it looks to fill up the current week’s irregular profile with the downside objectives being the prominent weekly POC of 25933 & the 2 ATR objective of 25829 whereas on the upside the FA of 26277 remains the swing reference‘
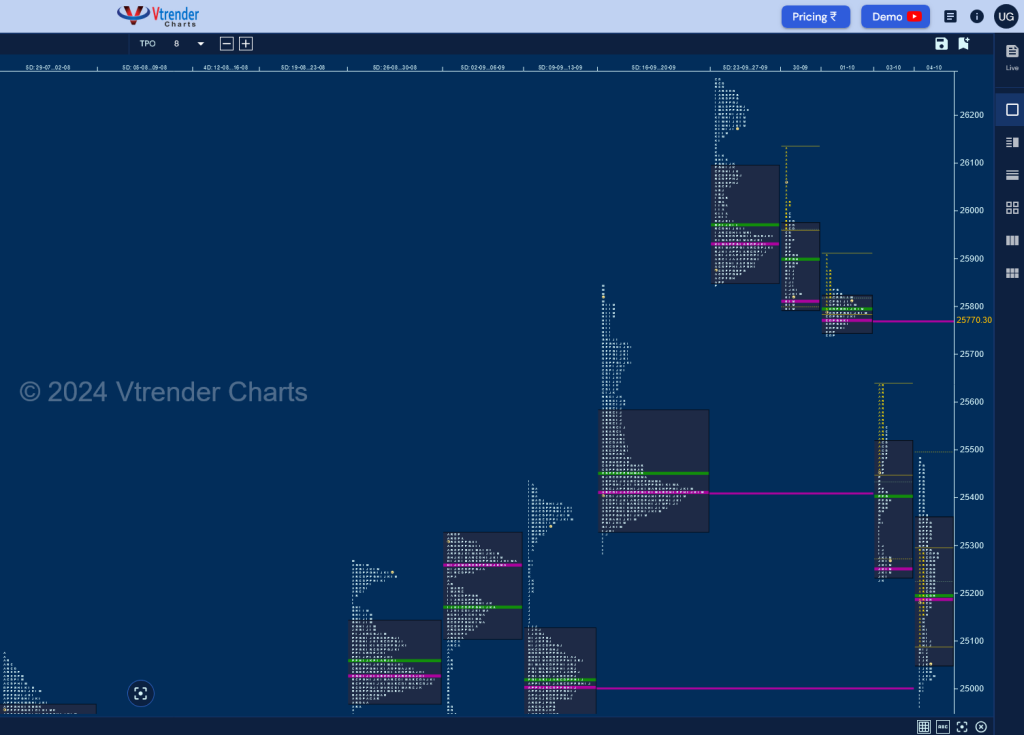
Monday – 25810 [ 26134 / 25794 ] – Trend (Down)
Tuesday – 25797 [ 25907 / 25739 ] – Normal Variation (Down)
Wednesday – Holiday
Thursday – 25250 [ 25639 / 25230 ] Trend (Down)
Friday – 25014 [ 25485 / 24966 ] – Neutral Extreme (Down)
Nifty formed a Trend Down weekly profile as sellers remained in complete control on all day resulting in 2 Trend Day profiles and a Neutral Extreme forming overlapping to lower value at 25332-25810-26134 and the close around the lows suggest that this imbalance could continue in the coming week too.
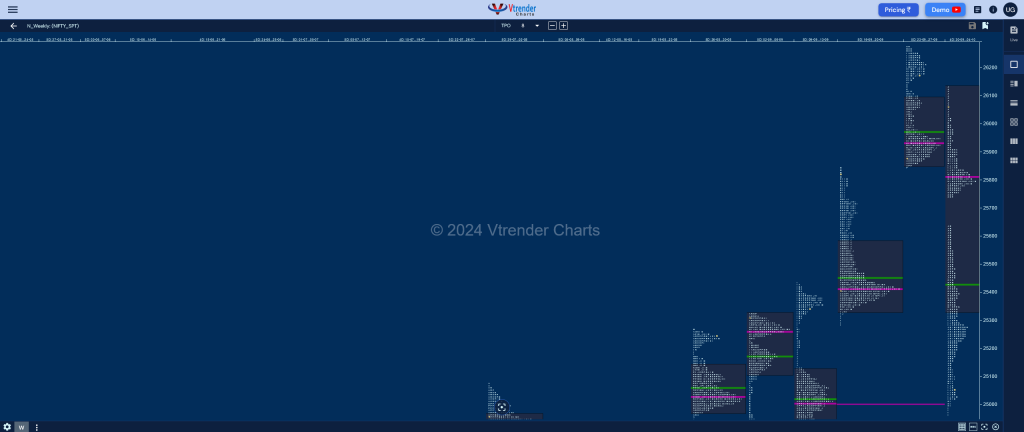
Click here to view this week’s MarketProfile of Nifty on Vtrender Charts
Hypos for 07th Oct– 25014 [ 25485 / 24966 ] – Neutral Extreme (Down)
| Up |
| NA |
| Down |
| NA |
Hypos for 08th Oct – 24795 [ 25143 / 24694 ] Trend (Down)
| Up |
| NA |
| Down |
| NA |
Hypos for 09th Oct – 25013 [ 25044 / 24756 ] Normal Variation (Up)
| Up |
| 25025 – M TPO h/b (08 Oct) 25086 – Selling Tail (07 Oct) 25143 – Weekly IBH 25190 – VPOC (04 Oct) 25226 – 04 Oct Halfback 25274 – SOC (04 Oct) |
| Down |
| 25009 – M TPO low 24967 – Monthly IBL 24910 – POC (08 Oct) 24851 – B TPO h/b (08 Oct) 24802 – Buy Tail (08 Oct) 24756 – Buy tail (Oct) |
Hypos for 10th Oct – 24982 [ 25234 / 24947 ] – Neutral Extreme (Down)
| Up |
| 24995 – M TPO h/b (09 Oct) 25041 – SOC (09 Oct) 25090 – 09 Oct Halfback 25143 – Weekly IBH 25199 – SOC (09 Oct) 25234 – PDH 25274 – SOC (04 Oct) |
| Down |
| 24967 – Monthly IBL 24910 – POC (08 Oct) 24851 – B TPO h/b (08 Oct) 24802 – Buy Tail (08 Oct) 24756 – Buy tail (Oct) 24694 – Weekly IBL 24625 – SOC (19 Aug) |
Hypos for 11th Oct – 24998 [ 25134 / 24979 ] Neutral Extreme (Down)
| Up |
| 24999 – M TPO h/b (10 Oct) 25037 – PBH (10 Oct) 25083 – SOC (10 Oct) 25134 – FA (10 Oct) 25199 – SOC (09 Oct) 25234 – Swing High (09 Oct) 25274 – SOC (04 Oct) |
| Down |
| 24995 – IBL (10 Oct) 24967 – Monthly IBL 24910 – VPOC (08 Oct) 24862 – 1 ATR (FA 25134) 24802 – Buy Tail (08 Oct) 24756 – Buy tail (Oct) 24694 – Weekly IBL |
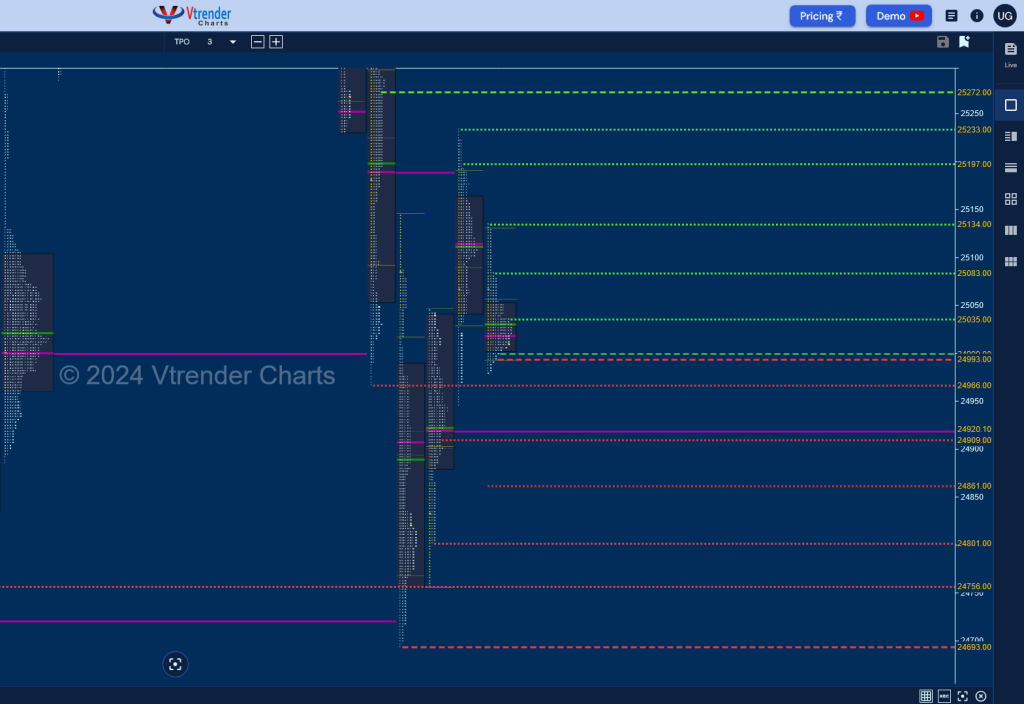
BankNifty Spot: 51462 [ 53726 / 51347 ] Double Distribution Trend (Down)
Previous week’s report ended with this ‘The weekly profile is a nice Gaussian Curve with completely higher value at 53941-54071-54201 but has closed below the value hinting at a probe into the prior week’s profile and a test of the daily VPOCs of 52944 & 52798 and the weekly one at 52221‘
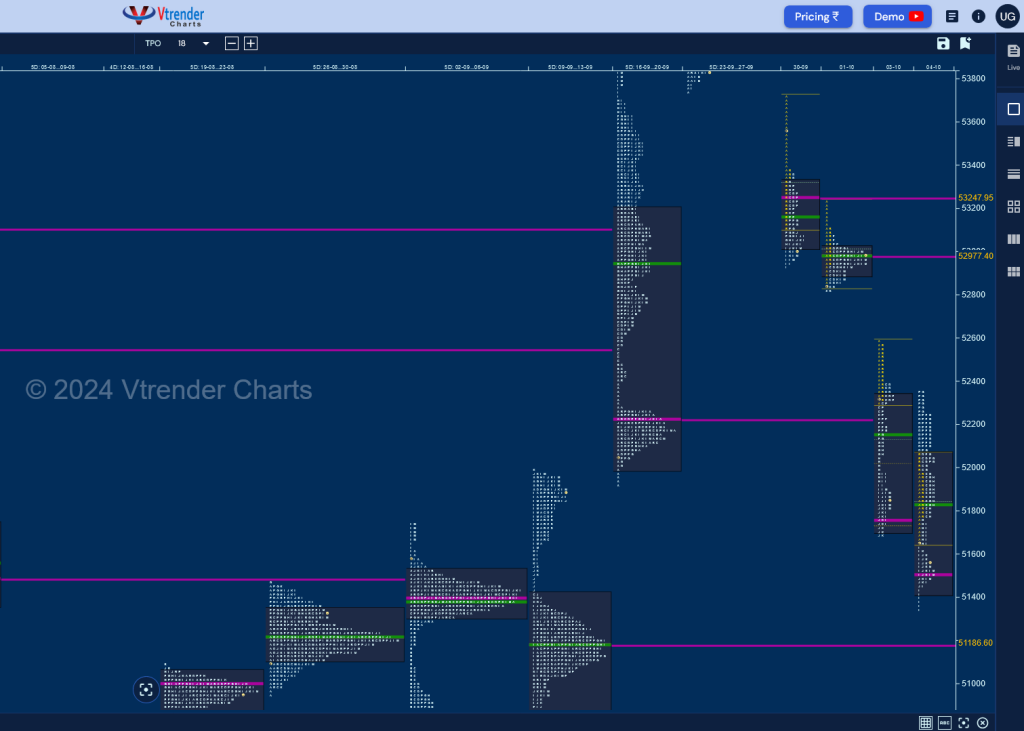
Monday – 52978 [ 53726 / 52926 ] – Normal Variation (Down)
Tuesday – 52922 [ 53235 / 52817 ] – Normal (‘b’ shape)
Wednesday – Holiday
Thursday – 51845 [ 52583 / 51683 ] – Trend (Down)
Friday – 51462 [ 52358 / 51347 ] – Neutral Extreme (Down)
BankNifty as expected gave an imbalance weekly profile to the downside as it not only tagged the weekly VPOC of 52221 but went on to hit lows of 51347 into the close forming completely lower value at 52099-53001-53728 and looks set to continue the downmove in the coming week towards the immediate VPOC of 51186 & the September lows of 50369
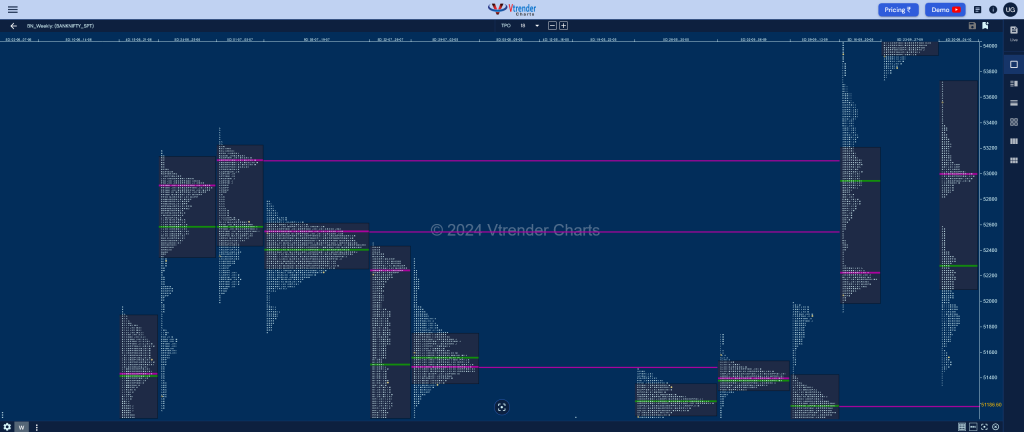
Click here to view this week’s MarketProfile of BankNifty on Vtrender Charts
Hypos for 07th Oct – 51462 [ 52358 / 51347 ] – Neutral Extreme (Down)
| Up |
| NA |
| Down |
| NA |
Hypos for 08th Oct – 50479 [ 51784 / 50194 ] – Trend (Down)
| Up |
| NA |
| Down |
| NA |
Hypos for 09th Oct – 51021 [ 51176 / 50466 ] – Normal (‘p’ shape)
| Up |
| 51053 – M TPO h/b (08 Oct) 51149 – VAH (08 Oct) 51255 – PBH (07 Oct) 51347 – Monthly IBL 51416 – IBL (07 Oct) 51568 – PBH (07 Oct) |
| Down |
| 51010 – POC (08 Oct) 50909 – PBL (08 Oct) 50821 – 08 Oct Halfback 50682 – A TPO h/b (08 Oct) 50599 – IB tail mid (08 Oct) 50466 – Buy tail (Oct) |
Hypos for 10th Oct – 51007 [ 51707 / 50903 ] – Neutral
| Up |
| 51045 – POC (09 Oct) 51144 – PBH (09 Oct) 51305 – 09 Oct Halfback 51443 – SOC (09 Oct) 51575 – D TPO h/b (09 Oct) 51707 – FA (09 Oct) |
| Down |
| 50974 – Tail (09 Oct) 50821 – 08 Oct Halfback 50682 – A TPO h/b (08 Oct) 50599 – IB tail mid (08 Oct) 50466 – Buy tail (Oct) 50323 – Buy tail (07 Oct) |
Hypos for 11th Oct – 51531 [ 51659 / 51047 ] – Normal Variation (Up)
| Up |
| 51583 – SOC (10 Oct) 51707 – FA (09 Oct) 51799 – H TPO h/b (04 Oct) 51911 – C TPO h/b (04 Oct) 52024 – SOC (04 Oct) 52137 – E TPO h/b (04 Oct) 52228 – F TPO h/b (04 Oct) |
| Down |
| 51480 – Ext Handle (10 Oct) 51535 – 10 Oct Halfback 51266 – POC (10 Oct) 51160 – Buy Tail (10 Oct) 51045 – VPOC (09 Oct) 50905 – Tail (09 Oct) 50821 – 08 Oct Halfback |
