Nifty Oct F: 19740 [ 19749 / 19585 ]

| Open Type |
|---|
| OAOR (Open Auction Out of Range) |
| Volumes of 11,263 contracts |
| Initial Balance |
|---|
| 72 points (19657 – 19585) |
| Volumes of 25,734 contracts |
| Day Type |
|---|
| DD (Up) – 164 points |
| Volumes of 99,715 contracts |
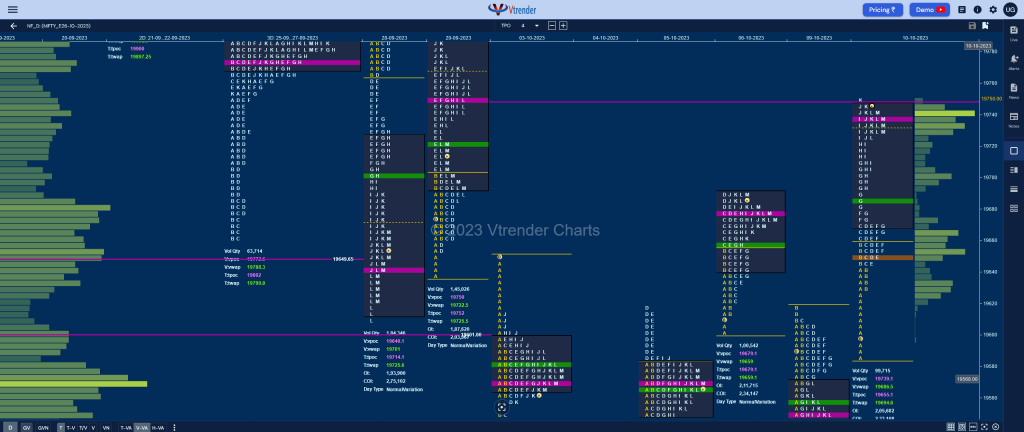
NF opened higher well above previous VAH of 19571 and went on to scale above PDH of 19617 leaving an initiative buying tail along with an extension handle at 19640 in the Initial Balance (IB) while making a high of 19657 stalling just below 06th Oct’s VWAP of 19659.
The auction then made a C side extension to 19668 followed by similar highs in the D & E TPOs where it also confirmed a PBL at 19646 as the test of day’s VWAP was successfully defended indicating buyers being in control and they confirmed the same by making a fresh RE in the F period followed by another extension handle at 19677 in the G helping it to tag the VPOC of 19679 and repair the ledge from 06th Oct while hitting new highs of 19709.
The OTF (One Time Frame) to the upside continued till the K TPO as NF completed the 2 IB target of 19729 and stopped just below 29th Sep’s VPOC of 19750 with the dPOC also shifting higher to 19739 leaving a Double Dsitribution Trend Day Up with today’s VWAP of 19686 being the swing support going forward.
Click here to view the latest profile in NF on Vtrender Charts
Daily Zones
- Largest volume (POC) was traded at 19739 F and VWAP of the session was at 19687
- Value zones (volume profile) are at 19619-19739-19748
- HVNs are at 19569** / 19750 (** denotes series POC)
Monthly Zones
- The settlement day Roll Over point (October 2023) is 19635
- The VWAP & POC of Sep 2023 Series is 19736 & 19672 respectively
- The VWAP & POC of Aug 2023 Series is 19440 & 19424 respectively
- The VWAP & POC of Jul 2023 Series is 19600 & 19430 respectively
Business Areas for 11th Oct 2023
| Up |
| 19750 – VPOC from 29 Sep 19785 – K TPO POC (29 Sep) 19833 – Selling Tail (28 Sep) 19893 – 2-day VPOC (21-22 Sep) 19943 – 2-day VAH (21-22 Sep) – |
| Down |
| 19724 – Closing PBL (10 Oct) 19686 – DD VWAP (10 Oct) 19651 – HVN from 10 Pct 19611 – Singles from 09 Oct 19584 – Singles mid (10 Oct) 19550 – VPOC from 09 Oct |
BankNifty Oct F: 44530 [ 44620 / 44080 ]

| Open Type |
|---|
| OAIR (Open Auction In Range) |
| Volumes of 15,307 contracts |
| Initial Balance |
|---|
| 195 points (44275 – 44080) |
| Volumes of 26,495 contracts |
| Day Type |
|---|
| DD (Up) – 540 points |
| Volumes of 1,38,227 contracts |
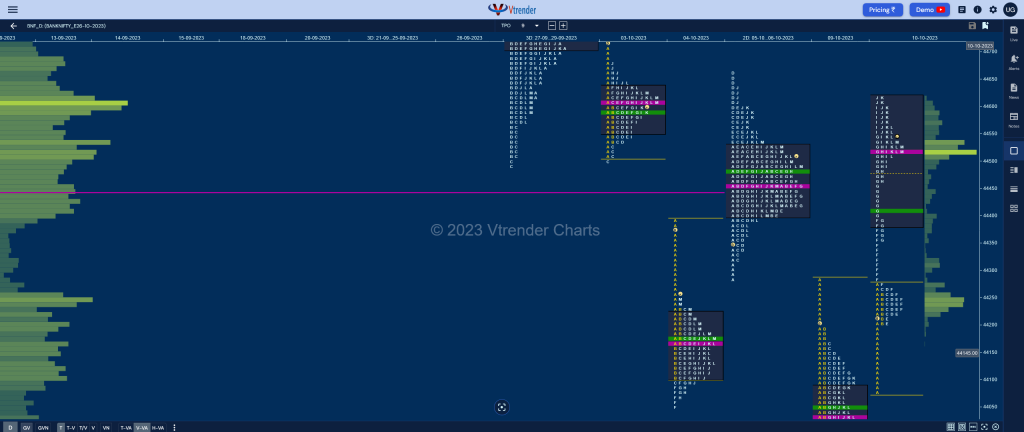
BNF opened higher by exactly 200 points but could not get above PDH of 44288 triggering a move back into previous Value which was swiftly rejected at 44080 as it remained above 44200 for the rest of the IB forming a narrow 195 point range which included an initiative buying tail from 44206 to 44080 after which it contracted further within a range of 70 odd points till the E period where it made an attempt to probe into the A singles but could only manage 44201.
The buyers then took advantage of lack of supply as it made a RE to the upside with the help of an extension handle at 44275 in the F TPO and followed it with another one at 44396 in the G where it swiped through the 2-day Value (05-06 Oct) completing the 80% Rule while making a high of 44542.
The auction took a pause in the H period staying in a narrow range from 44468 ro 44527 and resumed the upside probe in the I & J TPOs where it tagged previous week’s prominent POC of 44611 while making a high of 44620 and formed poor highs in the K representing exhaustion which triggered a small retracement down to 44510 into the close with the dPOC also shifting around it at 44516 leaving a Double Distribution (DD) Trend Day Up.
Click here to view the latest profile in BNF on Vtrender Charts
Daily Zones
- Largest volume (POC) was traded at 44516 F and VWAP of the session was at 44412
- Value zones (volume profile) are at 44380-44516-44619
- HVNs are at 44413 / 44535** / 44611 / 44849 (** denotes series POC)
- BNF has confirmed a FA at 44400 on 06/10 and the 1 ATR objective comes to 44815. This FA got negated on 09/10 and hit the 1 ATR target of 43986 on the downside. The 2 ATR marker comes to 43571
- BNF confirmed a FA at 44491 on 27/09 and tagged the 1 ATR objective of 44928 on the same day. This FA got negated on 04/10 and went on to tag the 1 ATR downside target of 44054
Monthly Zones
- The settlement day Roll Over point (October 2023) is 44595
- The VWAP & POC of Sep 2023 Series is 44808 & 44438 respectively
- The VWAP & POC of Aug 2023 Series is 44493 & 44550 respectively
- The VWAP & POC of Jul 2023 Series is 45414 & 45075 respectively
Business Areas for 11th Oct 2023
| Up |
| 44535 – L TPO POC (10 Oct) 44635 – Selling tail (06 Oct) 44750 – 1 ATR from 44319 44849 – 2-day VPOC (28-29 Sep) 44998 – Swing High (28 Sep) 45091 – 3-day POC (21-25 Sep) |
| Down |
| 44510 – Closing PBL (10 Oct) 44412 – DD VWAP (10 Oct) 44317 – Mid-profile singles (10 Oct) 44201 – Buying Tail (10 Oct) 44105 – Singles mid (10 Oct) 44029 – VPOC from 09 Oct |
You can check the monthly charts & other swing levels for both Nifty & BankNifty here & for the weekly charts & analysis, please click here.
