Nifty Oct F: 19618 [ 19670 / 19528 ]

| Open Type |
|---|
| OAOR (Open Auction Out of Range) |
| Volumes of 15,594 contracts |
| Initial Balance |
|---|
| 71 points (19598 – 19527) |
| Volumes of 37,971 contracts |
| Day Type |
|---|
| Double Distribution (DD) – 143 points |
| Volumes of 1,16,100 contracts |
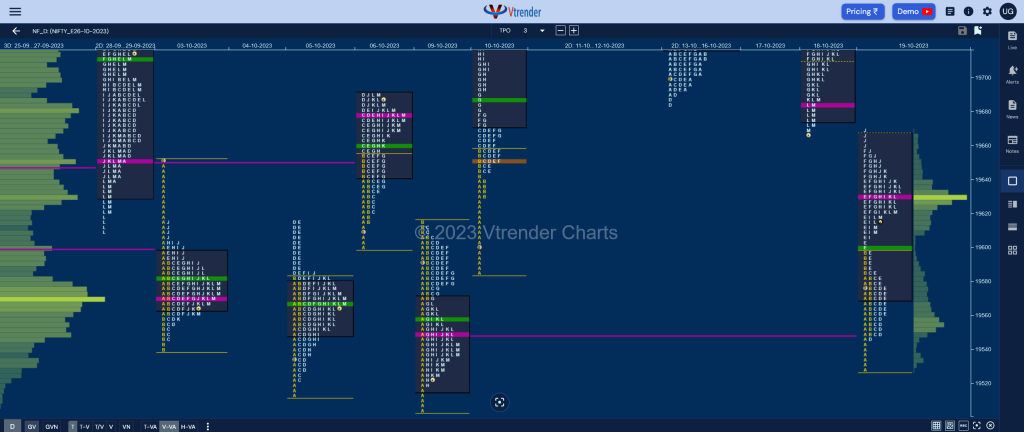
NF opened with a gap down of 108 points and went on to tag the 09th Oct VPOC of 19550 while making a low of 19527 in the A period taking support right above that day’s initiative singles from 19522 after which it went on to make new highs for the day at 19597 in the B TPO leaving small tails at both ends of the IB.
The auction then tested the upside tail with a C side probe to 19586 getting rejected triggering a move lower in the D where it broke into the A period tail but left a PBL at 19545 indicating supply not adding in this zone and this led to an extension handle at 19597 in the E TPO which was followed by new highs of 19657 in the F.
The G & H periods then saw consolidation forming inside bars followed by NF making a probe lower in the I TPO which got stopped at 19606 as the buyers came back to defend and caused a fresh RE in the J where it completed the 2 IB objective of 19669 to the dot but could not sustain leaving a responsive selling tail just below previous month’s POC of 19672 and gave a pull back down to 19608 into the close leaving a Double Distribution Trend Up profile with completely lower Value and tails at both ends.
Click here to view the latest profile in NF on Vtrender Charts
Weekly Settlement (13th to 19th Oct) : 19618 [ 19853 / 19527 ]

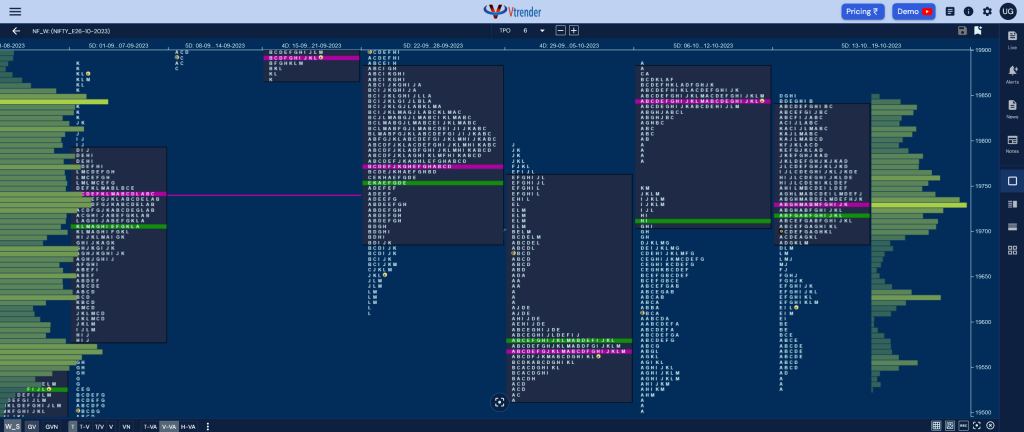
The weekly profile is a Neutral Extreme one to the downside which started with a tag of the first of the daily VPOCs of 19739 (as mentioned in previous settlement report) but left a FA at 19685 triggering a move to the 1 ATR objective of 19818 after which it made multiple attempts to get above preivous week’s prominent POC of 19848 but ended up forming a ledge which confirmed supply being adamant in this zone and this in turn led to a trending move lower over the last 2 days as NF went on to tag the lower VPOC of 19550 but found some demand coming back as it left a small buying tail from 19545 to 19528 and gave a bounce back to 19669 leaving a DD on the last day closing around the dPOC of 19629. Value for the week was mostly inside previous one at 19691-19730-19841 as the auction did a good job of filling up the zone between 19668 to 19848 before giving a fresh probe lower which can continue in the coming week towards the lower VPOC of 19428 & HVN of 19386 from 04th Oct with the swing reference on the upside now being at this week’s VWAP of 19719.
Daily Zones
- Largest volume (POC) was traded at 19629 F and VWAP of the session was at 19600
- Value zones (volume profile) are at 19571-19629-19667
- HVNs are at 19569 / 19750 / 19848** (** denotes series POC)
- NF confirmed a FA at 19685 on 13/10 and tagged the 1 ATR objective of 19818 on 17/10. This FA got revisited on 18/10 and has closed below so the 1 ATR target lower comes to 19552
Monthly Zones
- The settlement day Roll Over point (October 2023) is 19635
- The VWAP & POC of Sep 2023 Series is 19736 & 19672 respectively
- The VWAP & POC of Aug 2023 Series is 19440 & 19424 respectively
- The VWAP & POC of Jul 2023 Series is 19600 & 19430 respectively
Business Areas for 20th Oct 2023
| Up |
| 19629 – dPOC from 19 Oct 19657 – PBH from 19 Oct 19685 – VPOC from 18 Oct 19719 – NeuX Weekly VWAP 19742 – DD VWAP (18 Oct) 19777 – Ext Handle (18 Oct) |
| Down |
| 19610 – I TPO POC (19 Oct) 19587 – SOC from 19 Oct 19554 – HVN from 19 Oct 19527 – PDL 19505 – Swing Low (09 Oct) 19460 – LVN from 04 Oct |
BankNifty Oct F: 43845 [ 44117 / 43684 ]

| Open Type |
|---|
| OAOR (Open Auction Out of Range) |
| Volumes of 18,126 contracts |
| Initial Balance |
|---|
| 213 points (44117 – 43684) |
| Volumes of 42,032 contracts |
| Day Type |
|---|
| 3-1-3 (Normal Variation) – 433 points |
| Volumes of 1,42,688 contracts |
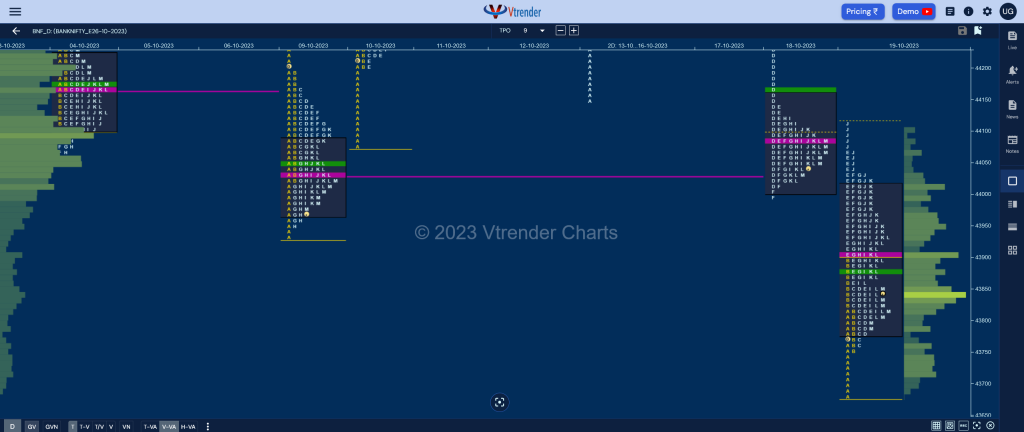
BNF also opened with a big gap down of 283 points resulting in new lows for the series as it went on to hit the 2 ATR objective of 43693 from the 3-day POC of 44405 while making a low of 43684 and saw some profit booking by the sellers along with some laggard shorts getting trapped which triggered a short covering bounce back into previous day’s range & value with the help of an extension handle at 43896 in the E period.
The auction negated the extension handle in a retracement move in the G TPO and made lower lows of 43817 in the I where it left a PBL at day’s VWAP where it saw another round of short covering making a fresh RE in the J period where it made a look up above the yPOC of 44090 while making a high of 44117 but was swiftly rejected signalling the return of the higher timeframe sellers.
BNF then went on to retrace the entire move higher from I making a low of 43785 into the close leaving a 3-1-3 profile for the day with completely lower Value and tails at both the ends with today’s POC of 43908 being the opening reference for the next session below which it has good chance not only to test the buying tail but going for new lows of 43576 & 43454.
Click here to view the latest profile in BNF on Vtrender Charts
Daily Zones
- Largest volume (POC) was traded at 43908 F and VWAP of the session was at 43883
- Value zones (volume profile) are at 43782-43908-44014
- HVNs are at 44413** / 44535 / 44611 / 44849 (** denotes series POC)
Monthly Zones
- The settlement day Roll Over point (October 2023) is 44595
- The VWAP & POC of Sep 2023 Series is 44808 & 44438 respectively
- The VWAP & POC of Aug 2023 Series is 44493 & 44550 respectively
- The VWAP & POC of Jul 2023 Series is 45414 & 45075 respectively
Business Areas for 20th Oct 2023
| Up |
| 43865 – L TPO VWAP (19 Oct) 43950 – HVN from 19 Oct 44069 – Selling tail (19 Oct) 44166 – VWAP from 18 Oct 44283 – Ext Handle (18 Oct) 44365 – SOC from 18 Oct |
| Down |
| 43839 – Closing HVN (19 Oct) 43750 – Buying Tail (19 Oct) 43684 – Weekly IBL 43576 – Monthly 1.5 IB 43454 – 1 ATR (VWAP 44166) 43378 – 2 ATR (yPOC 44090) |
You can check the monthly charts & other swing levels for both Nifty & BankNifty here & for the weekly charts & analysis, please click here.
