


Decode the markets with confidence
Start your journey with Vtrender!
Forum
Market Profile Analysis dated 10th Jul 2025
Daily MarketProfile Analysis of NF & BNF along with Business Areas for next session
Read More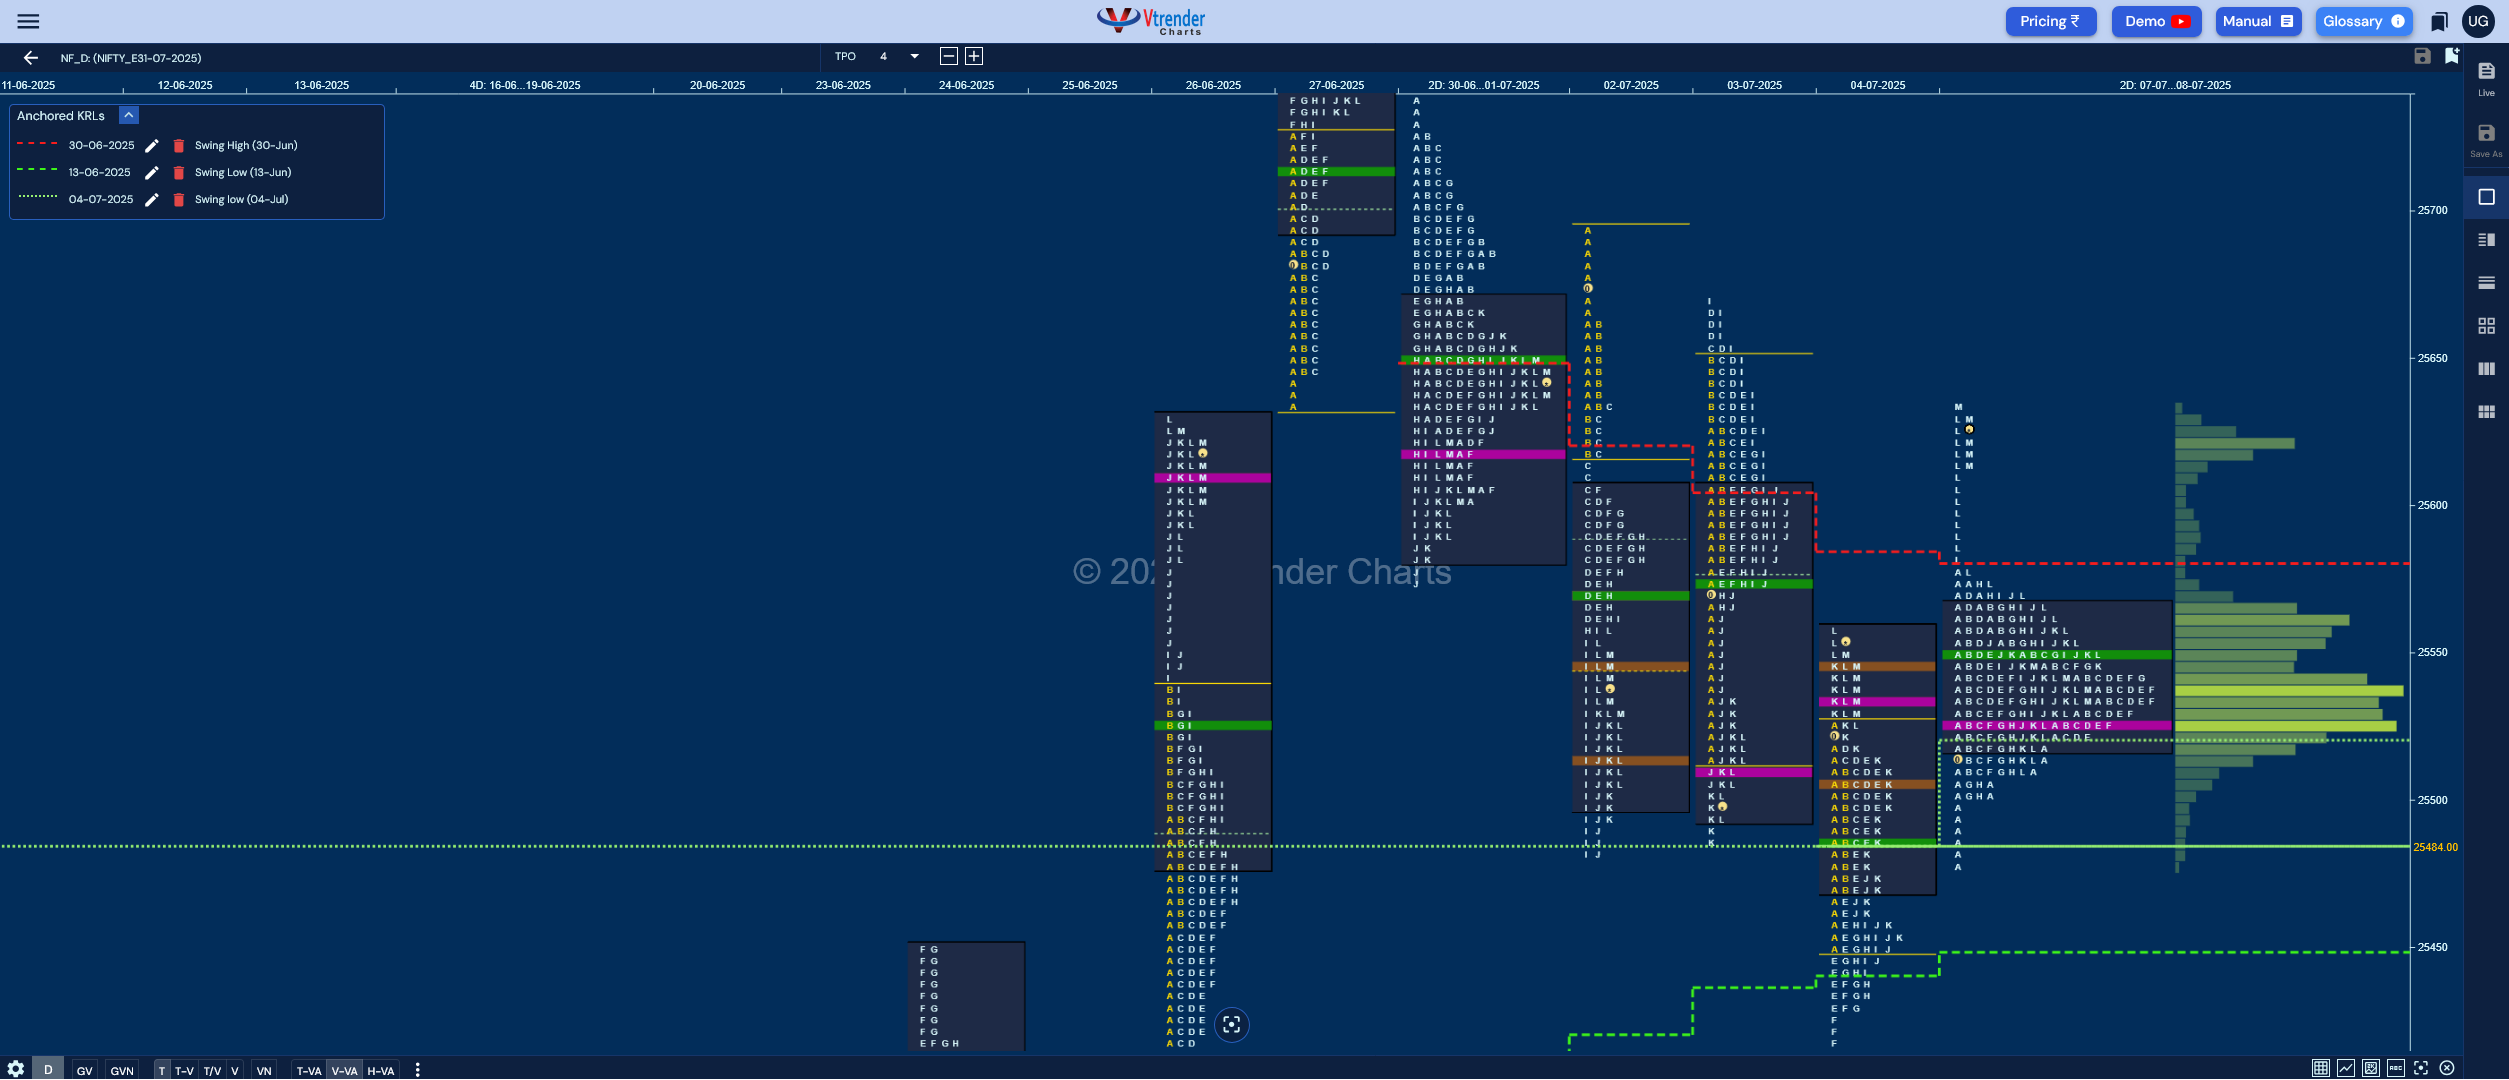
Market Profile Analysis dated 09th Jul 2025
Daily MarketProfile Analysis of NF & BNF along with Business Areas for next session
Read More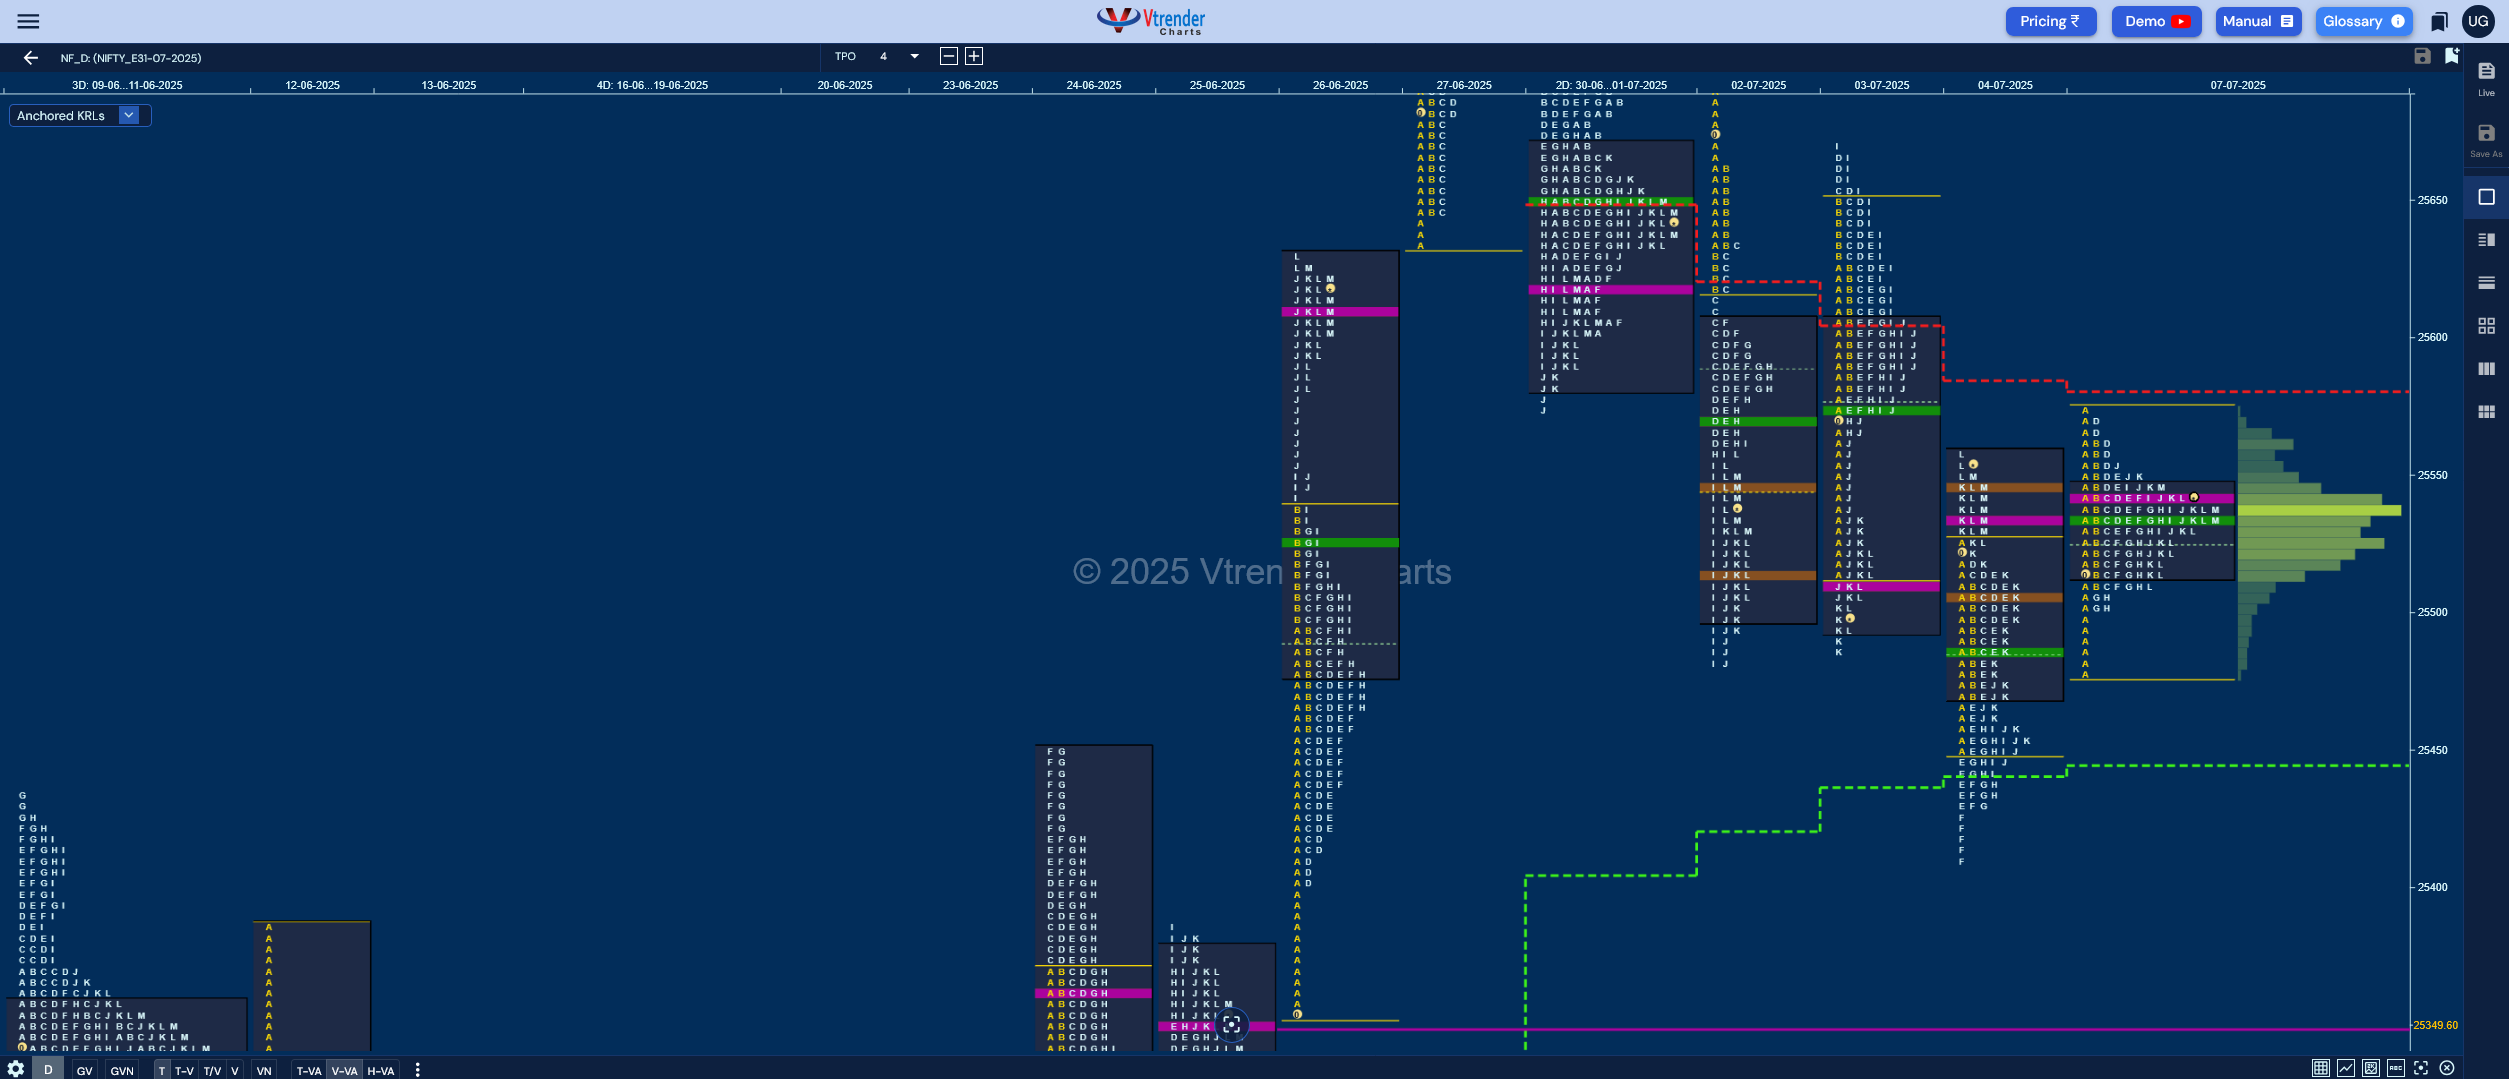
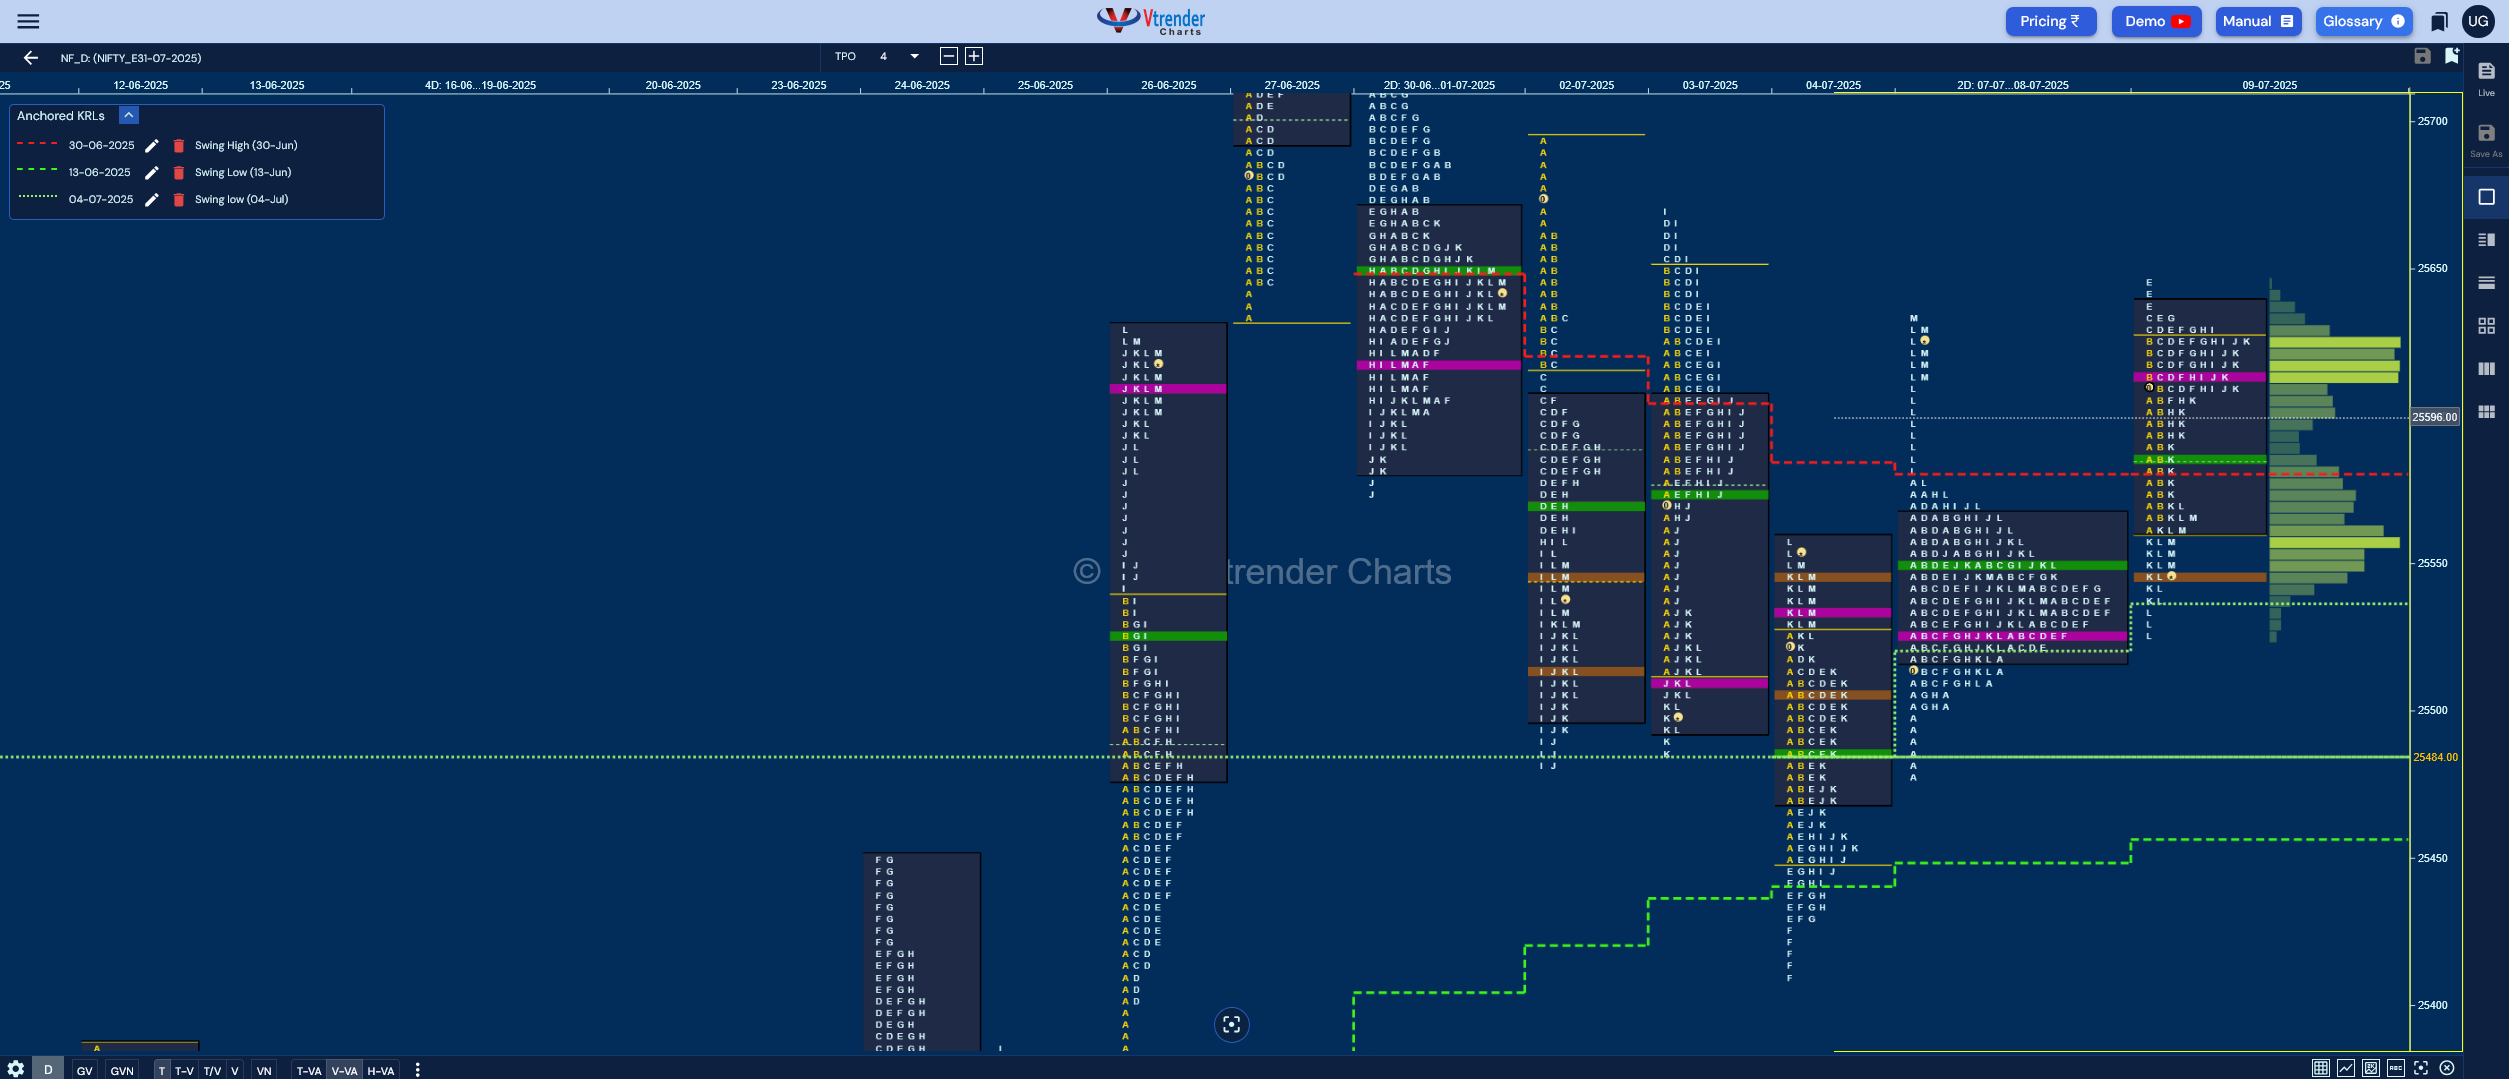
Market Profile Analysis dated 08th Jul 2025
Daily MarketProfile Analysis of NF & BNF along with Business Areas for next session
Read More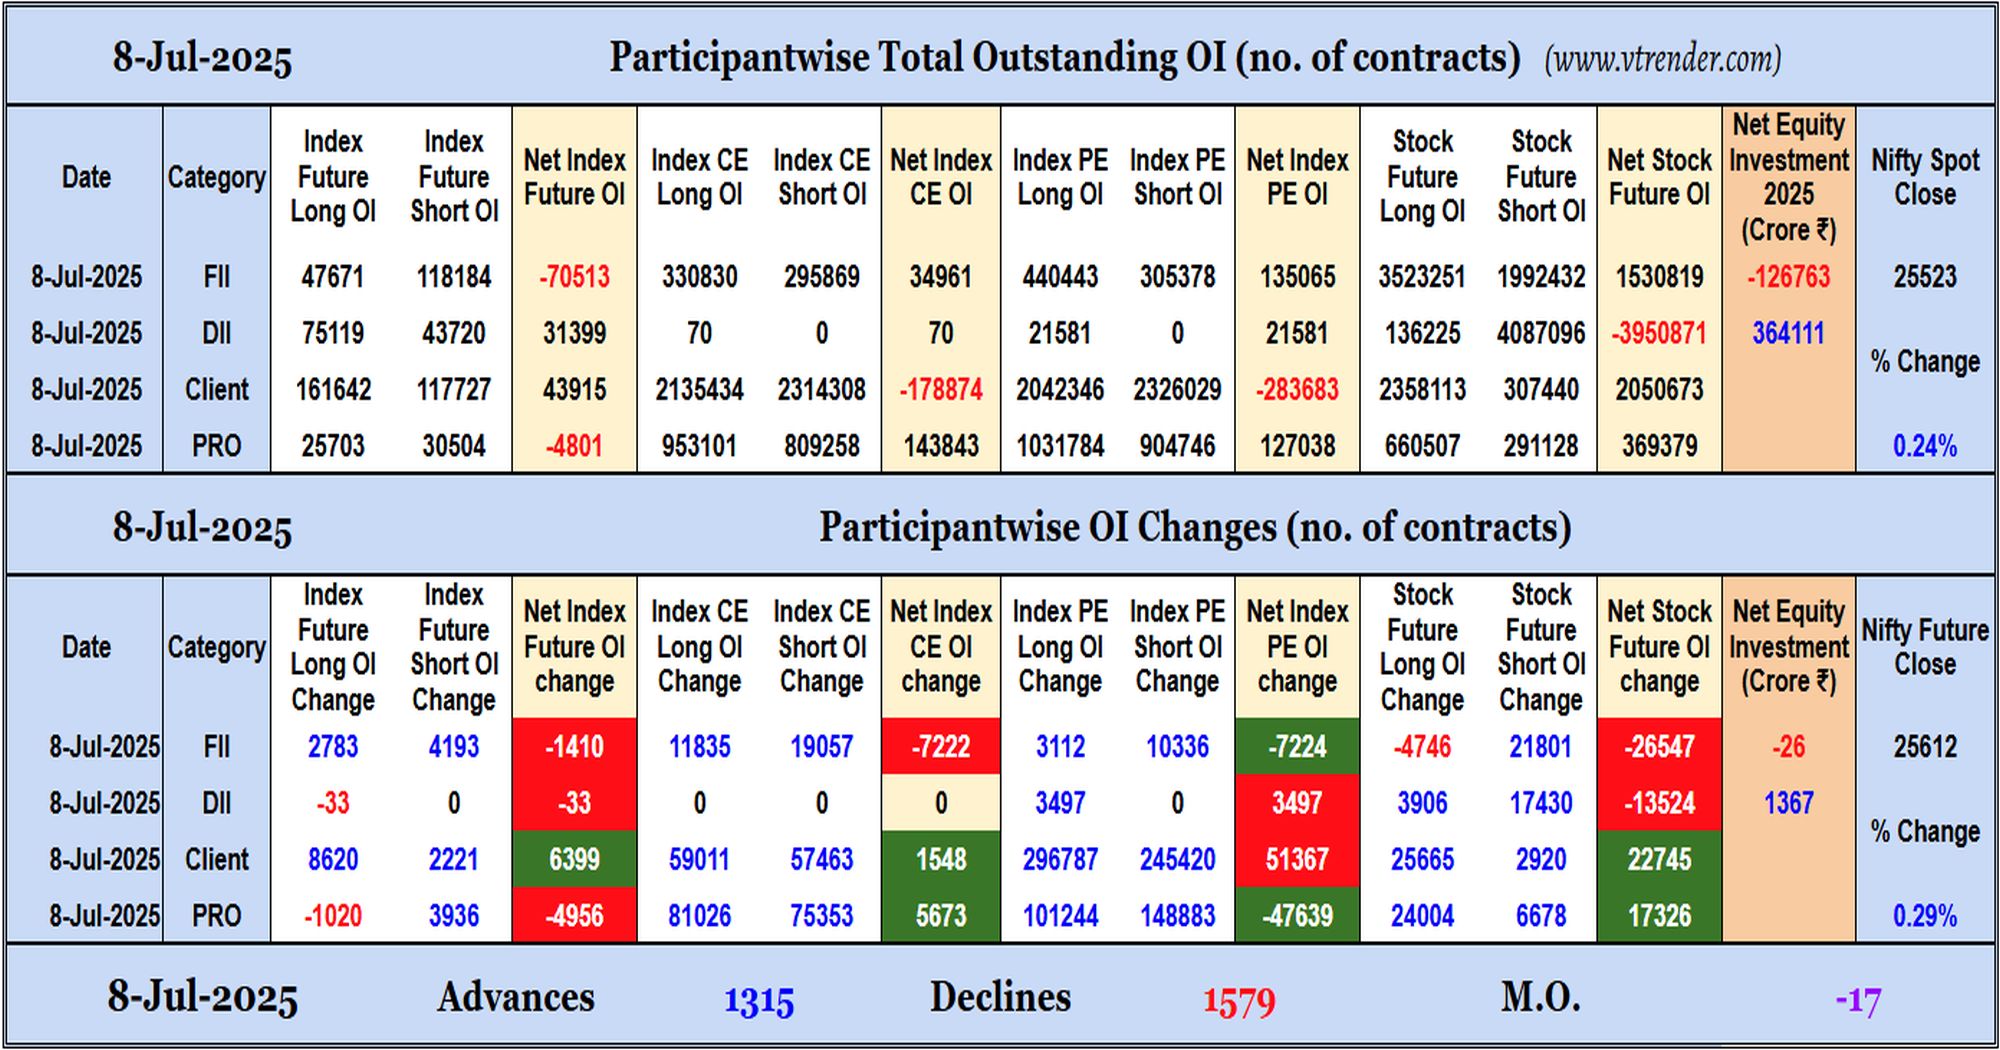
Participantwise Open Interest (Daily changes) - 8th JUL 2025
FIIs have added net shorts in Index Futures, Stocks Futures, Index CE and Index PE. They were net sellers in equity segment too.
Read More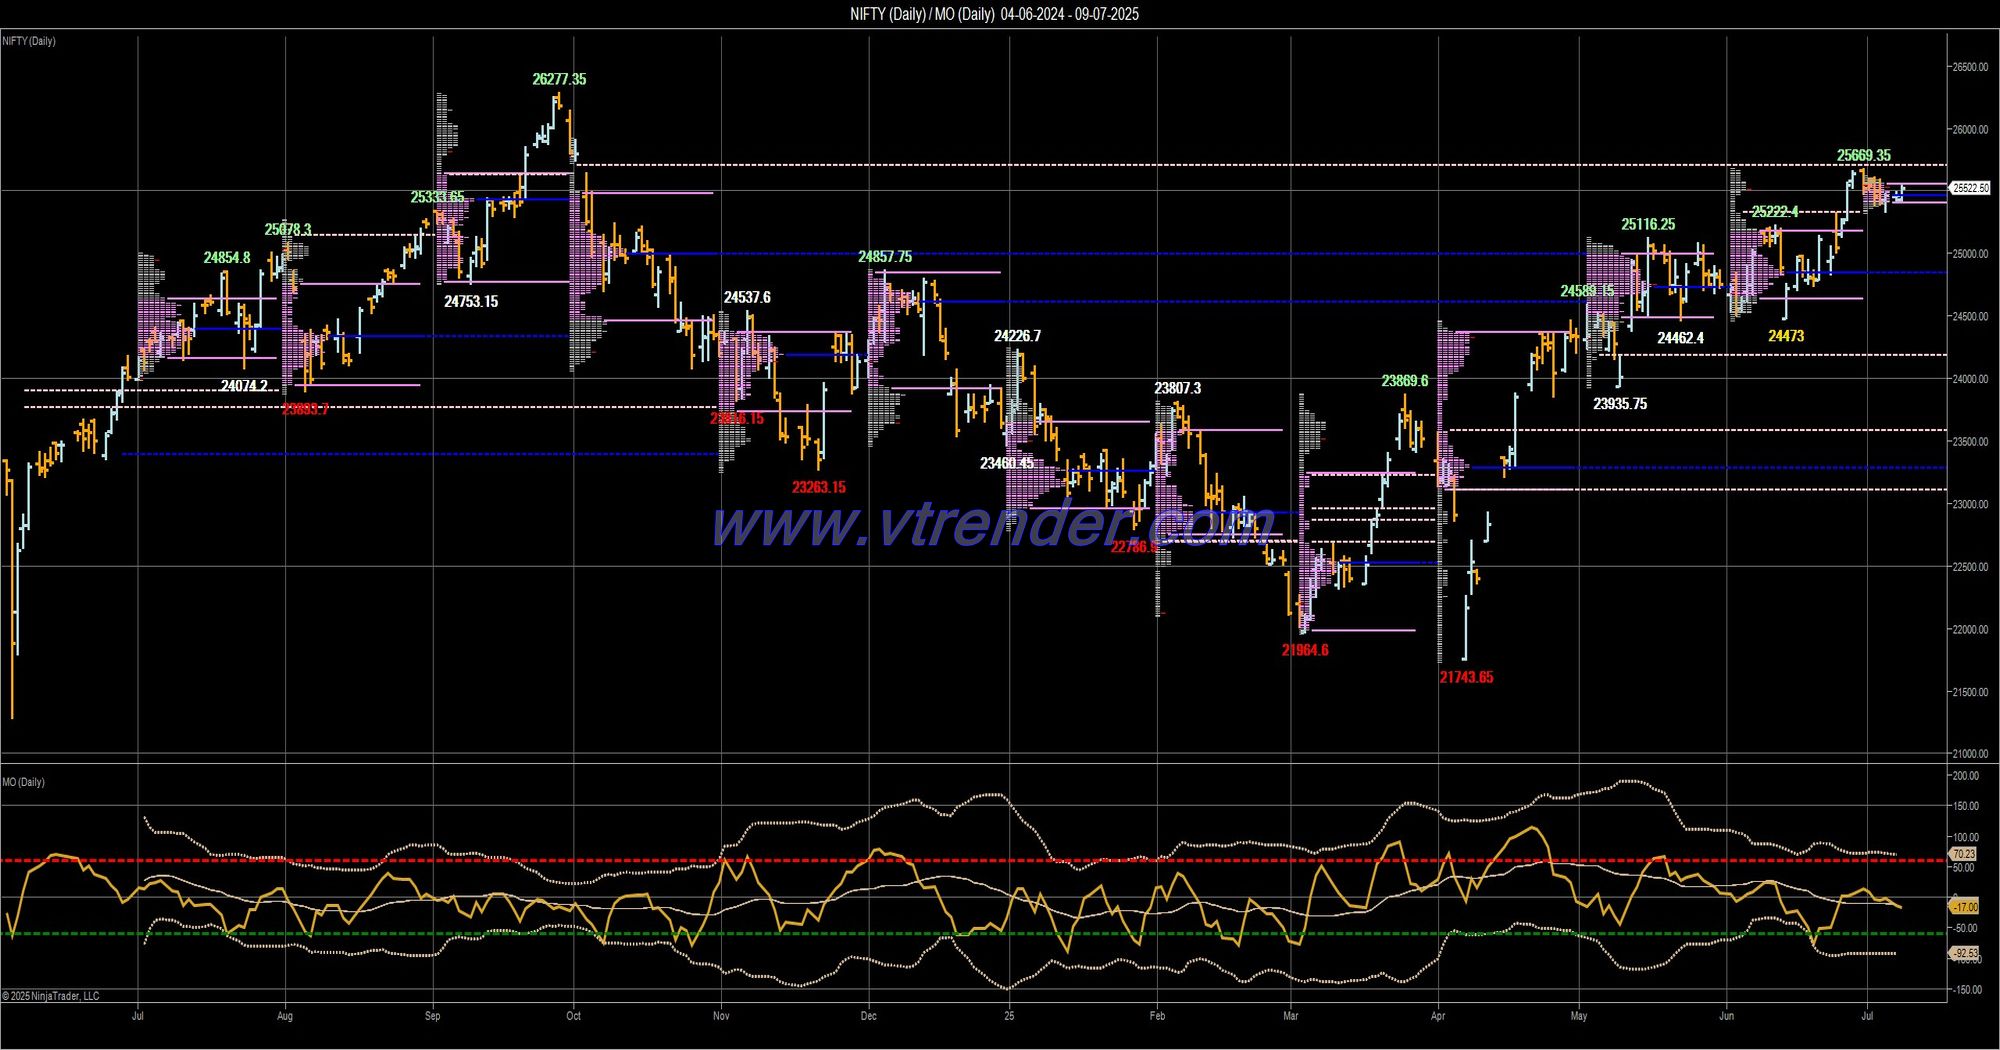
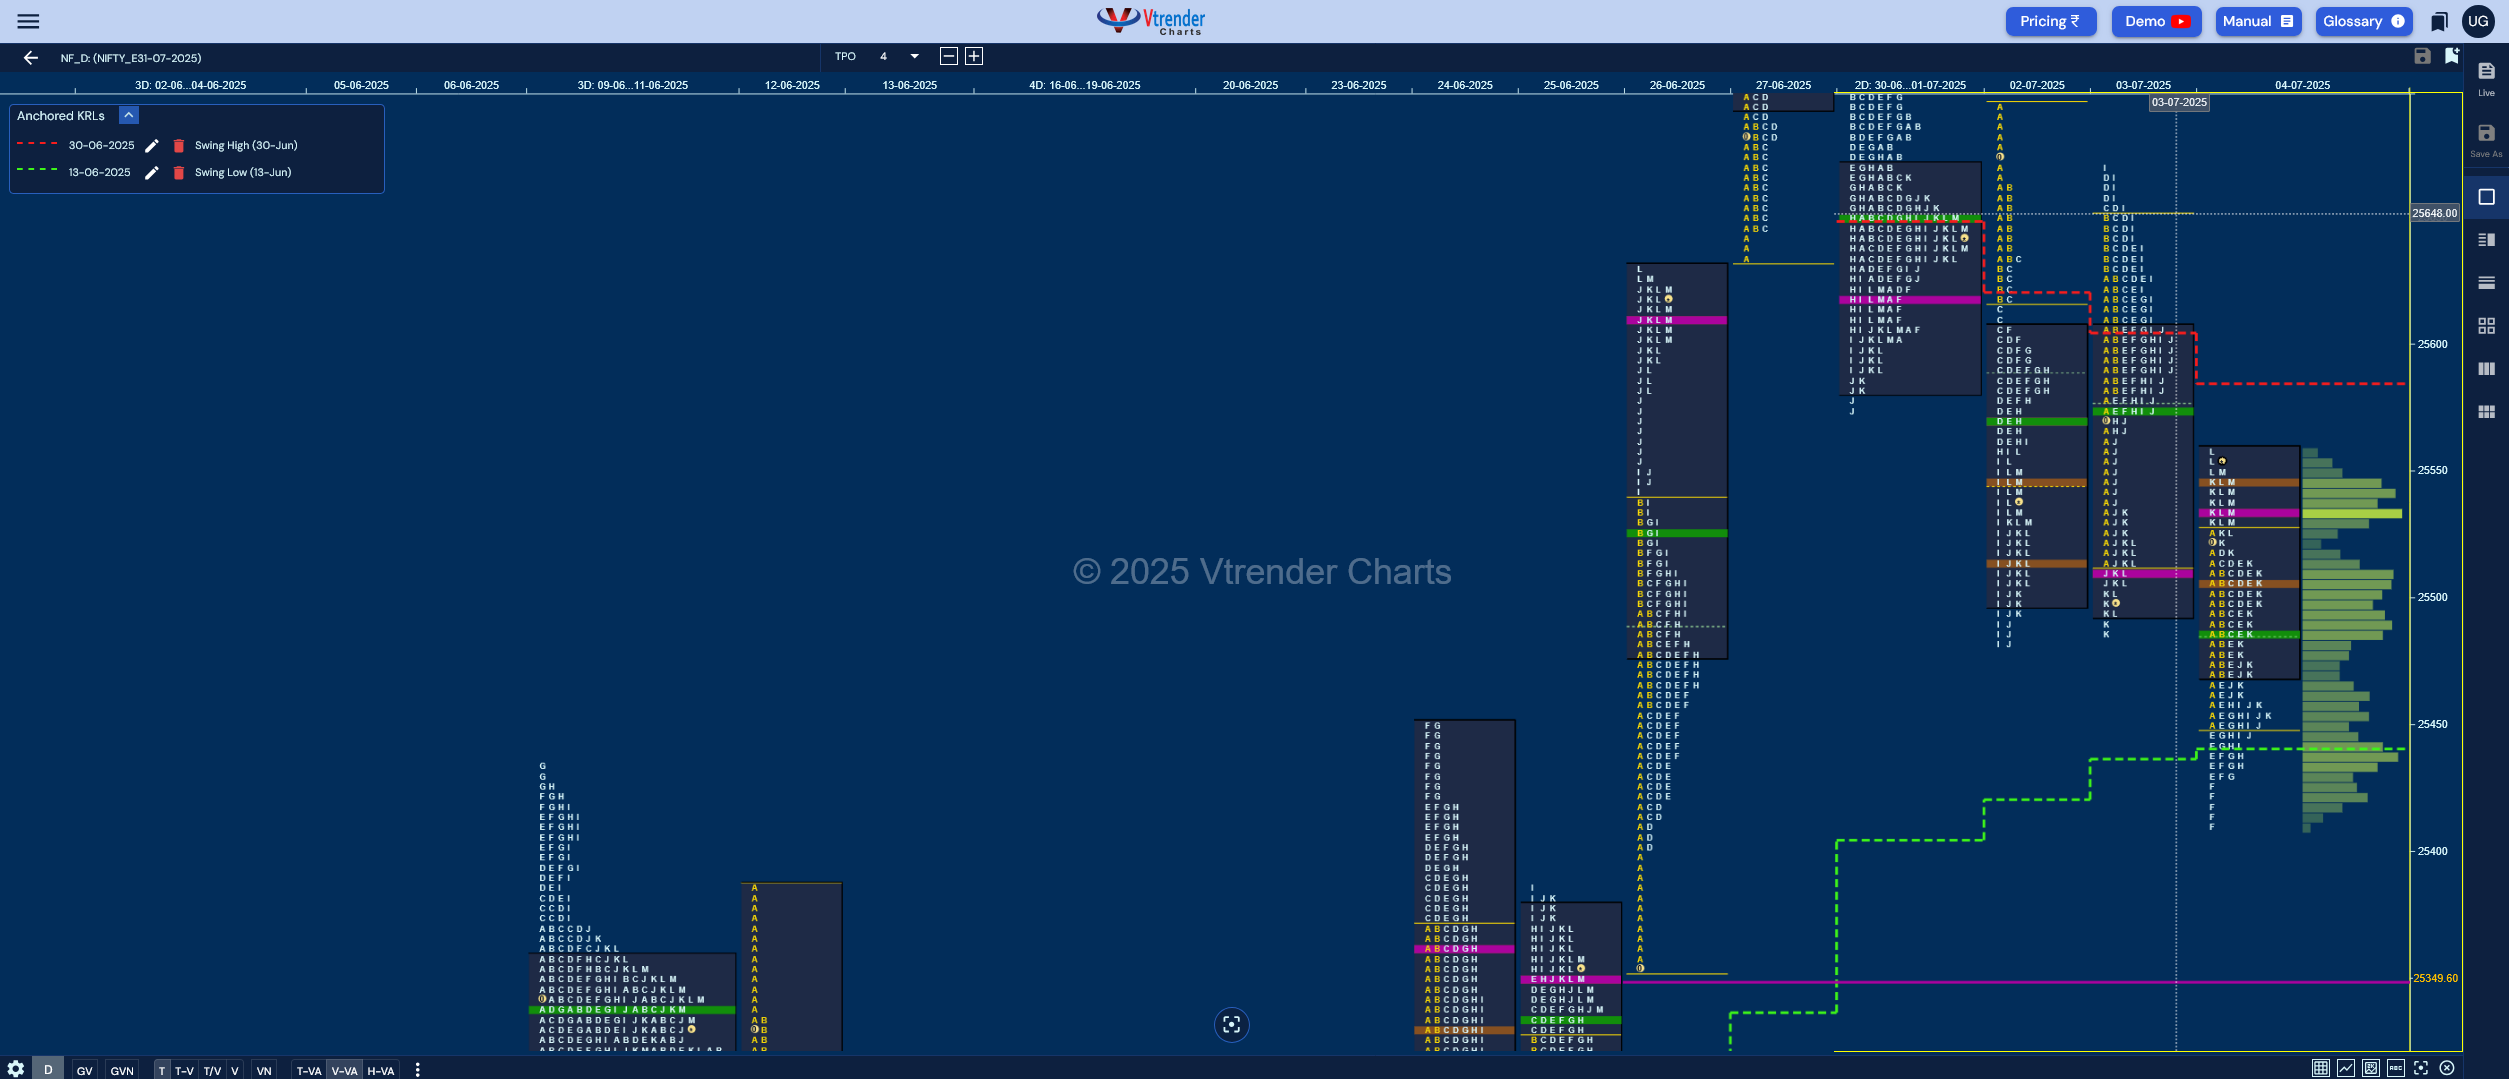
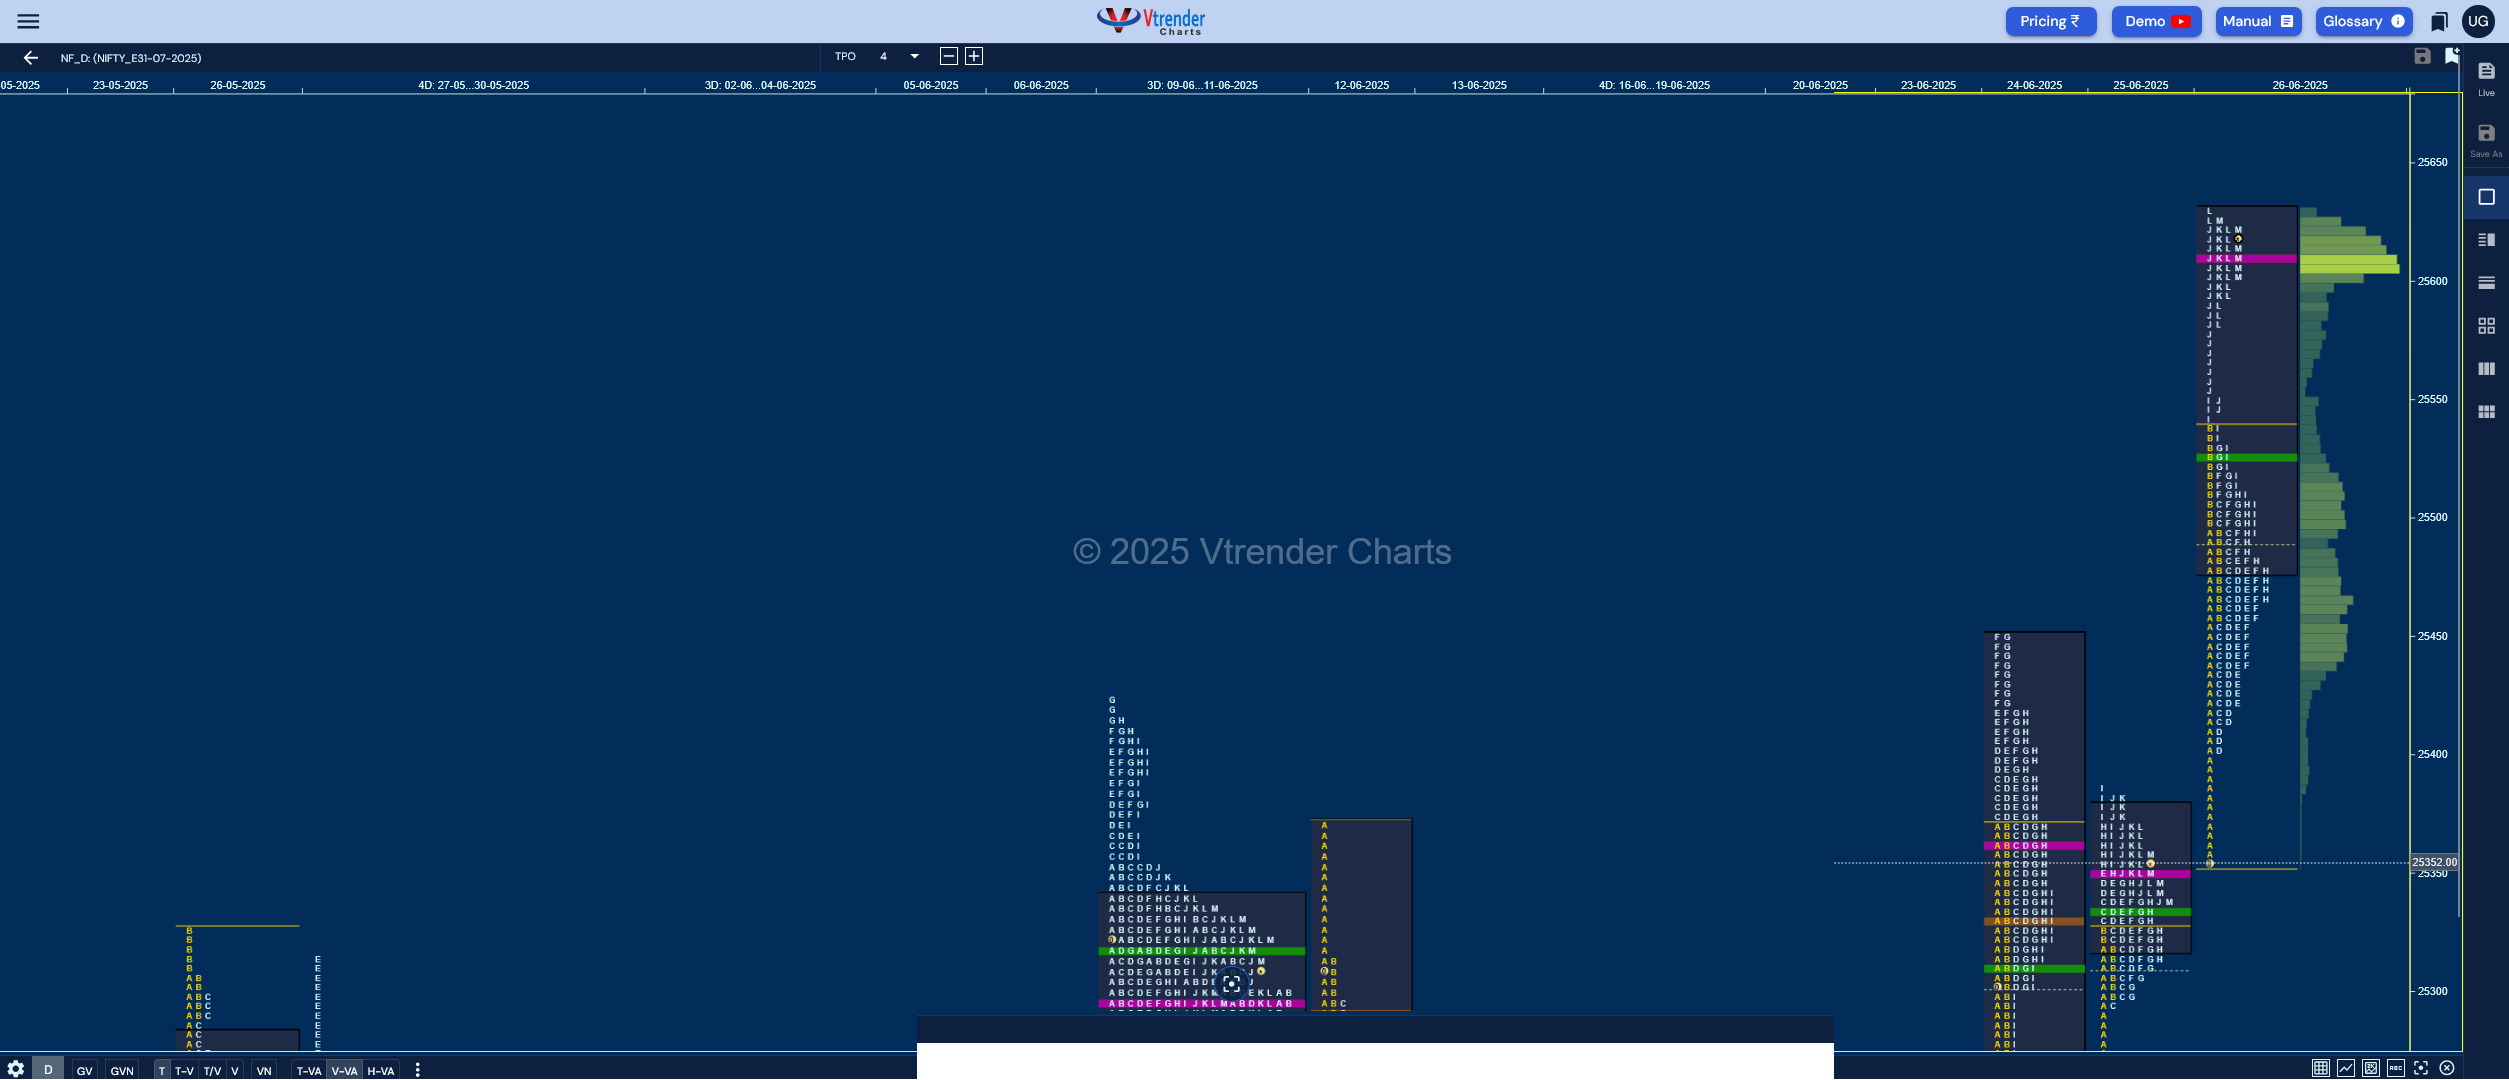
Market Profile Analysis dated 07th Jul 2025
Daily MarketProfile Analysis of NF & BNF along with Business Areas for next session
Read More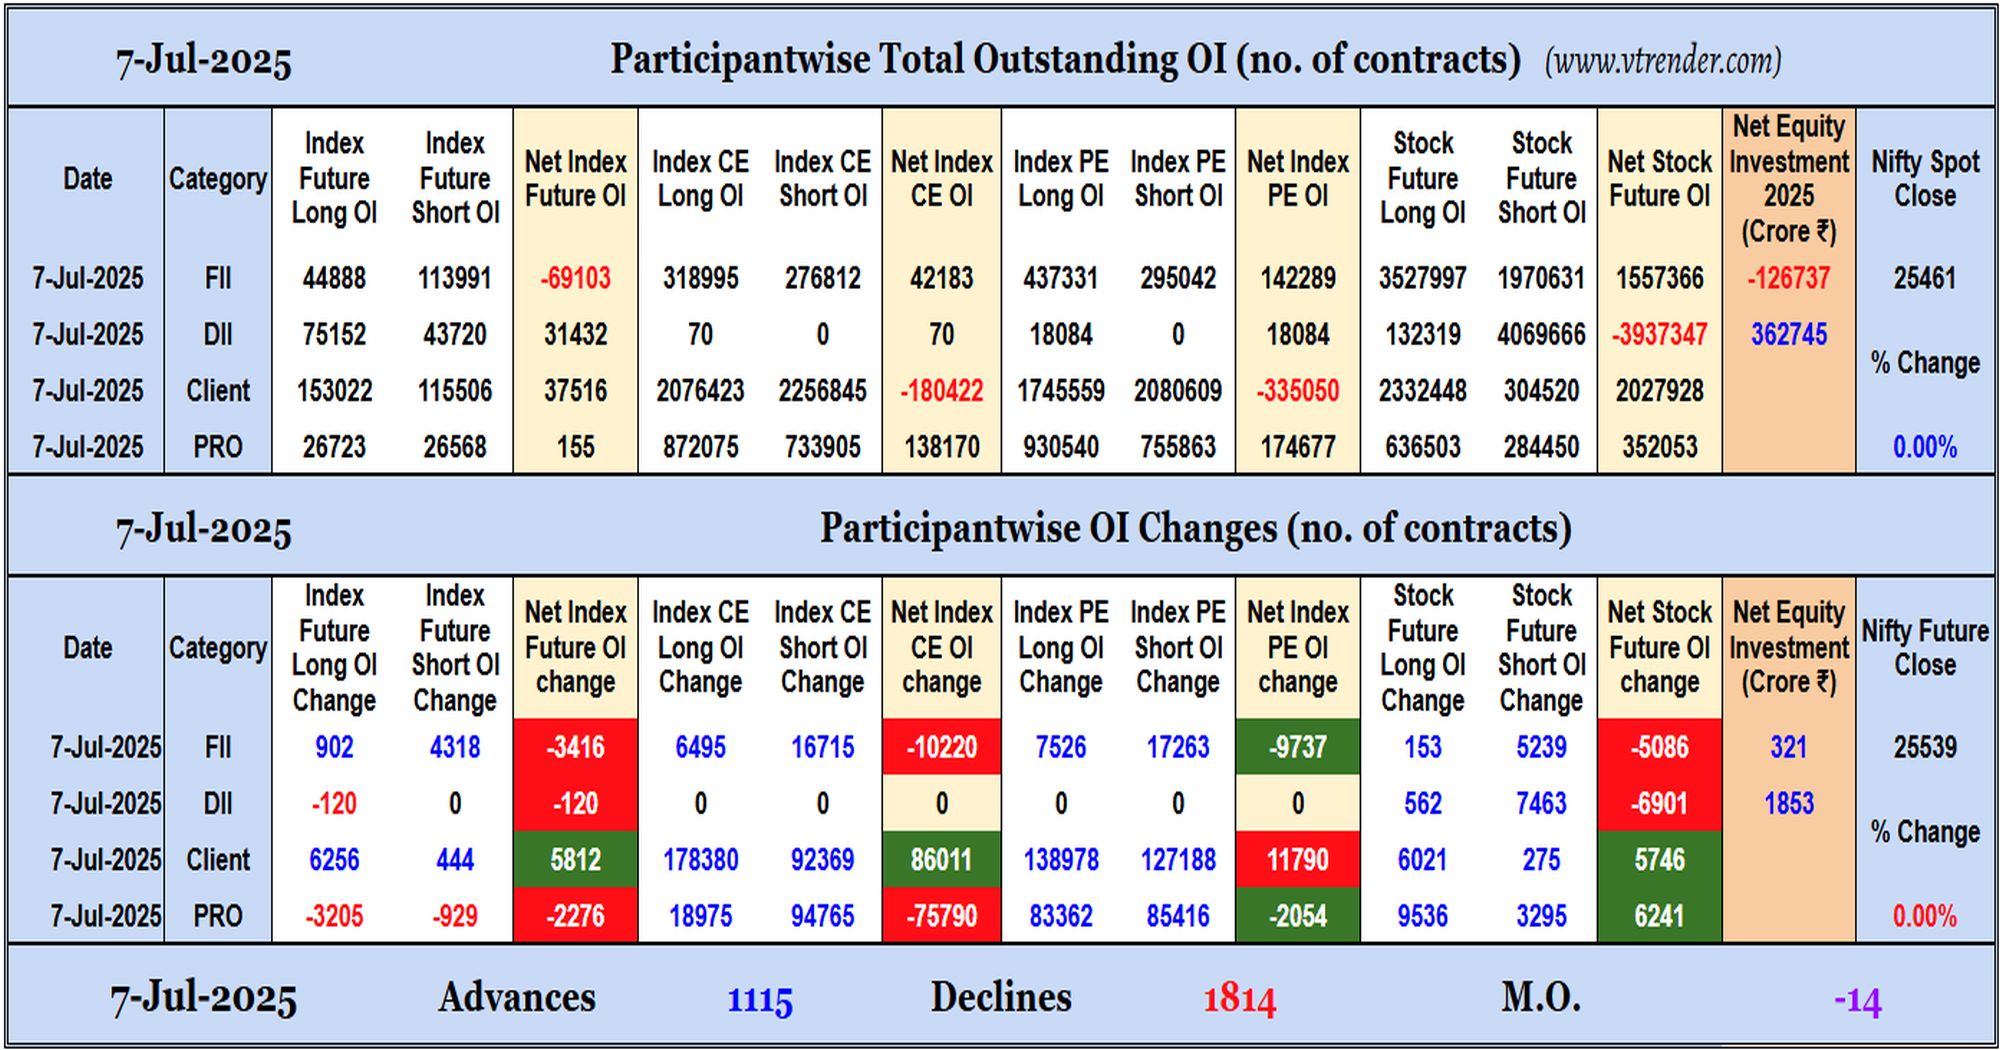
Participantwise Open Interest (Daily changes) - 7th JUL 2025
FIIs have added net shorts in Index Futures, Index CE, Index PE and Stocks Futures. They were net buyers in equity segment.
Read More
Market Profile Analysis dated 04th Jul 2025
Daily MarketProfile Analysis of NF & BNF along with Business Areas for next session
Read More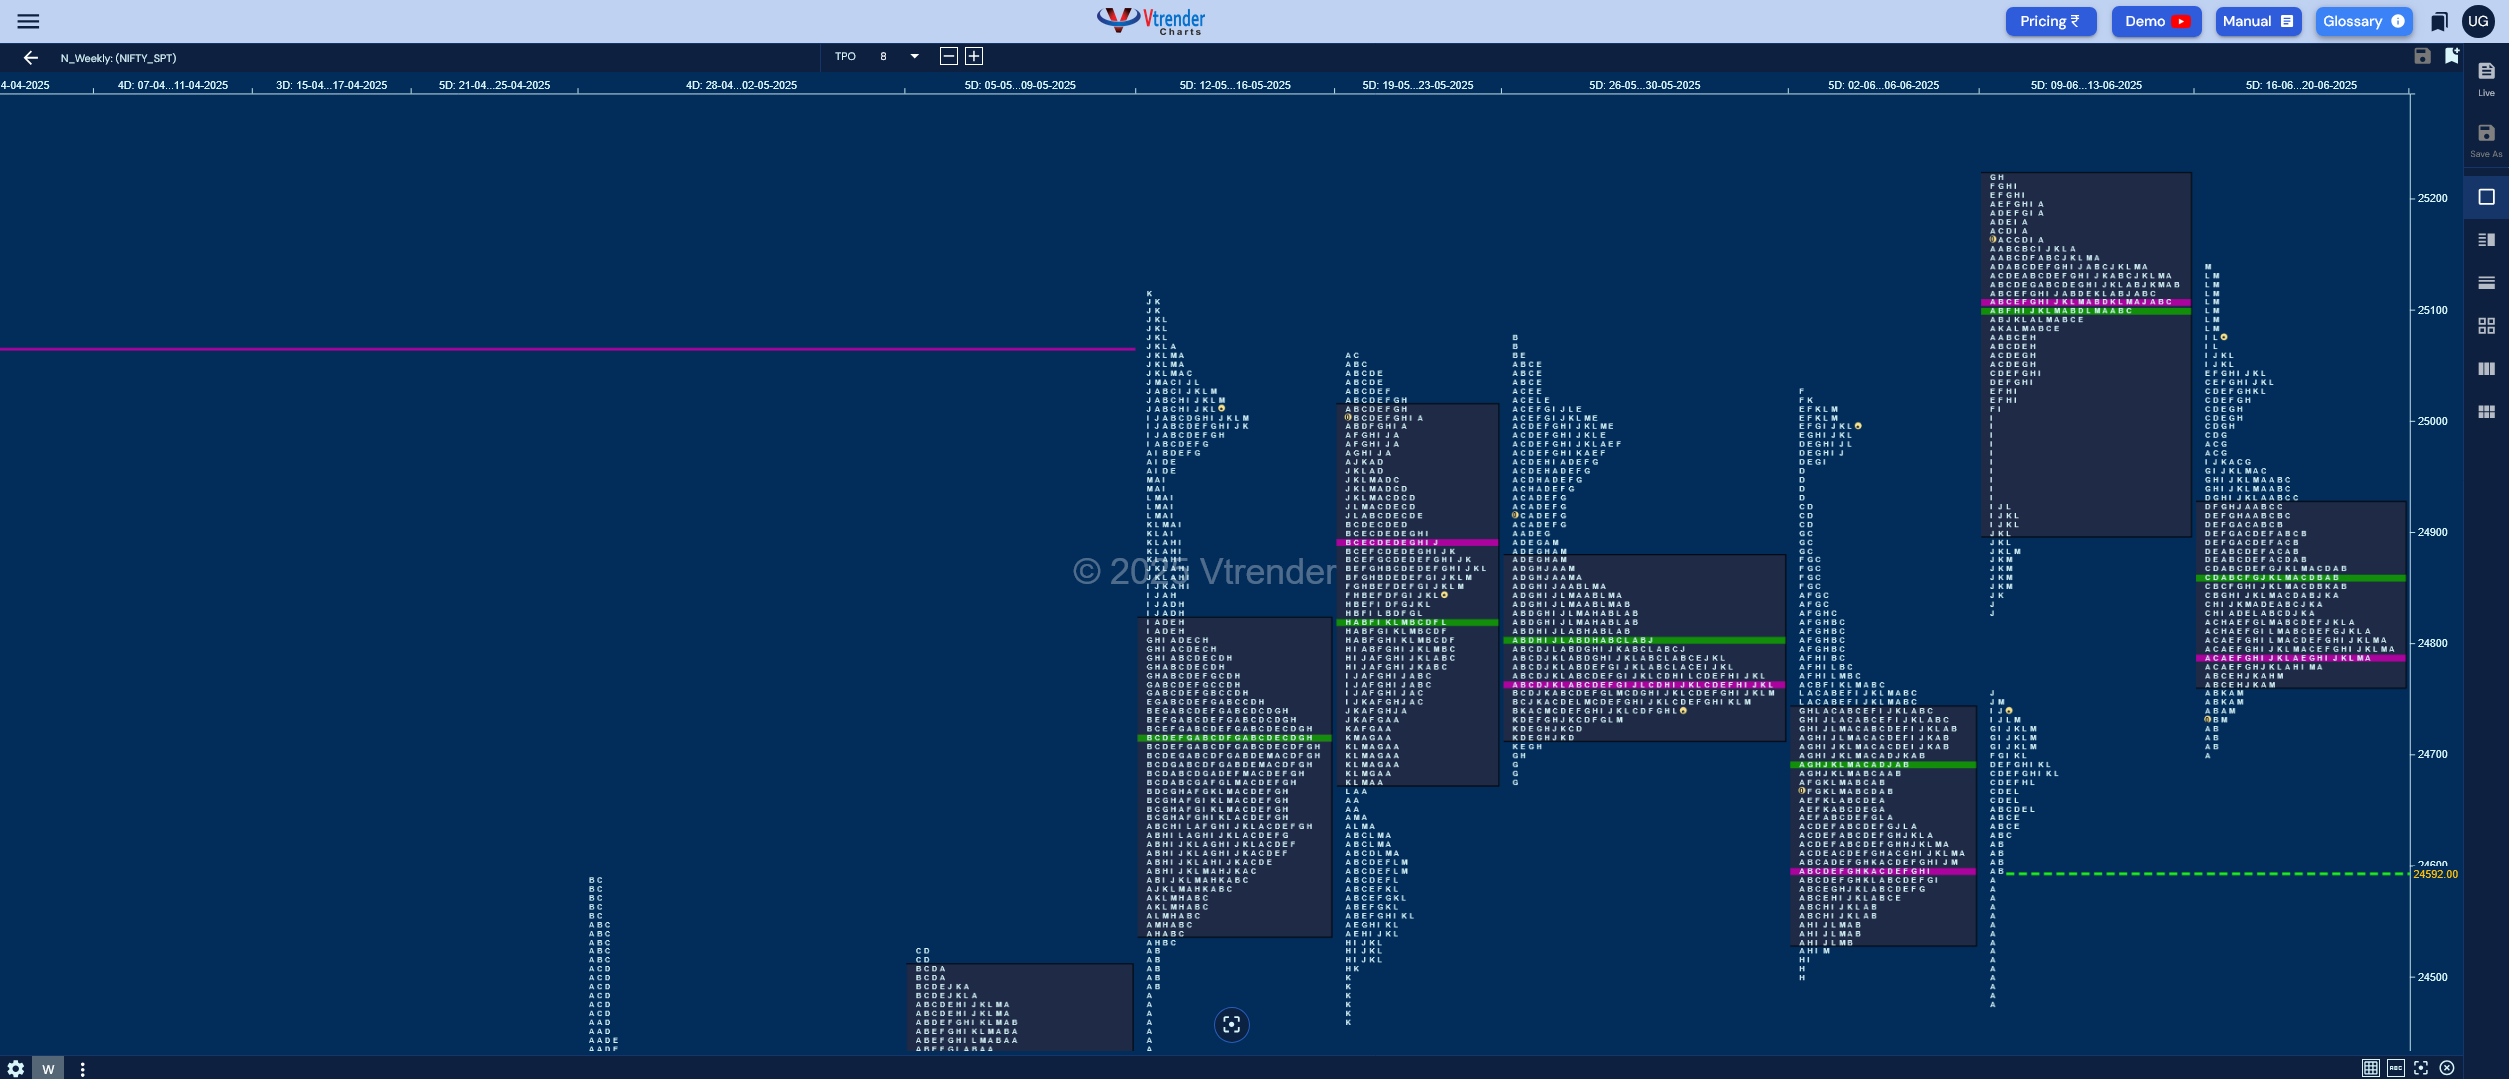
Weekly Spot Charts (30th Jun to 04th Jul 2025) and Market Profile Analysis
Study of Auction behaviour of Nifty and BankNifty of previous week and daily hypos for the current one
Read More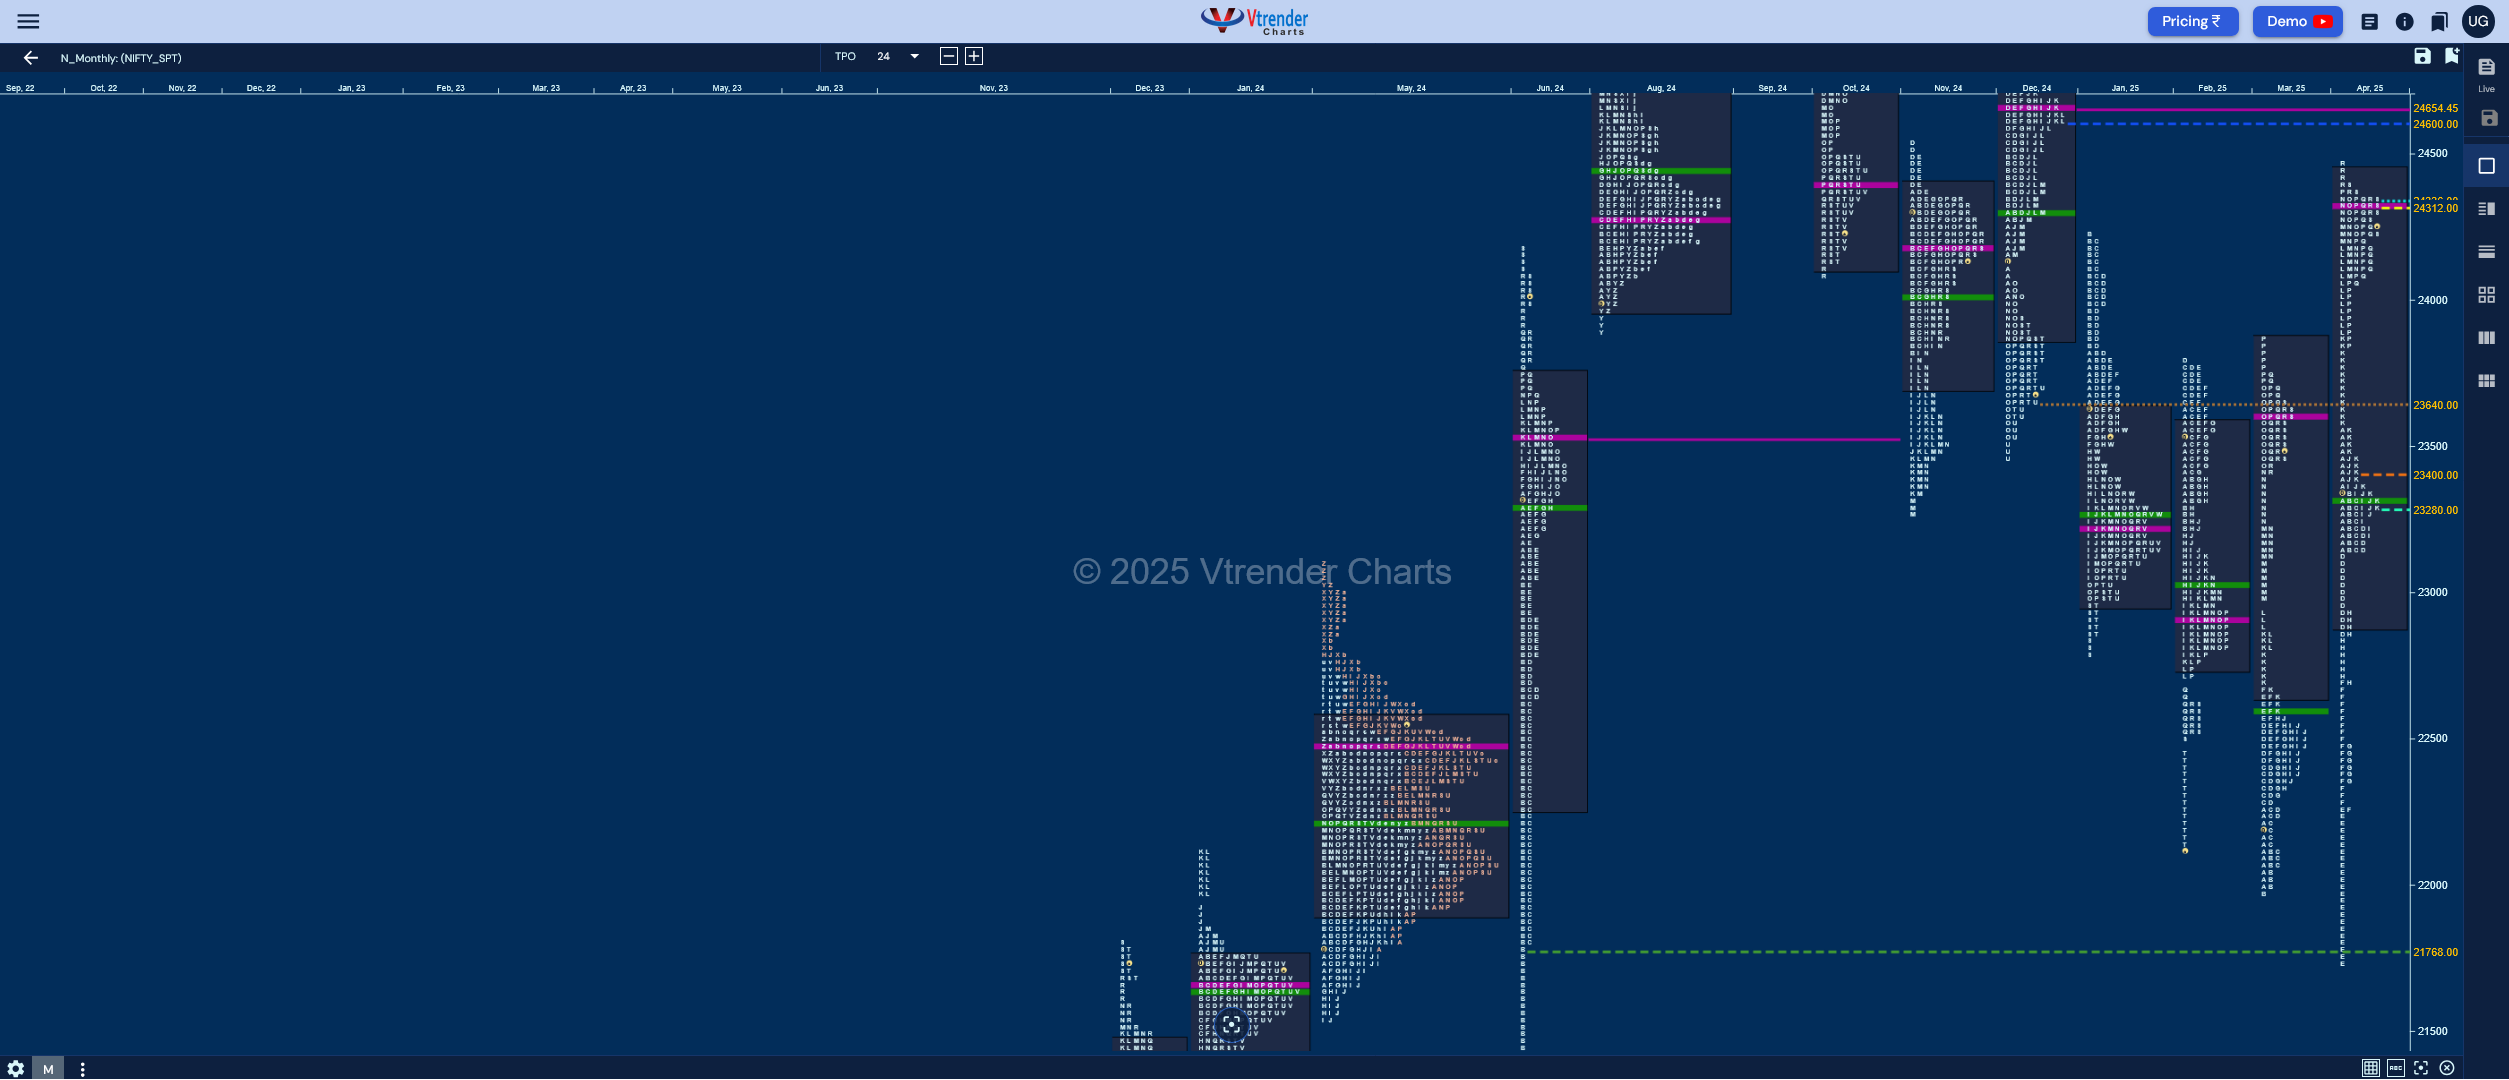
Monthly charts (Jun 2025) and Market Profile Analysis
MarketProfile Analysis of the Monthly timeframe for Nifty and BankNifty Spot
Read More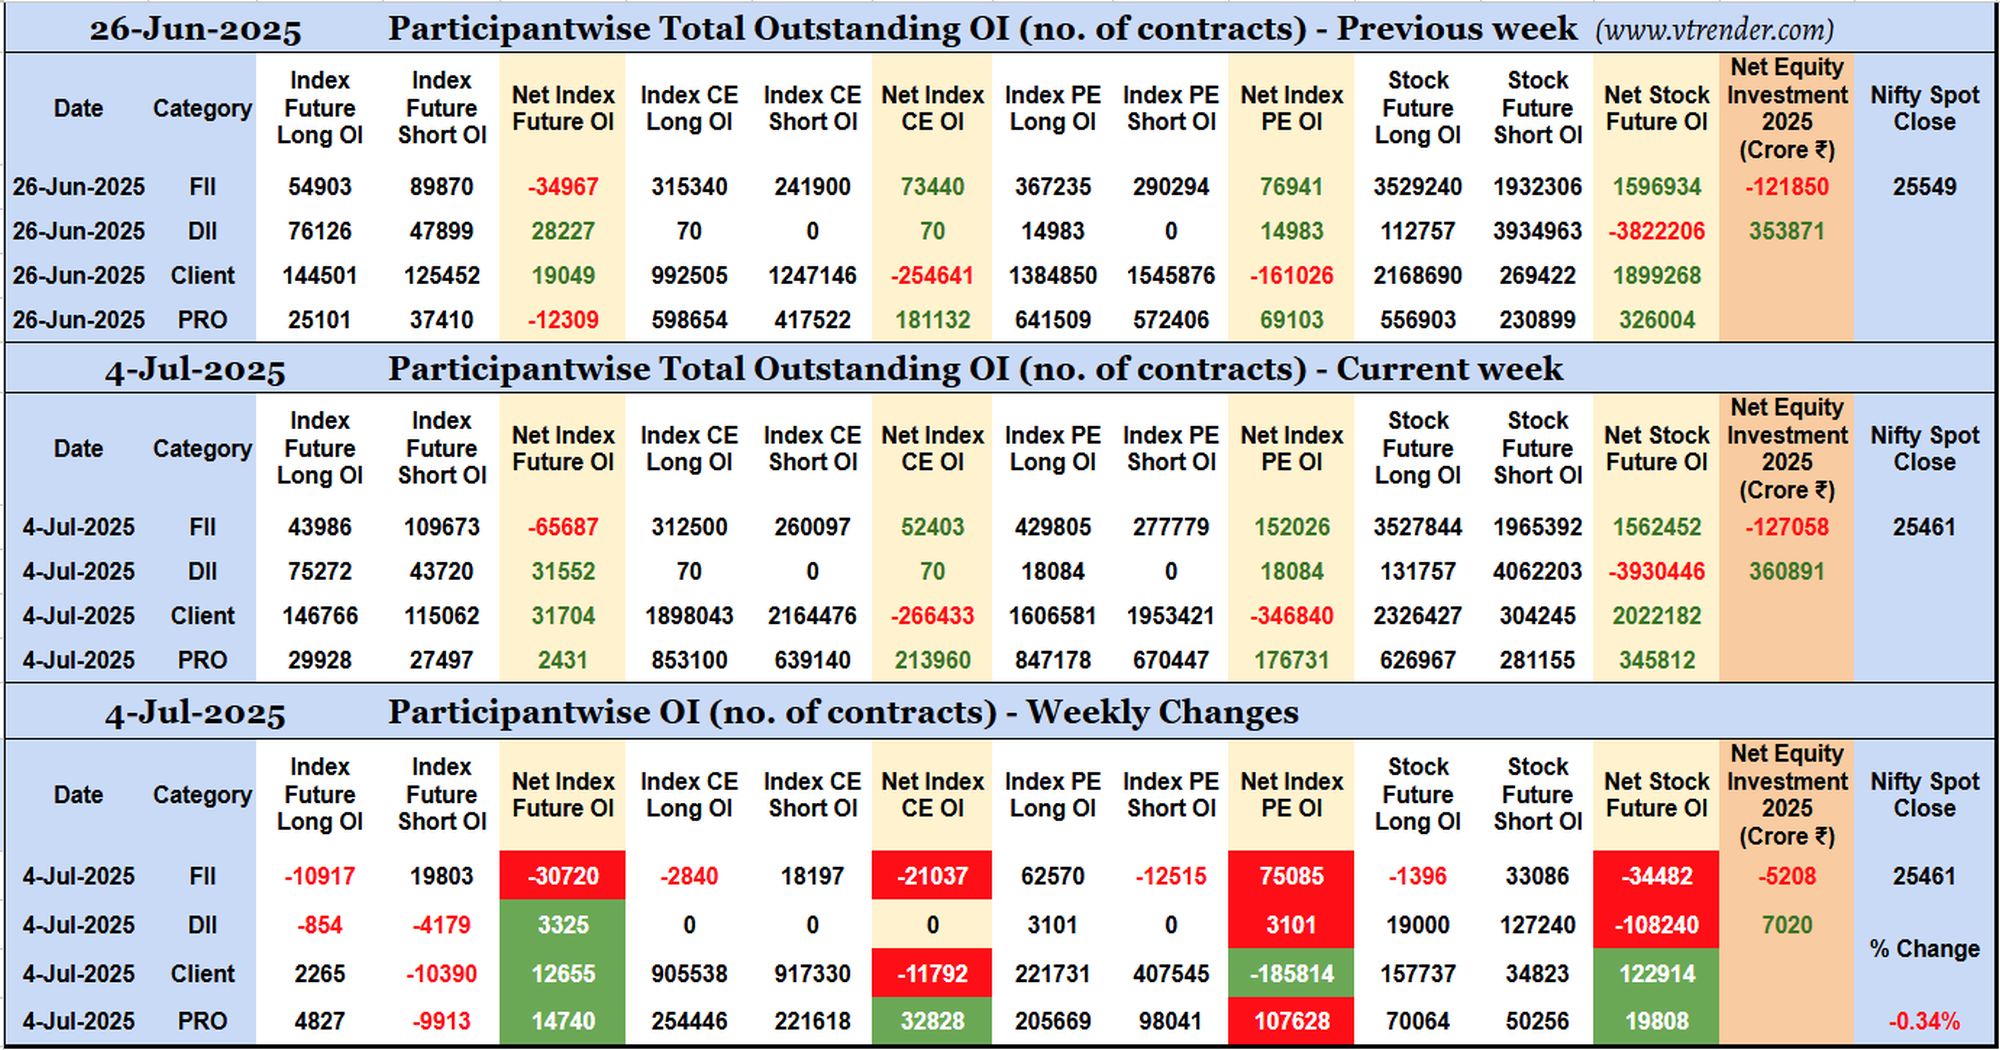
Participantwise Open Interest (Weekly changes) – 4th JUL 2025
FIIs have added 19K short Index Futures, 18K short Index CE, 62K long Index PE and 33K short Stocks Futures contracts this week besides liquidating 10K long Index Futures, 2K long Index CE and 1K long Stocks Futures contracts. They have also covered 12K short Index PE contracts. FIIs have been net sellers in equity segment for ₹5208 crore this week.
Read MoreMust Read
No Posts Found
We haven't published any posts in this category yet. Please check back later.
Return to HomepageVtrender Learning Videos
Stories of Transformation: Real Traders, Real Results
20000
+ HoursOver 20000 + Hours of mentoring Provided
77.5
% Results77.5% of traders saw an impact on their trading style immediately in 3 days
20
+ StrategiesOver 20+ trading strategies and styles to gain maximum benefit from markets
83.5
% RetentionOur loyalty and satisfaction metrics are of a high standard
The last 2 days have been quite good in the mentoring room. Its a very different way on how i used to look at the market and how u guys approach in a very systematic and planned manner. It adds a lots of clarity on exactly what not to do in the market which is quite helping me. Thought its initial days at the moment, I have started going through the training library also and definitely more practical learning in the VMR to follow.
A 3-day User
I've been using VMR for about three years now, and I've had a great experience so far. The concepts of MP & OF may seem overwhelming at first, but once you grasp them, you'll find that they're incredibly useful. The daily live audio sessions are a treasure trove of knowledge. They're clear and concise, and they never let you forget the concepts. They also have a way of making you feel lazy sometimes, which is a good thing because it means you're not overthinking things. The live market analysis sessions are equally impressive. They're to the point and free of confusion, and they help you understand the markets better. The charts and tools can be a bit confusing at first, but once you understand the concepts, there's nowhere else to go. And I love all the enhancements that keep coming. The training library is a goldmine of knowledge. It makes all the concepts clear, and they're all relevant to real-world trading. Before joining VTian, I tried many different things, including using a lot of different indicators and gurus. But none of them worked for me. Trender is a unique forum where you can learn daily, earn money, and stay ahead of the crowd. You're always listened to, your questions are always answered, and your doubts are always cleared.
A 3-Year User
Thanks Shai for all the learnings in last 6 months. So far best trade today on 21300 ce from 2 to 50. The change in me is not about identifying a trade but ability to identify when to hold and when to exit. I would not have held this so long if not for OF and MP. Thanks again
Sayan
I humbly thank the entire TRENDER team specially Shai sir and uttam sir for all the support in training entire team. Any one here for long term is surely to sustain the markets. And make good money. As Shai sir always says follow the process. Thank you team TRENDER
Naresh
I have gained the confidence in my self after joining Vtrender mentoring room and I was on the verge of leaving markets before joining. Vtrender coz I just blew up my trading account.but i thought let's take a last bet with Vtrender and guess what it has just been 2 moths after I joined and I have gained lots of confidence and accuracy since joining in this Jan month till now I got 70% to 85% accuracy in my trades.really the process v trender follows is just awsome and when there are mentors like Shai and Uttam is here I don't have to fear any movement. Thanks Vtrender