
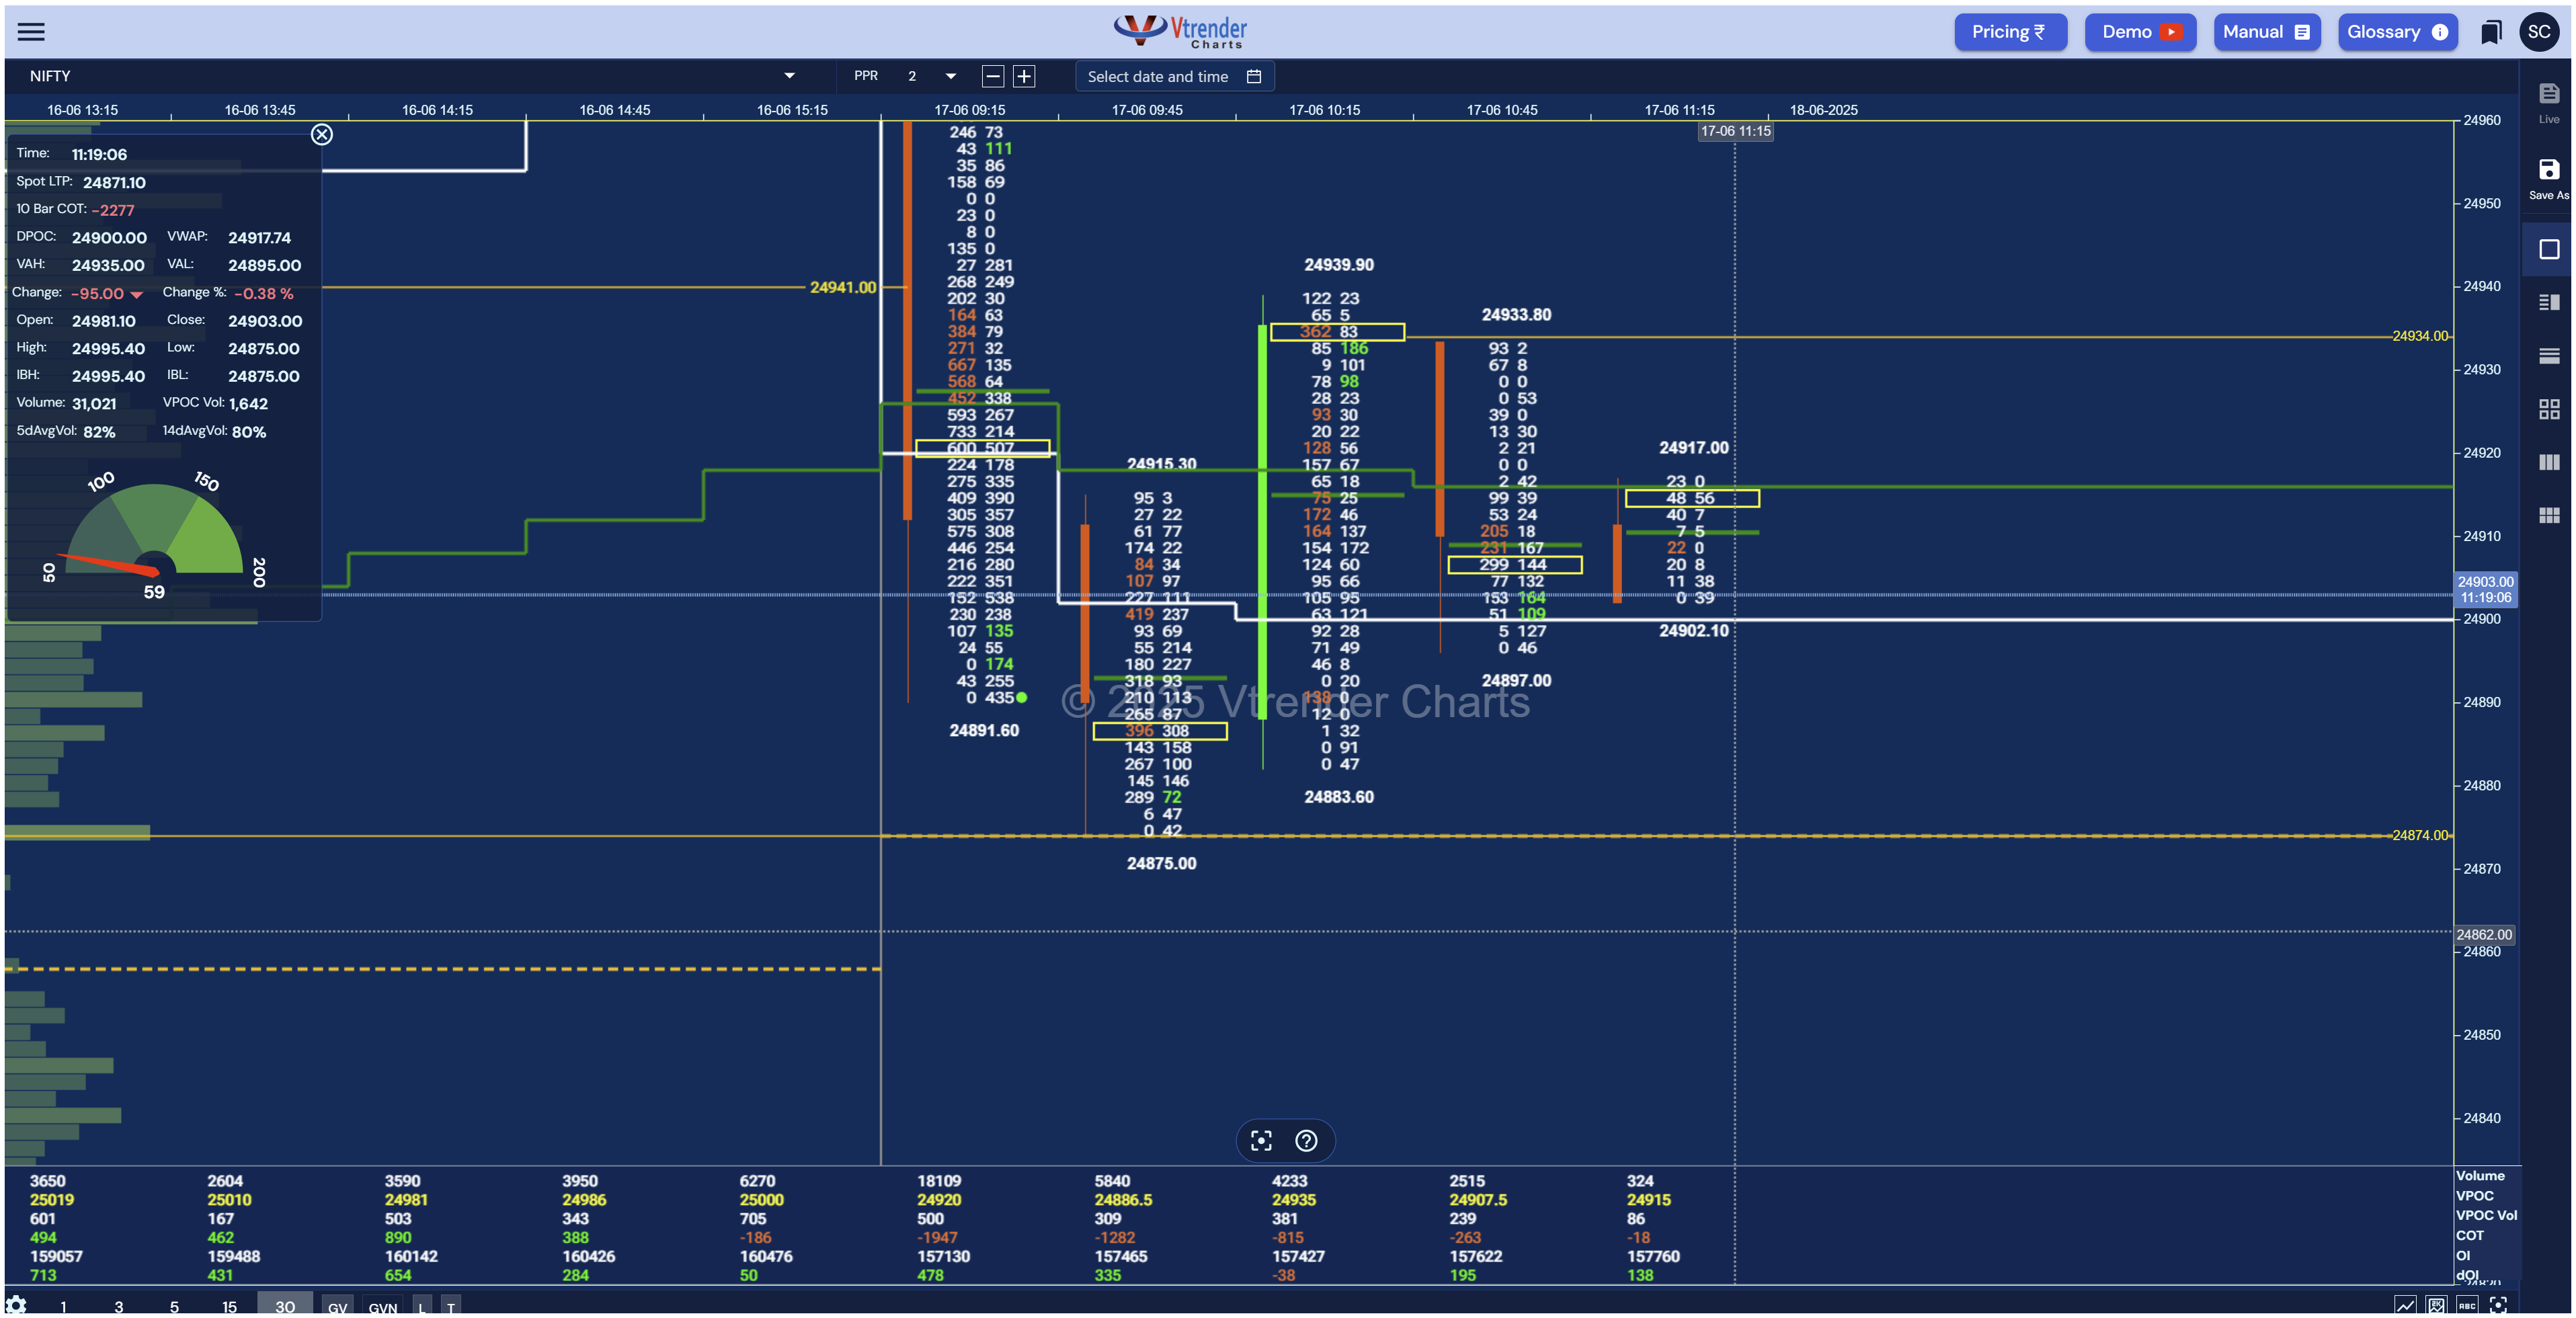
Live Market Profile , Orderflow & Options Flow Charts
for Nifty and Sensex — Real Time.
Discover institutional footprints, hidden auctions, and volume pressure — in real time.
Start Streaming Charts NowAdvanced Analytics.
Simplified Interface.
Real-time NSE data. Zero delays. No noise.
Every tool you need to read the market — exactly as it
unfolds.
Nine Reading Layers. One Platform.
Each tool answers a question your price chart leaves open.
Market Profile TPO Charts
Order Flow Replay
Gamma Density and GEX
NTM VolX
MFLOW
Options Table and Overlay
Built for Traders Who Read
the Market as a Process
Not for tips. Not for signals. For traders who want to understand what is actually happening.
Vtrender is not built for tip-seekers. It is built for traders who want to understand what they are trading.
Start Free. Upgrade When You're Ready.
The free plan gives you live Market Profile for NIFTY and BANKNIFTY. The full suite unlocks every reading layer.
- Market Profile charts — NIFTY, BANKNIFTY, Sensex, Bankex
- Live and historical sessions
- Value Area, POC, Initial Balance
- Basic Order Flow view
- Session replay
- Everything in the free plan
- Complete Order Flow — delta, COT, IB/IS, footprint
- Gamma Density and Gamma Exposure charts
- Spectrum — options writer positioning map
- NTM VolX — real-time near-the-money control
- MFLOW 2.0 — new vs old business, live
- Smart Candlesticks with MFlow & MB boxes
- Full options suite — IV Smile, Greeks, OI, FII data
See full plan details and pricing on the subscription page →
The Methodology Behind the Charts
Both resources are built around Vtrender Charts — for traders who want to understand the framework behind every tool they use.
Built around Vtrender Charts. Learn what each tool is showing you and exactly why it matters.
DRM-free PDF. Read it alongside your charts. Mark it up. Print it. It's yours.
How the Tools Apply to Real Sessions
Written by the Vtrender Research Desk. No tips. No predictions. How the reading actually works.
What traders ask before they open the charts
Straight answers. No marketing copy.
Is Vtrender Charts free?
Yes. Vtrender Charts has a free plan that includes live Market Profile TPO charts for NIFTY, BANKNIFTY, Sensex, and Bankex — no credit card required. The free plan updates in real time during NSE and BSE market hours across both the futures and options session.
Paid plans — available monthly or annually — unlock the remaining eight reading layers:
- Order Flow Replay — price-by-price ladder with bid/ask, delta, and COT
- Gamma Density — where options hedging sensitivity concentrates across strikes
- Gamma Exposure (GEX) — directional balance of dealer gamma positioning
- NTM VolX — near-the-money volatility control and VXR ranges
- Spectrum — CE and PE walls overlaid directly on price with OI change lines
- MFLOW — new business versus old business participation in real time
- Smart Candlesticks — IB and IS bars marking opening balance and initiative moves
- Options Table and Overlay — strike-level IV, volume, VPOC, VWAP, dOI, and PCR
What markets and instruments does Vtrender Charts cover?
Vtrender Charts covers NSE and BSE derivatives — NIFTY, BANKNIFTY, Sensex, and Bankex futures and options. Vtrender has been a registered member of both NSE and BSE since 2010.
All nine reading layers are calibrated for how these instruments trade during Indian market hours. The platform is not a generic international tool adapted for India. It was built from the ground up around NSE and BSE session structure, including:
- Weekly options expiry dynamics specific to NIFTY and BANKNIFTY
- Opening balance behaviour in Indian index futures sessions
- Options positioning patterns that emerge around key strike levels on NSE
- Intraday auction structure on both 9:15 opens and gap scenarios
This specificity is why the Gamma, Spectrum, and MFLOW readings are directly applicable to how Indian derivatives actually trade — not to how their counterparts behave on other global exchanges.
How is Vtrender Charts different from a standard options chain or charting platform?
A standard options chain shows open interest and volume by strike. A standard charting platform shows candlestick price action with technical indicators. Vtrender Charts adds three distinct reading layers that neither of those tools provides.
Auction structure. Market Profile shows where the market spent time and where volume traded — producing a Value Area, Point of Control (POC), and a visible picture of balance or imbalance. A candlestick shows where price went. Market Profile shows whether the market accepted that price or was simply passing through it.
Mechanical options pressure. Gamma Density and Gamma Exposure (GEX) show how dealer hedging at specific strikes creates measurable, directional price pressure. Large open interest at a distant strike has no mechanical effect on price right now. Large gamma concentration at or near the current strike does — because dealers must hedge it continuously as price moves. Vtrender makes that pressure visible on the chart before it moves price.
Participation quality. MFLOW separates new position entries from old position unwinds in real time. A rally on fresh buying and a rally on short covering produce nearly identical delta prints on standard Order Flow. MFLOW distinguishes between the two. Their subsequent behaviour is very different — and so is the correct read.
Do I need to know Market Profile before I can use Vtrender Charts?
No prerequisite knowledge is required to open the charts. The free Market Profile chart is visual by design — the Value Area is shaded, the Point of Control appears as a visible horizontal line, and TPO letters show exactly how much time the auction spent at each price level. Most traders who open the chart and observe two or three live NSE sessions begin to recognise structural patterns without any formal instruction.
For traders who want to learn the full reading framework from the ground up — including how to read NIFTY day types, how Order Flow confirms or contradicts Market Profile structure, and how to combine all nine layers into a session-by-session process — the Vtrender E-Course covers this across 12 structured chapters. Every chapter uses live NSE chart examples from the same platform you are using. The course includes 8 days of Vtrender Charts Elite access so the framework can be practised on live tools as each chapter is studied, not just watched in theory.
What is the difference between Gamma Density and Gamma Exposure on Vtrender Charts?
Gamma Density and Gamma Exposure (GEX) are two separate charts that answer two different questions about options-driven price pressure. Both matter. Neither replaces the other.
Gamma Density shows where total options sensitivity is highest across all active strikes — plotted as a convexity curve that peaks at the strikes where dealer hedging would be most reactive to price movement. It marks upper and lower tails to show where the pressure zone begins to fall away. If price is trading inside a high-density zone, moves will be dampened in both directions because dealers are continuously hedging their exposure. If price breaks out of the density zone, that mechanical damping disappears and moves can extend faster.
Gamma Exposure (GEX) shows the directional balance of that pressure — buy-side gamma versus sell-side gamma plotted across strikes, with the current spot price overlaid. When net GEX is positive at the current price, dealer hedging acts as a stabiliser: dealers buy when price falls and sell when price rises. When net GEX is negative, dealer hedging amplifies moves: dealers sell into falling price and buy into rising price. Near weekly NIFTY and BANKNIFTY expiry, ATM gamma concentrations make GEX readings especially significant — small moves in spot can trigger large, rapid delta-hedging flows in both directions.
Read together: Density tells you where the pressure is. Exposure tells you what direction that pressure is pushing.
Does Vtrender Charts give buy/sell signals or trading calls?
No. Vtrender Charts does not provide buy/sell signals, trade calls, price targets, or trade recommendations of any kind.
The platform is an analytical and educational tool. Each of the nine reading layers answers a specific question about what the market is doing right now:
- Market Profile — where is the auction accepting or rejecting price?
- Order Flow — who is acting with urgency and at which price level?
- Gamma — where is options hedging pressure creating mechanical effects on the underlying?
- MFLOW — is the participation driving this move new conviction or old position unwind?
- Spectrum — where are options writers building or reducing their walls?
What the trader does with the answers to those questions is entirely their own decision. Vtrender does not tell you what to trade, when to trade, or what the market will do next.
This is by design. The traders who use these tools consistently are building a reading process and developing pattern recognition across hundreds of sessions. That is a fundamentally different activity from following signals — and the results compound differently over time. Futures and options trading involves significant risk of loss. Every decision is the trader's own.
What is MFLOW and why does it matter for reading NIFTY?
MFLOW is a Vtrender Charts tool that tracks new business versus old business in the NSE market in real time.
New business is initiated flow — fresh positions being entered in the direction of the current move by traders starting a new position. Old business is closed flow — existing positions being covered, rolled, or unwound. Both generate active participation. Both create delta. On a standard Order Flow chart or a delta footprint, the two look nearly identical.
MFLOW separates them. It reads the character of the participation — not just volume and direction — and shows new business and old business as solid and hollow bars on one histogram.
This matters particularly on NIFTY and BANKNIFTY for one structural reason: options expiry dynamics on NSE create frequent short-cover rallies, put-unwind moves, and call-roll sequences that look aggressive on price but are structurally different from conviction buying. A price advance on fresh institutional buying will typically hold structure and build on itself. A price advance on short covering often exhausts quickly once the covering is complete and structural support from new buyers is absent.
MFLOW lets you see which scenario you are in while the move is happening — not after the fact. It is one of nine reading layers on Vtrender Charts and is available on paid plans.
How long has Vtrender been operating, and who is the platform built for?
Vtrender has been running live market analysis for NSE and BSE derivatives traders since 2010. The platform is a registered member of both NSE and BSE.
The charts, the methodology, and the nine reading layers were developed and refined over fifteen years of watching how NIFTY and BANKNIFTY actually trade — through trending sessions, balance sessions, expiry dynamics, high-volatility events, and the full range of market conditions the Indian derivatives market produces.
Vtrender Charts is not a mass-market product. It is not built for traders who want signals, shortcuts, or managed calls. It is built for traders who want to understand what the auction is doing well enough to form their own read — and who are willing to put in the observation time that requires.
The traders who use it regularly are those who have already moved past price-based indicators and want to read structure, flow, options pressure, and participation quality as a combined discipline. The free plan — live Market Profile for NIFTY, BANKNIFTY, Sensex and Bankex — is the place to start. No commitment required to see whether the reading approach changes how you see a session.
Most charts tell you
what happened.
Vtrender Charts tells you
what is happening.
Start with the free plan. Market Profile live on day one. No credit card.
Observe. Do not predict.