Love Vtrender Charts? Check out our new offer!
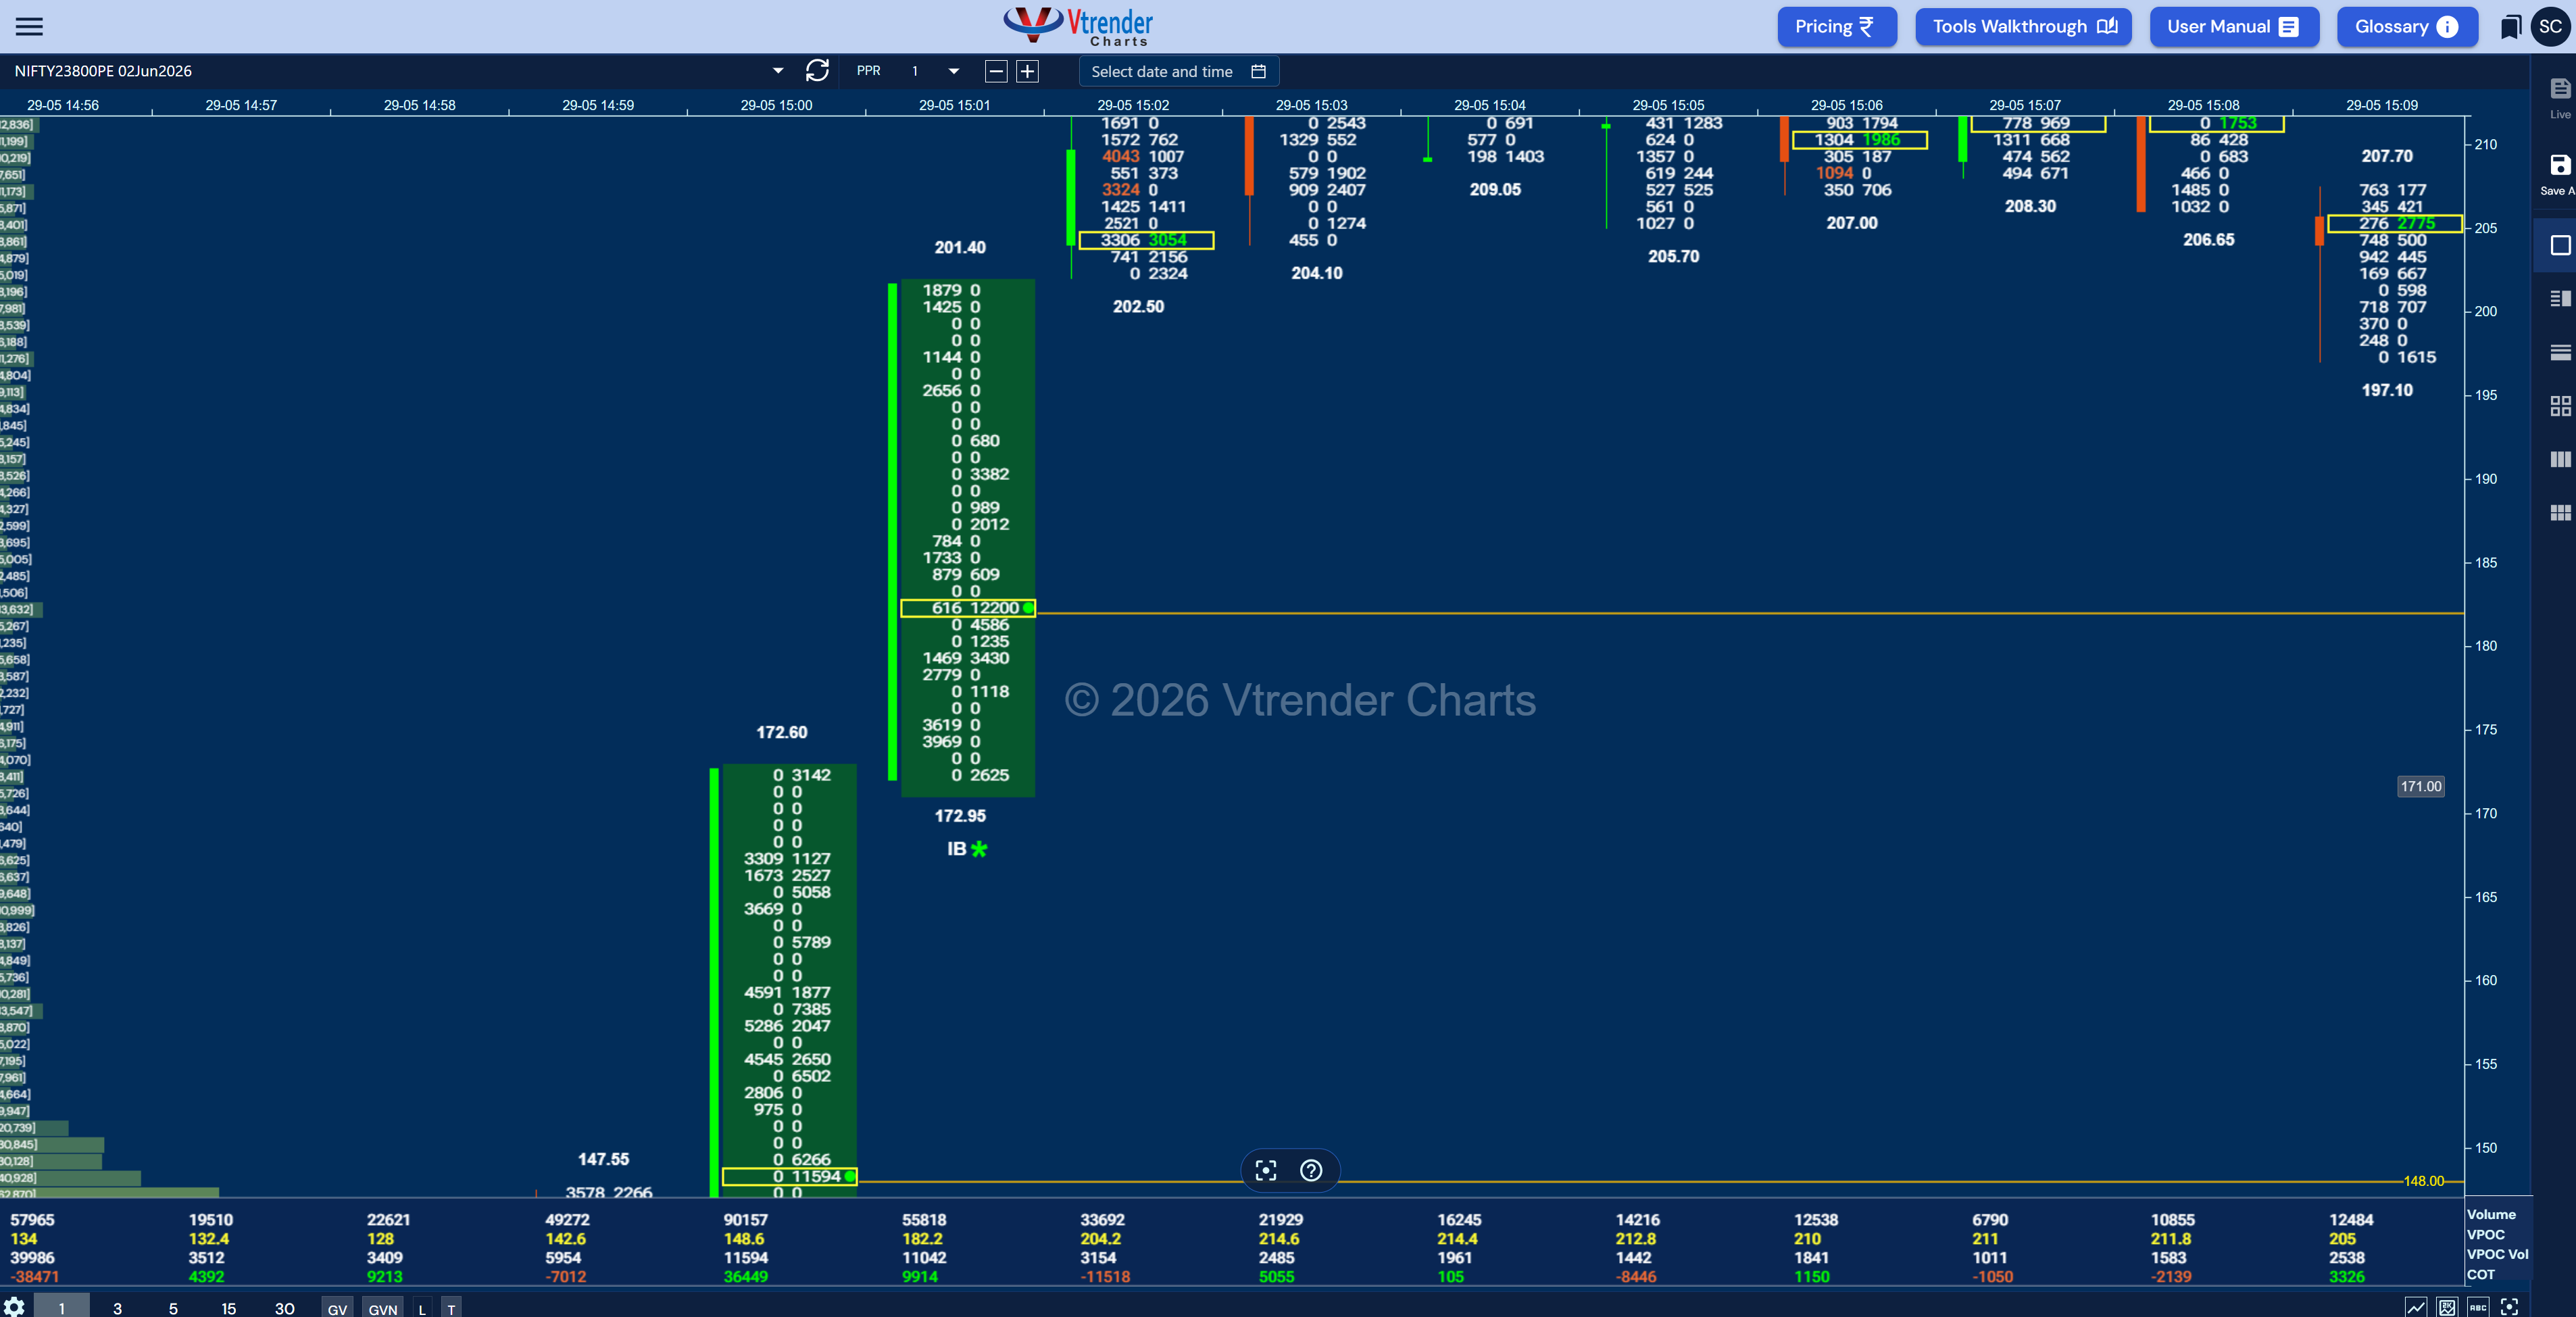
Location, intent, and acceptance determine whether size moves Nifty. How Market Profile, Order Flow, MFLOW, and the Options Table read the same print differently.
Read More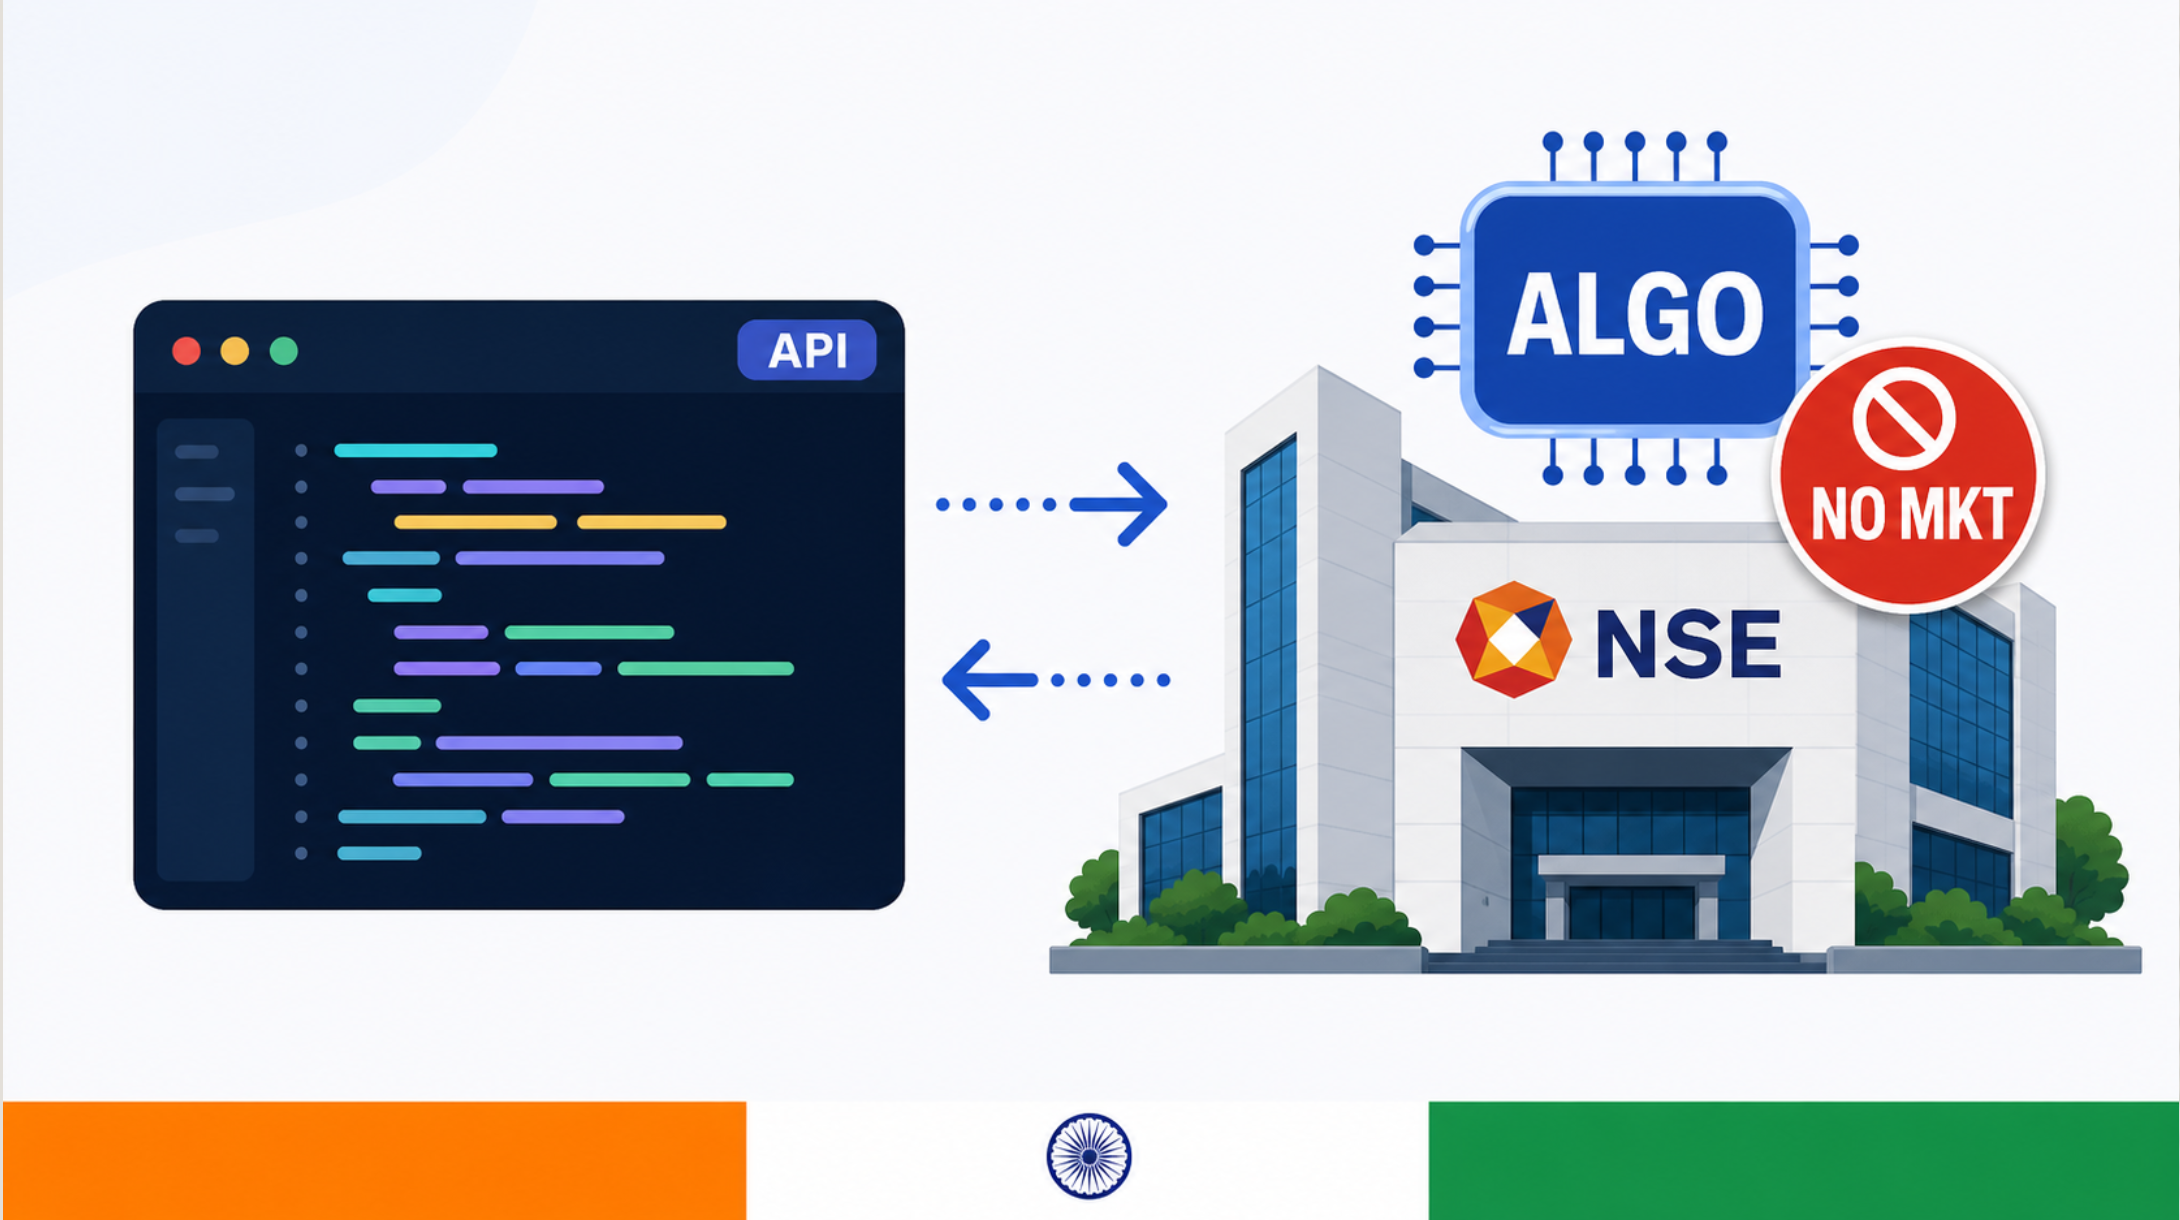
Order routing labels change. The auction does not. How Order Flow, IB/IS, Smart Candlesticks, and MFLOW read intent at the point of trade on NSE and BSE.
Read More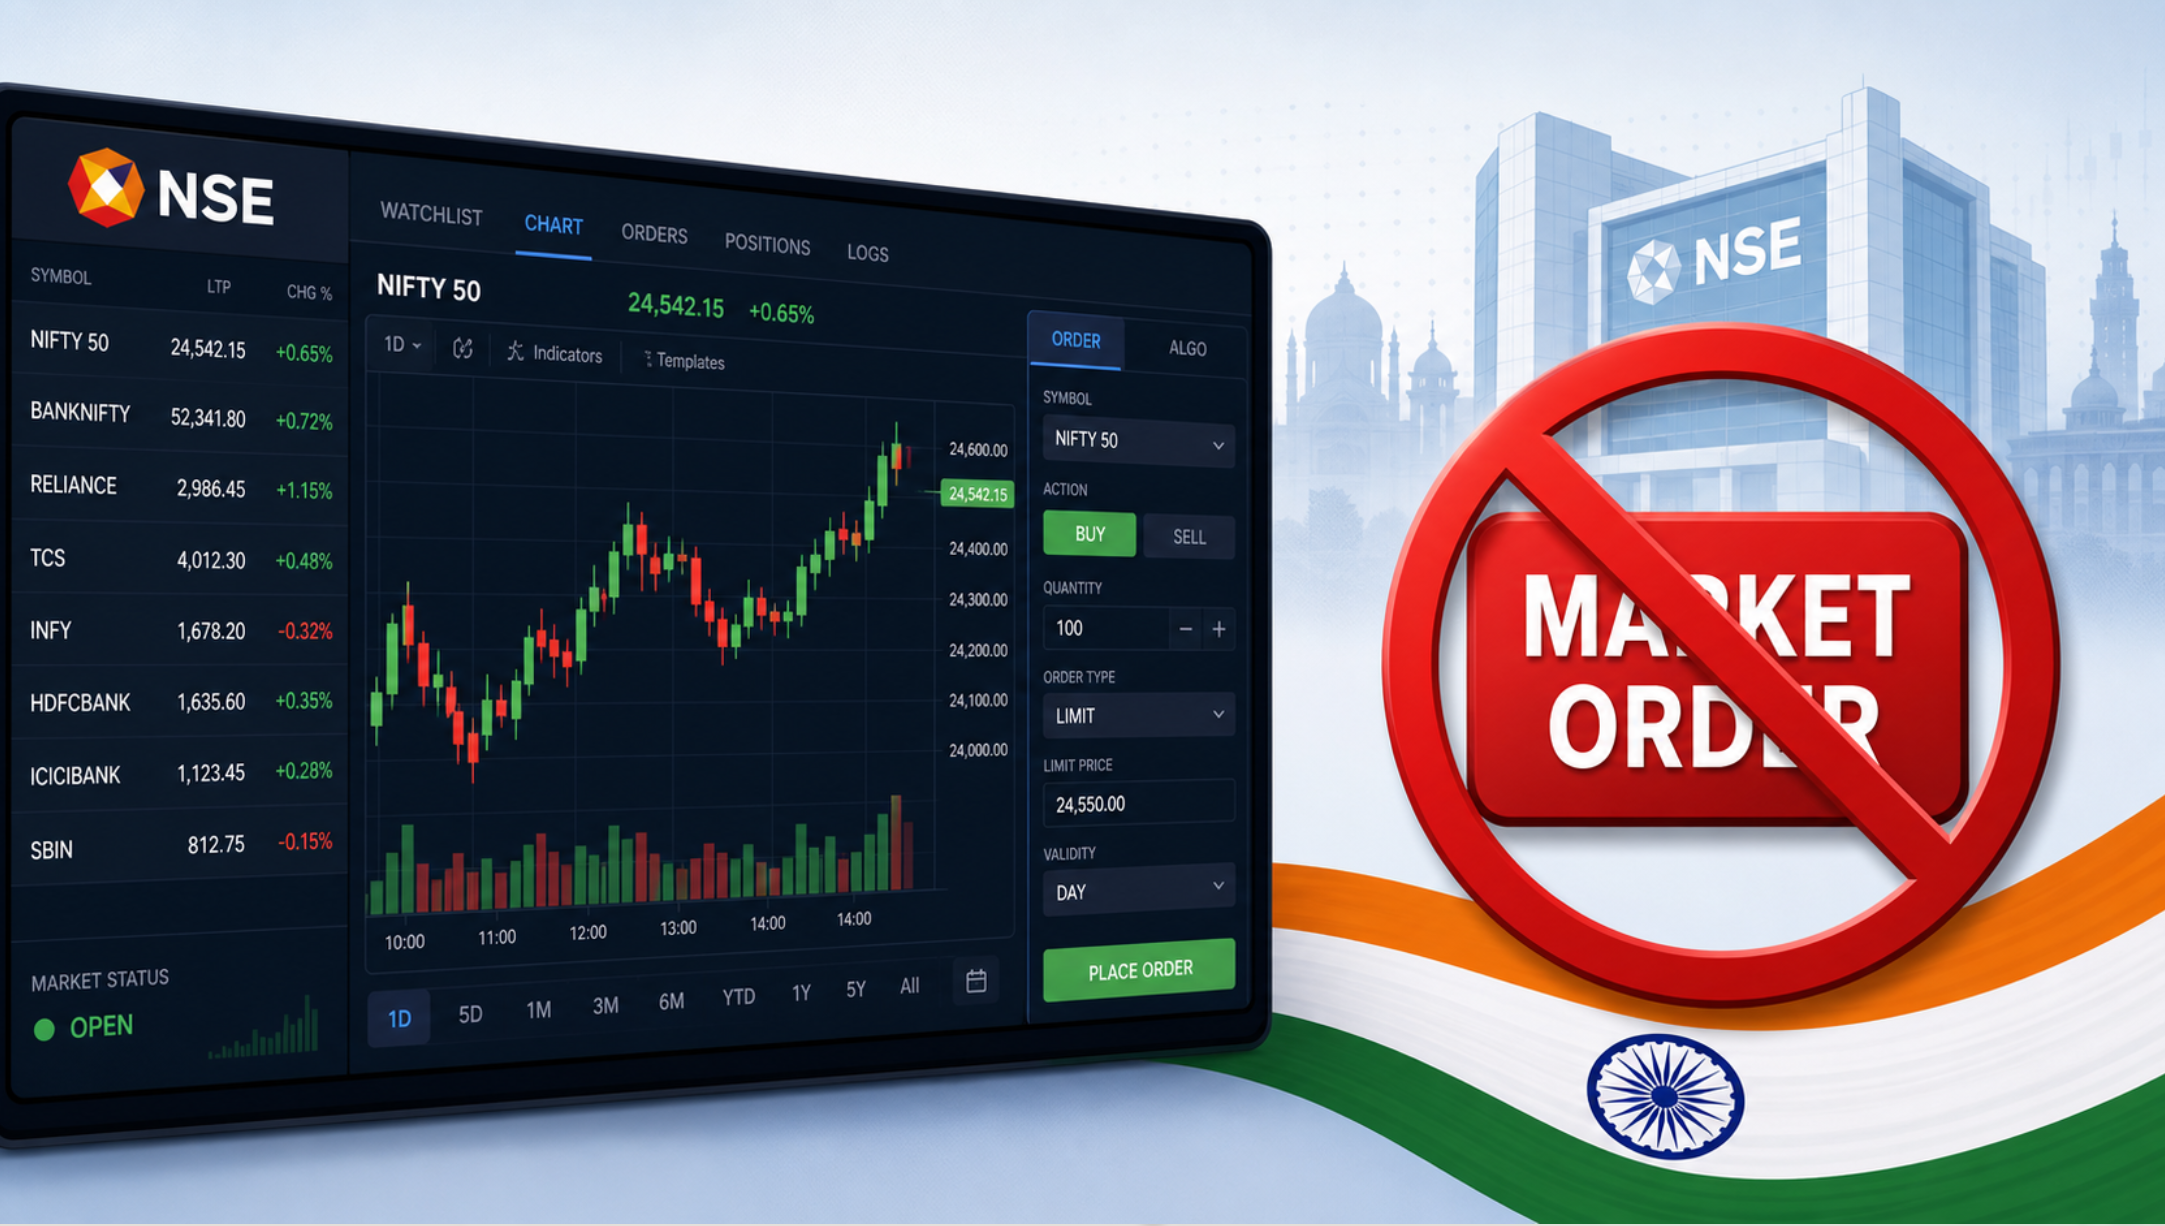
NSE reclassified API orders as algo from April 2026. The routing label changed. Order Flow, MFLOW, and Smart Candlesticks still read intent the same way
Read More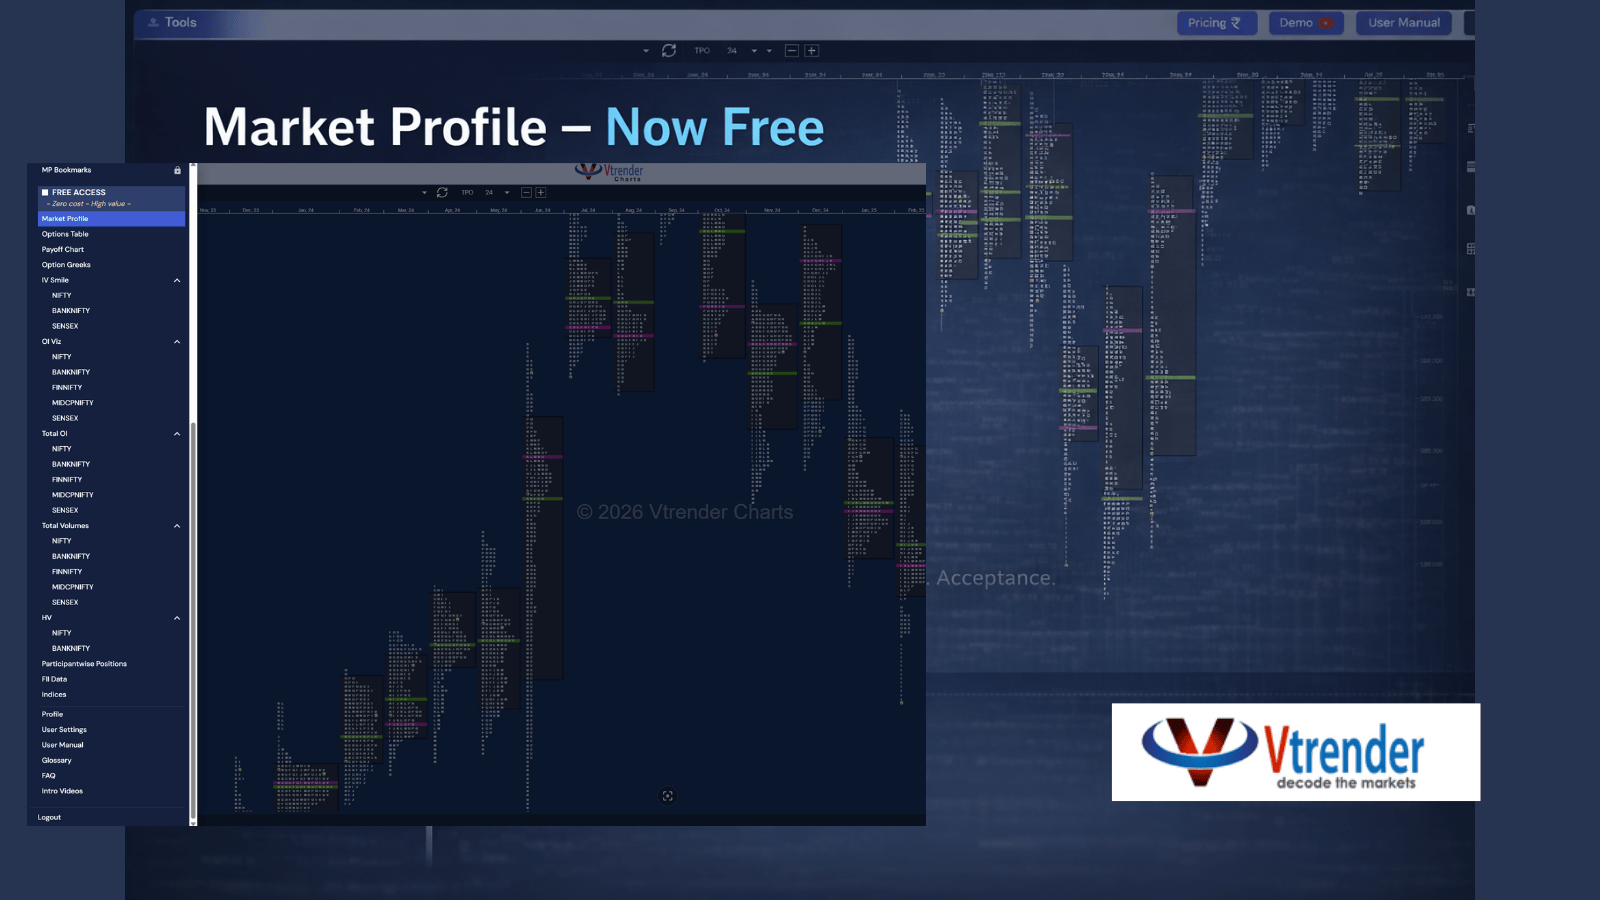
The Vtrender Charts free plan gives Market Profile for Nifty, BankNifty, Sensex, and Bankex — the foundation layer before Order Flow and options tools.
Read More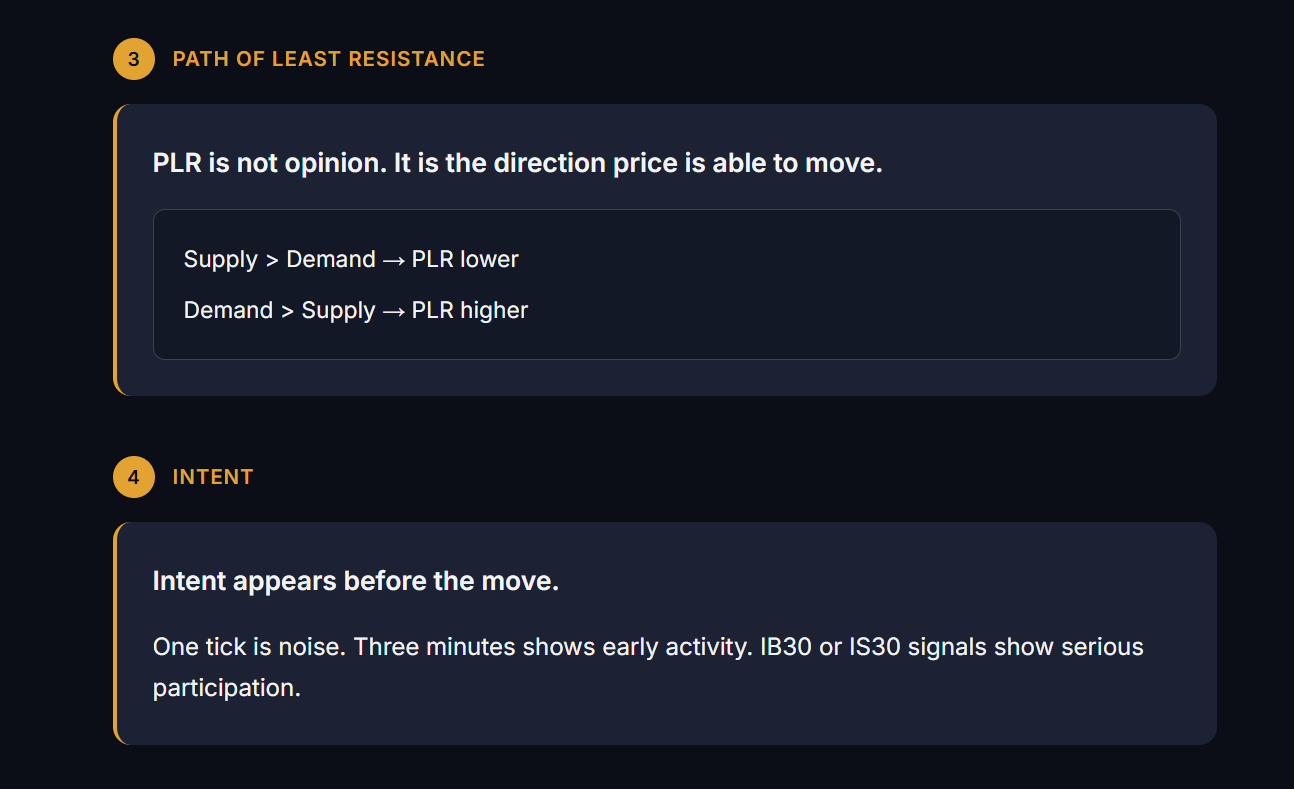
How Order Flow and PLR help NSE and BSE traders read supply, demand, initiative activity, and the path of least resistance on Vtrender Charts.
Read More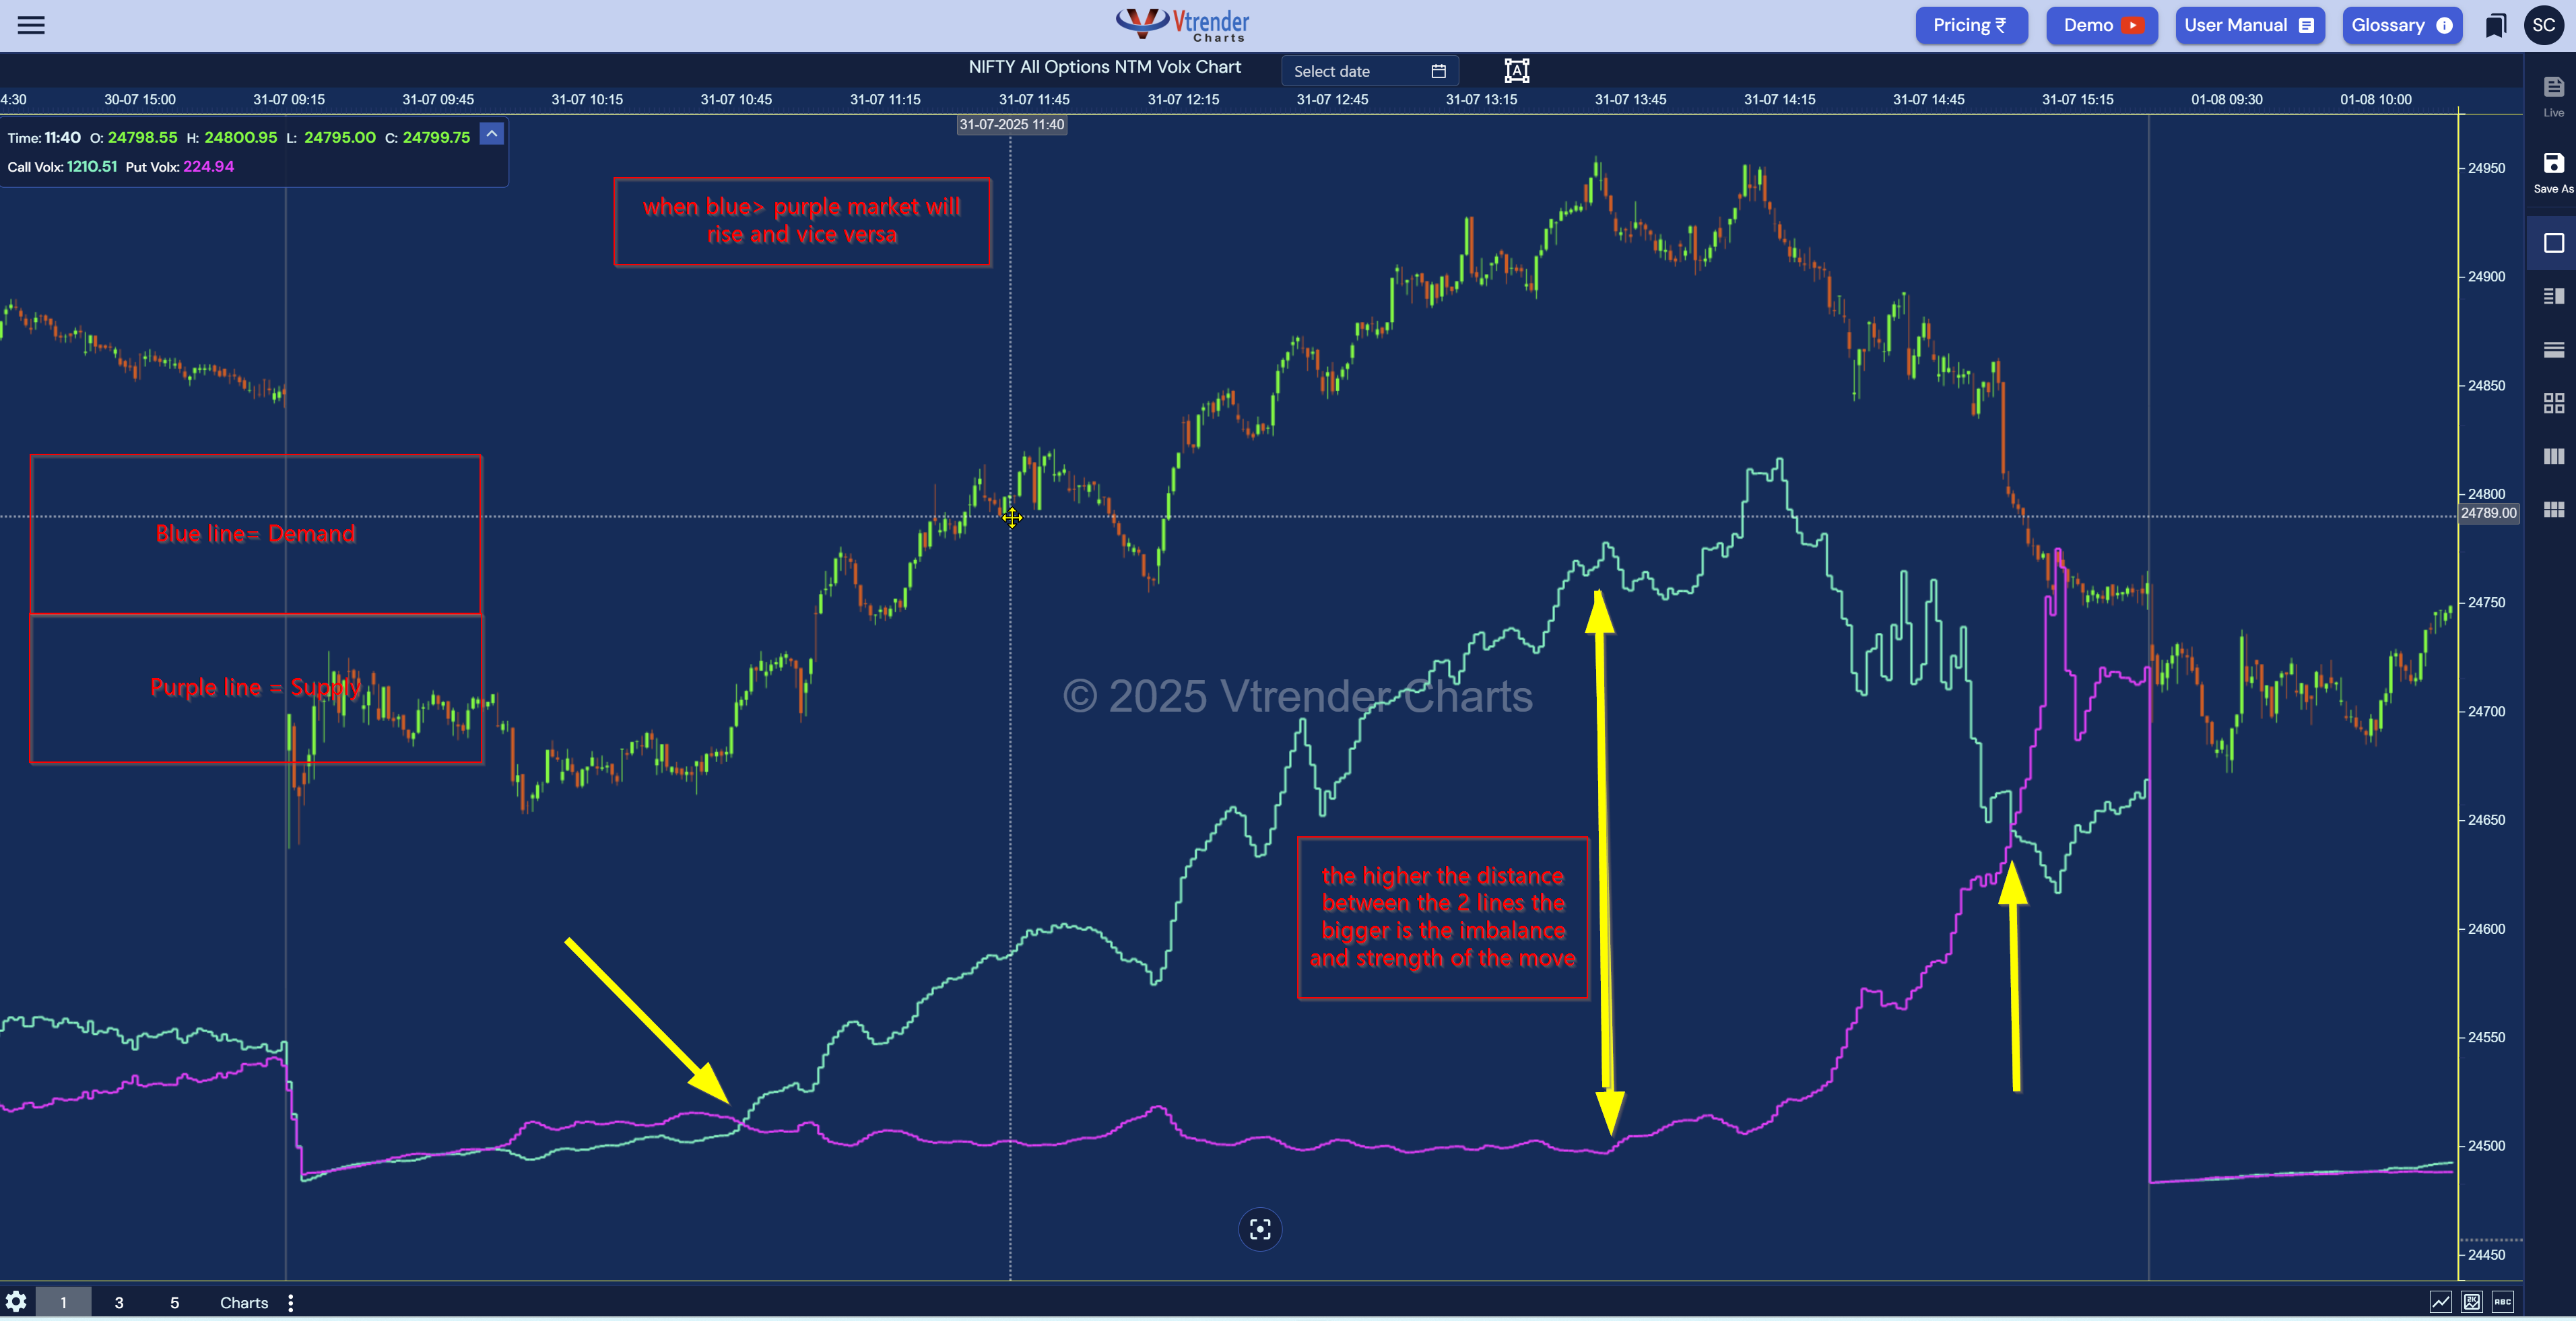
Learn how NTM VolX and VXR range reveal near-the-money options pressure, buyer control, seller control and range shifts on NIFTY.
Read More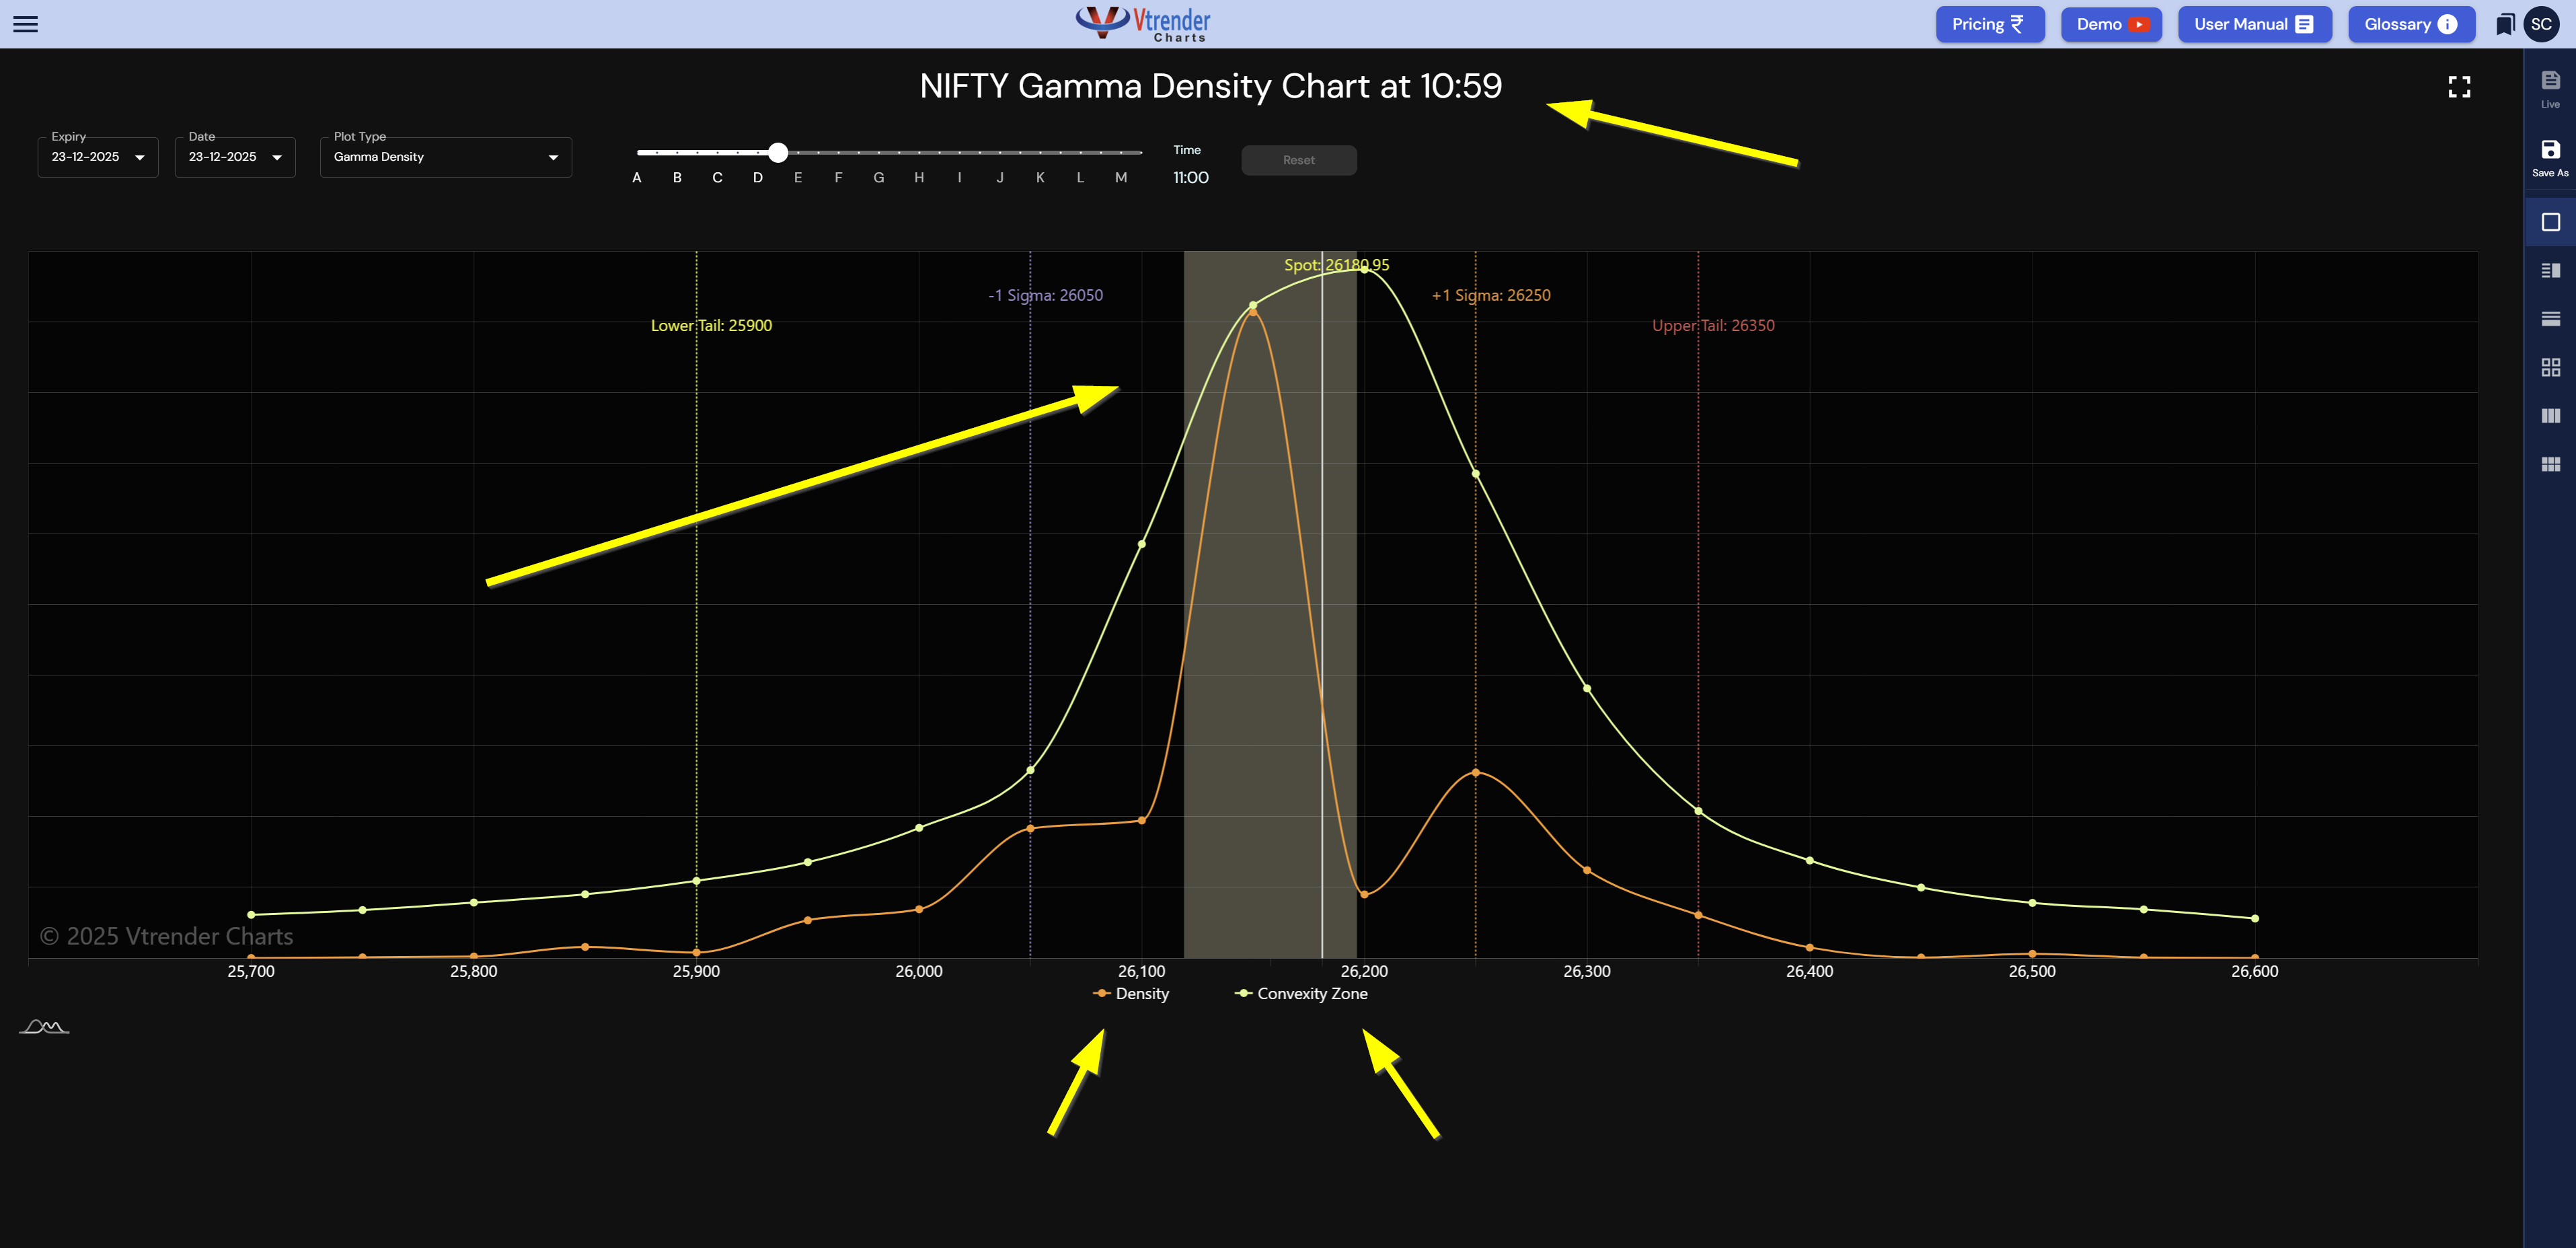
Learn the Gamma 3 framework: Gamma Density, Gamma Exposure and Convexity for reading NIFTY options positioning and risk.
Read More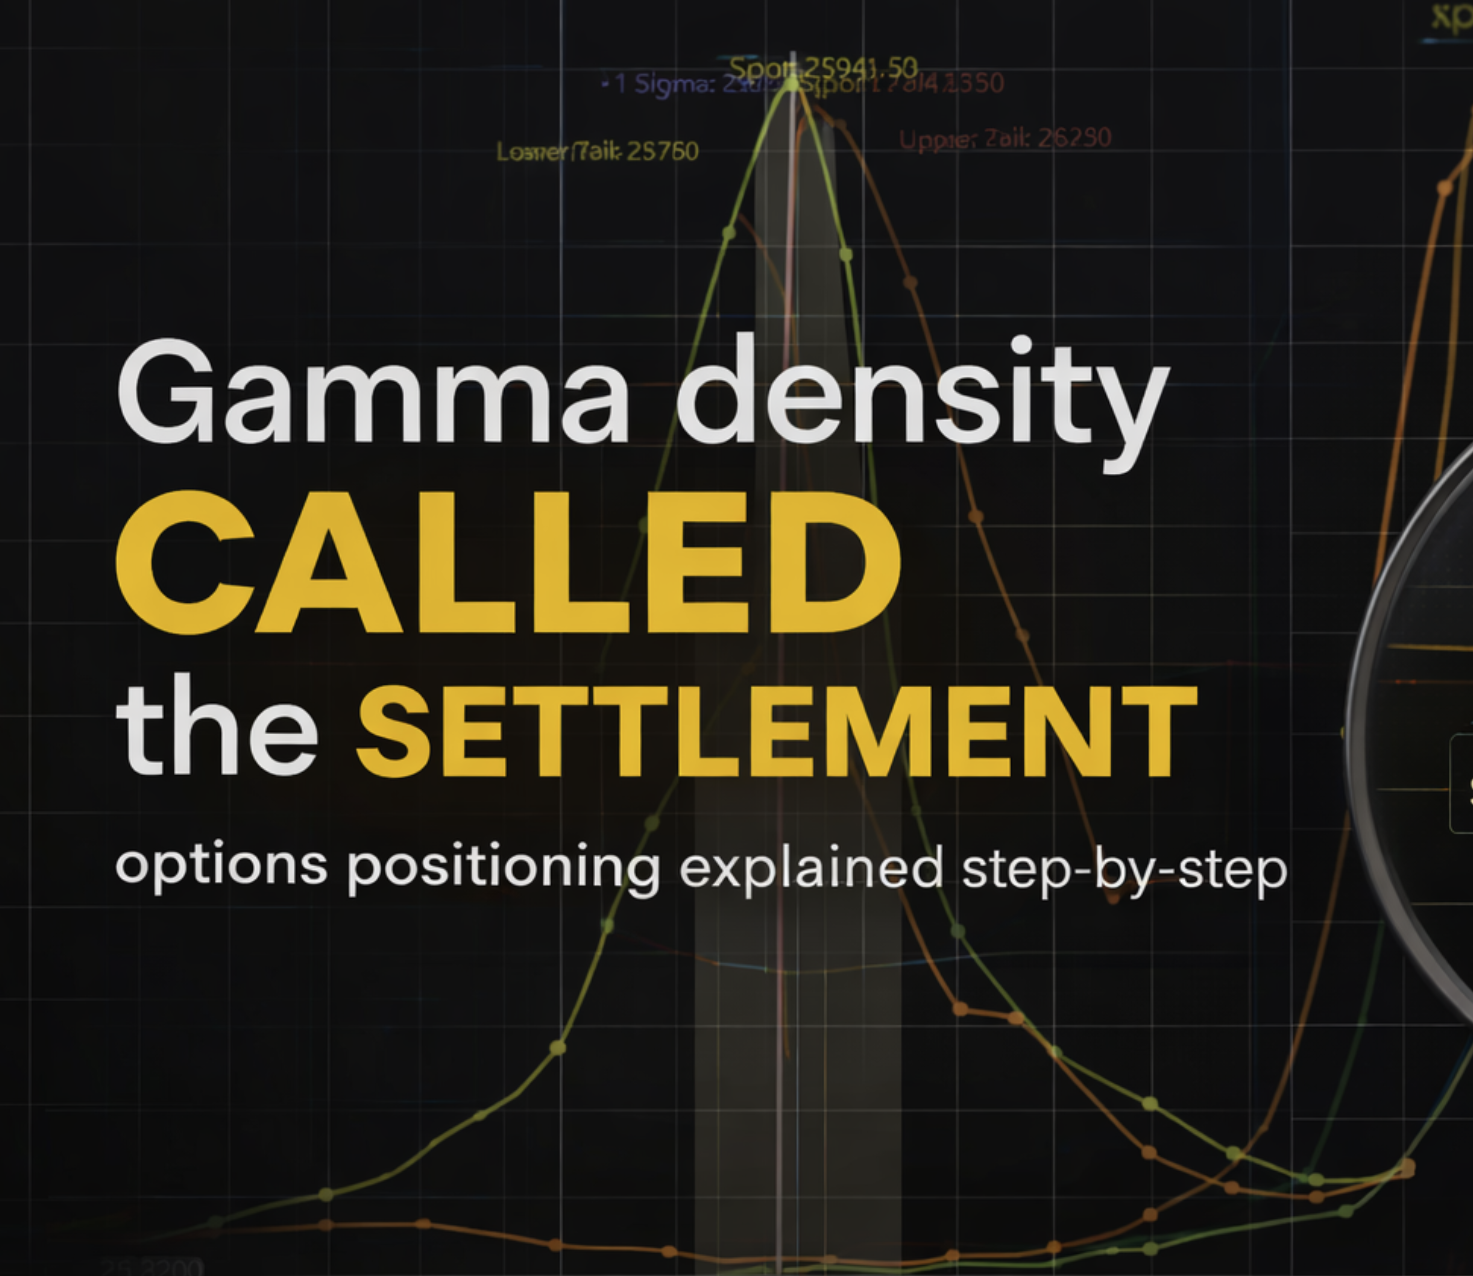
A Vtrender case study on how Gamma Exposure, Gamma Density, Options Table and Market Profile can explain NIFTY settlement behaviour. the learning goal is simple: see the magnet → respect the walls → understand the breakout conditions.
Read More
A NIFTY weekly expiry case study showing how Gamma Exposure, OI, Spectrum and Options Table can explain settlement pinning. ₹17,492 Crore OI at One Strike ₹1,000 Crore Peak Gamma Exposure 5.5 Hours of Institutional Pinning A Vtrender Educational Case Study www.vtrender.com
Read More