Love Vtrender Charts? Check out our new offer!

This document is designed to introduce the concept of Order Flow Analysis, starting with foundational definitions and progressively moving into the mechanics and practical applications used by advanced traders.
Read More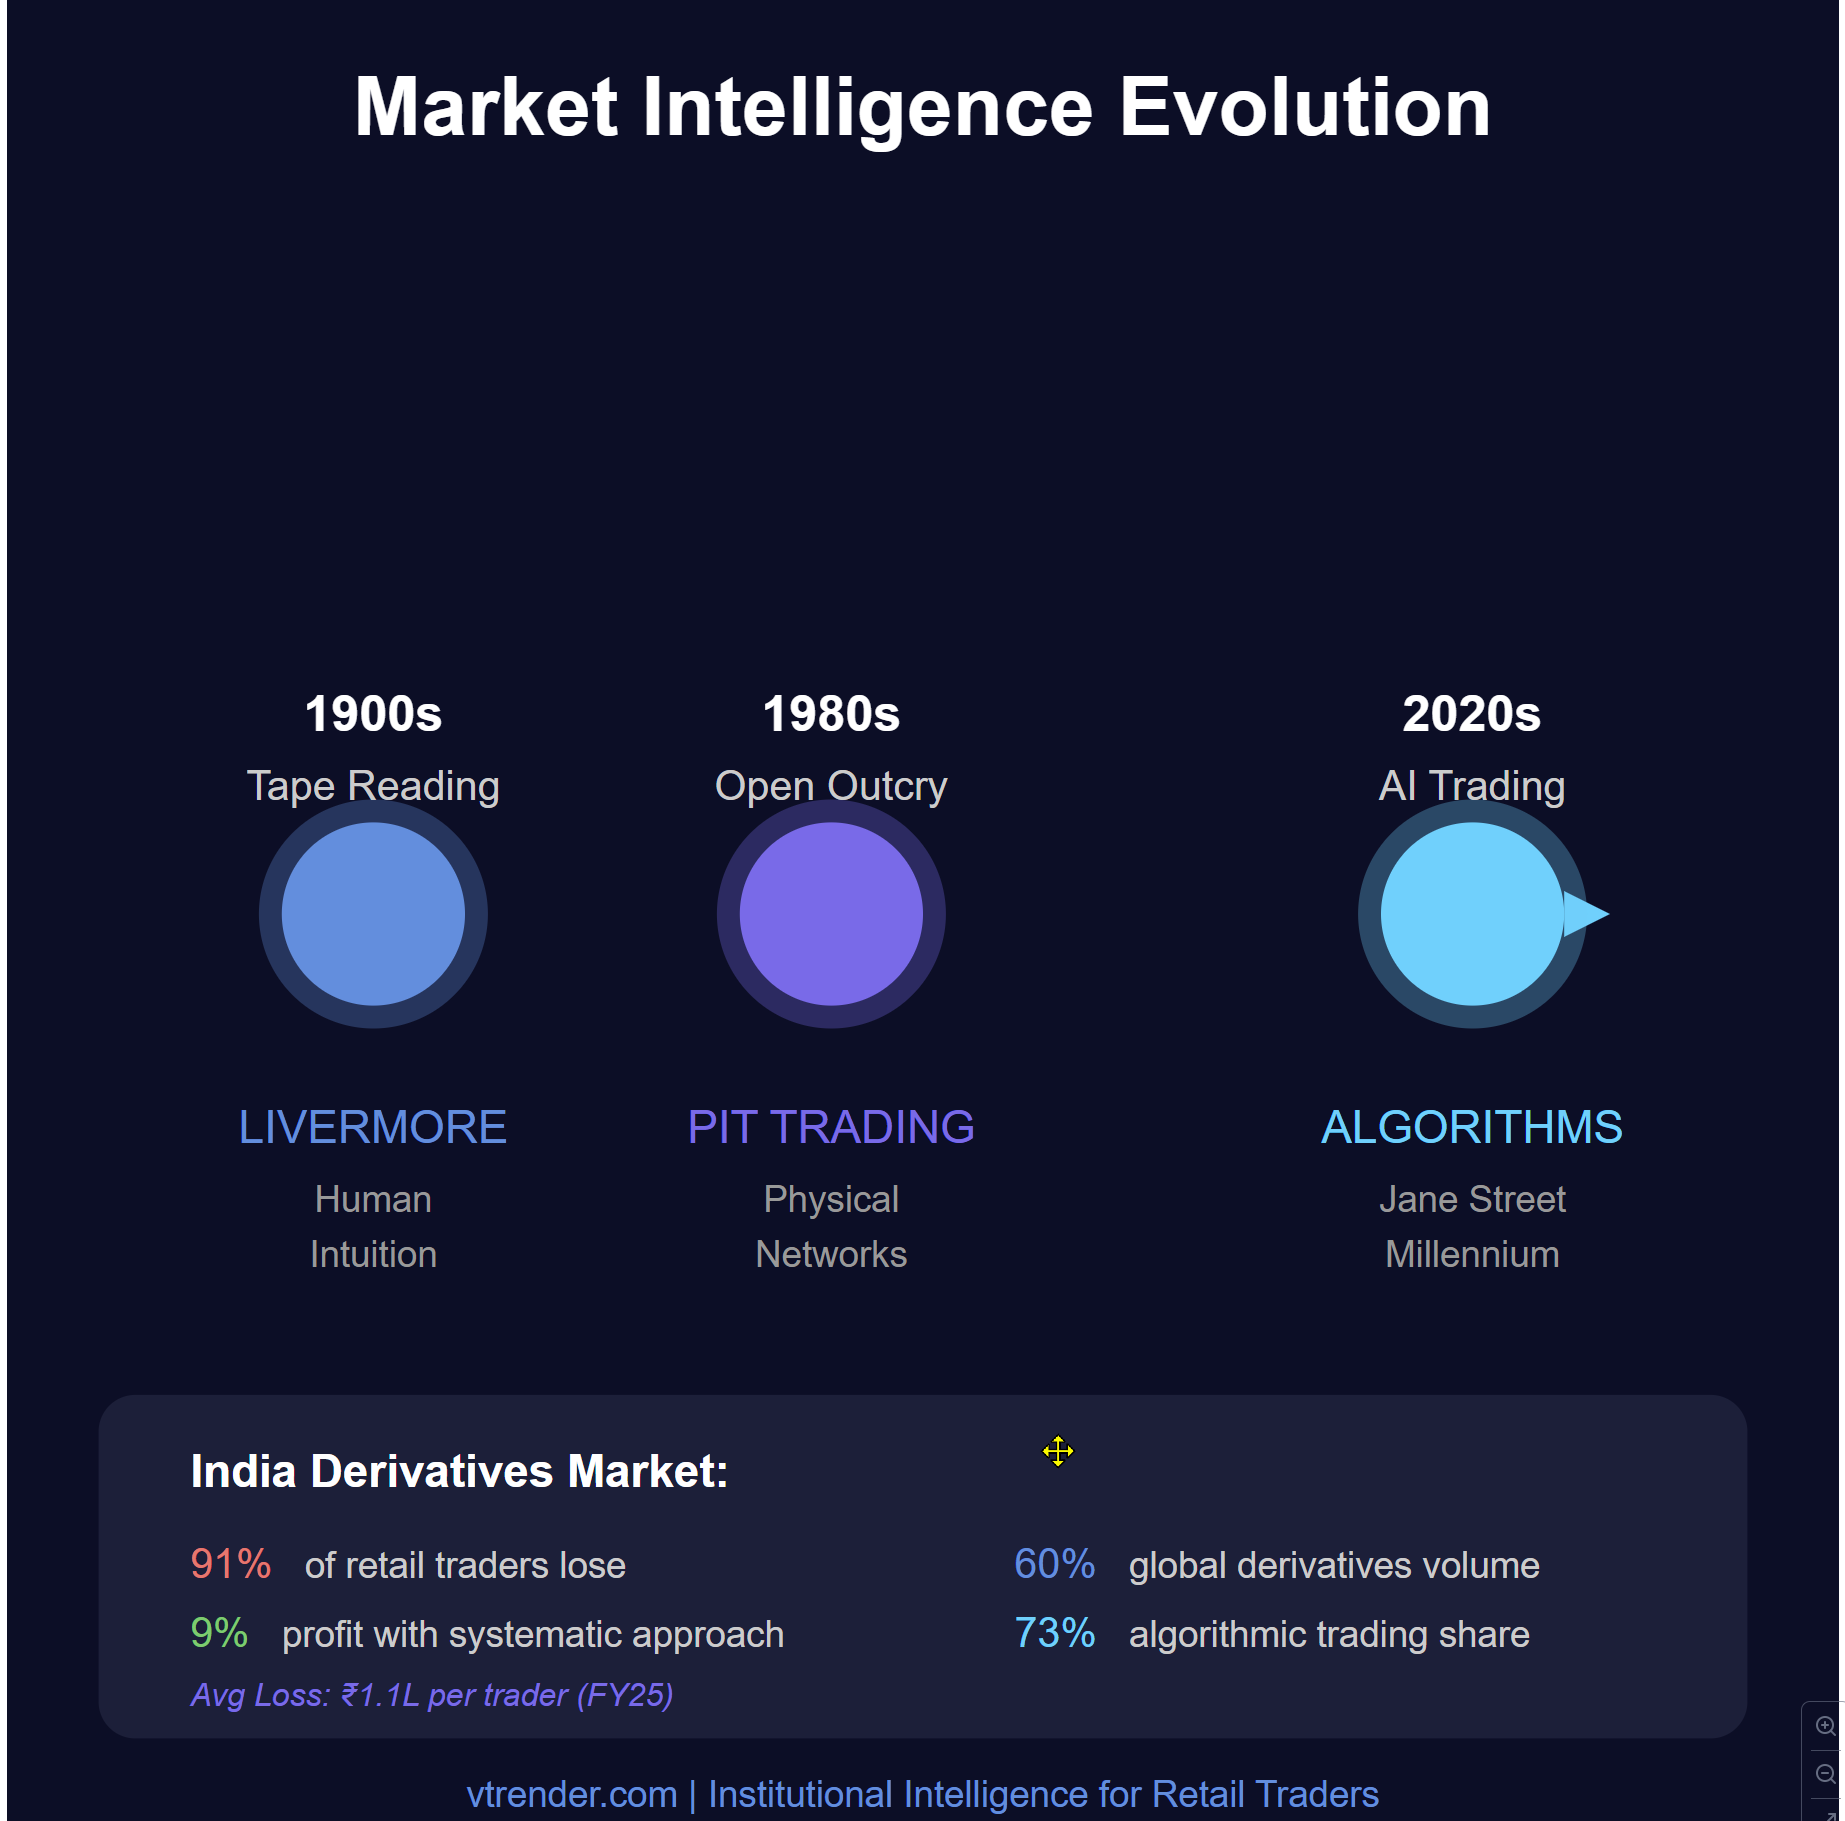
Read why 91% of Indian retail traders lose in derivatives while institutions profit billions—and how Order Flow and Market Profile analysis can position you alongside the smart money.
Read More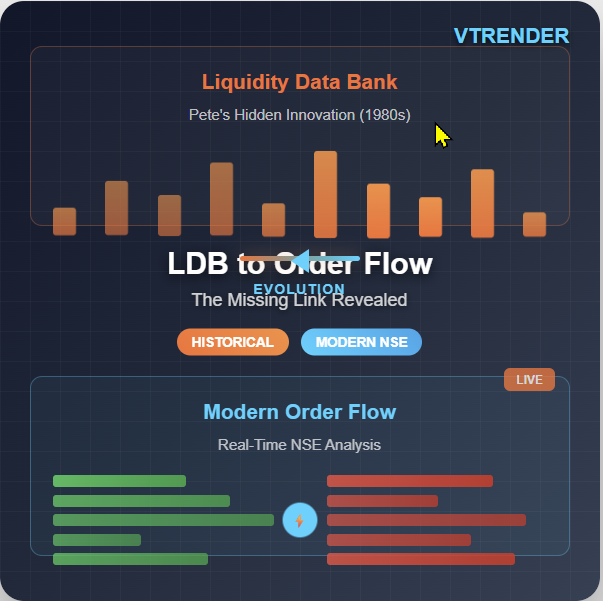
Understanding the missing link between Market Profile and today's real-time Order Flow trading
Read More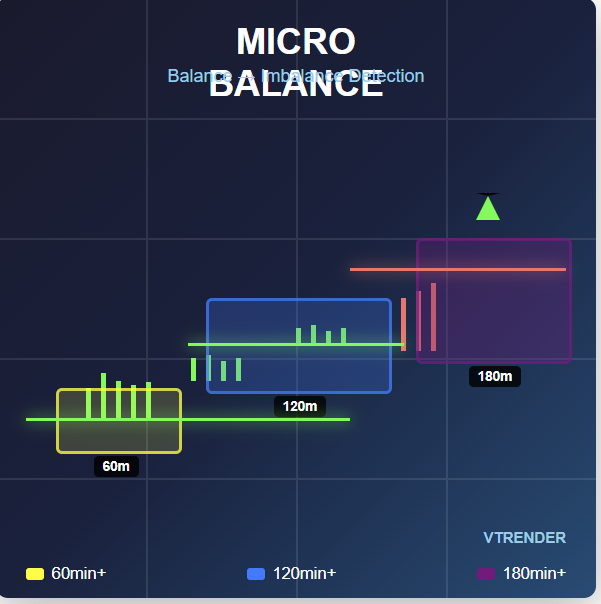
Revolutionary color-coded zones that identify institutional accumulation and distribution patterns in real-time across all timeframes - Yellow, Blue, and Purple zones reveal where smart money is positioning. Trade breakouts from these balance areas with institutional precision using 1:1 risk-reward ratios, entering with the smart money flow rather than against it. Transform boring sideways consolidations into high-probability setups by understanding when balance becomes imbalance - bringing Market Profile theory to Indian derivatives trading
Read More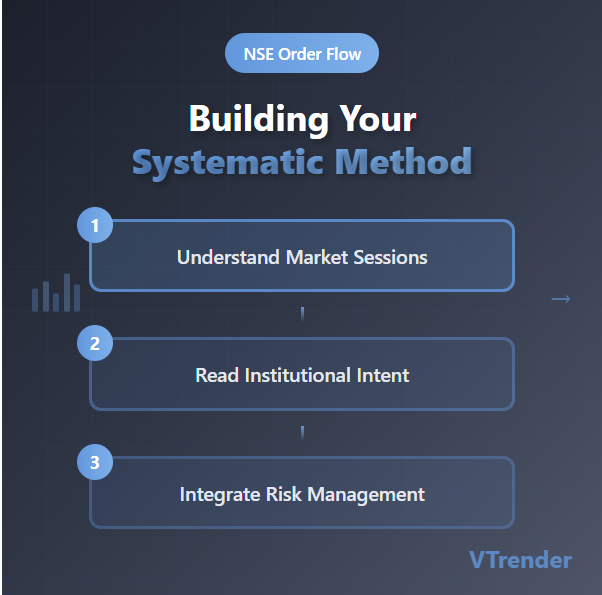
Learn to create a systematic trading approach that reveals institutional activity in NSE derivatives. Move beyond traditional technical analysis by building a method that shows you what smart money is doing in real-time. Discover how to read Initiative Buyers/Sellers, use COT data for position sizing, and develop institutional-level market intuition. Transform from reactive pattern trading to proactive systematic decision-making using live order flow intelligence from Bank Nifty and Nifty derivatives markets.
Read More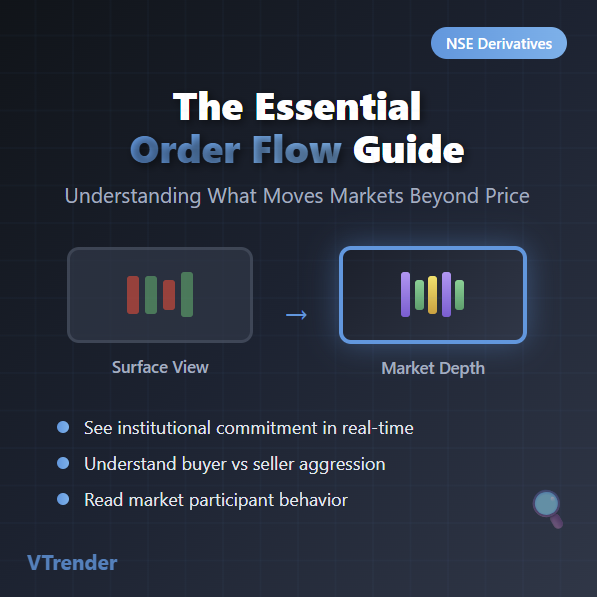
The Essential Order Flow Guide: Understanding What Moves Markets Beyond Price "Discover how to read institutional intent in NSE derivatives markets through order flow analysis. Learn to see beyond traditional charts and understand the real-time buyer vs seller commitment that drives Bank Nifty and Nifty movements. Transform from reactive price-watching to proactive market intelligence.
Read More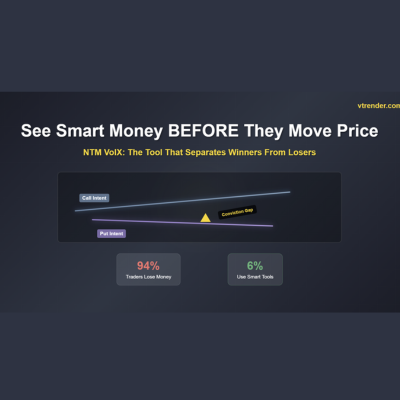
A simple but powerful chart that reveals the real-time battle between Demand and Supply. No filters. No lag. No guesswork. We call it the NTM VolX Chart.
Read More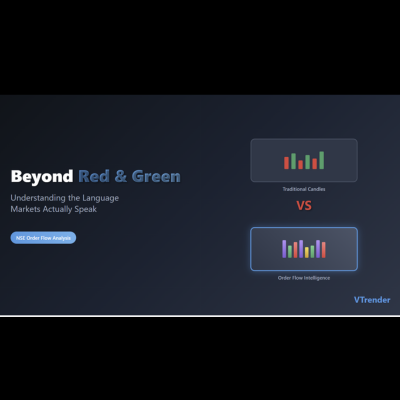
Why traditional OHLC data, even at one-minute intervals, misses the entire story. Those bars can tell you that price moved from point A to point B, but they can't tell you how it got there, who pushed it there, or why it moved with such force or hesitation. It's like having a recipe that lists ingredients but skips all the cooking instructions.
Read More
A beginner's guide to decoding the invisible hand that pushes and pulls stock prices - and why every trader needs to understand this powerful concept
Read More