
Love Vtrender Charts? Check out our new offer!
Most traders live in a single-window world.
One chart. One pane. One perspective.
But markets don’t move in a straight line — they unfold in layers.
Price, volume, intent, positioning — each tells a part of the story.
The question is: are you reading all of it?
At Vtrender, we’ve built the Multi-Window mode into our charts because today’s derivatives markets demand a cockpit, not a rear-view mirror. You need to see context, intent, and execution — together.
The single-window trader is always reacting — chasing candles, adding indicators, trying to “decode” the last move.
The multi-window trader is anticipating — seeing footprints from big players, stress points from writers, and intent through volume shifts.
That’s the difference.
With 2-window, 3-window, 6-window modes, you’re not just watching the market — you’re stepping into the same lens institutions use.
Think of it like flying:
One dial shows altitude (price).
Another shows wind speed (volume).
Another shows turbulence (options gamma).
Another shows position relative to destination (structure).
Individually, they’re data.
Together, they’re navigation.
Perfect for pairing Market Profile (context) with Orderflow (intent).
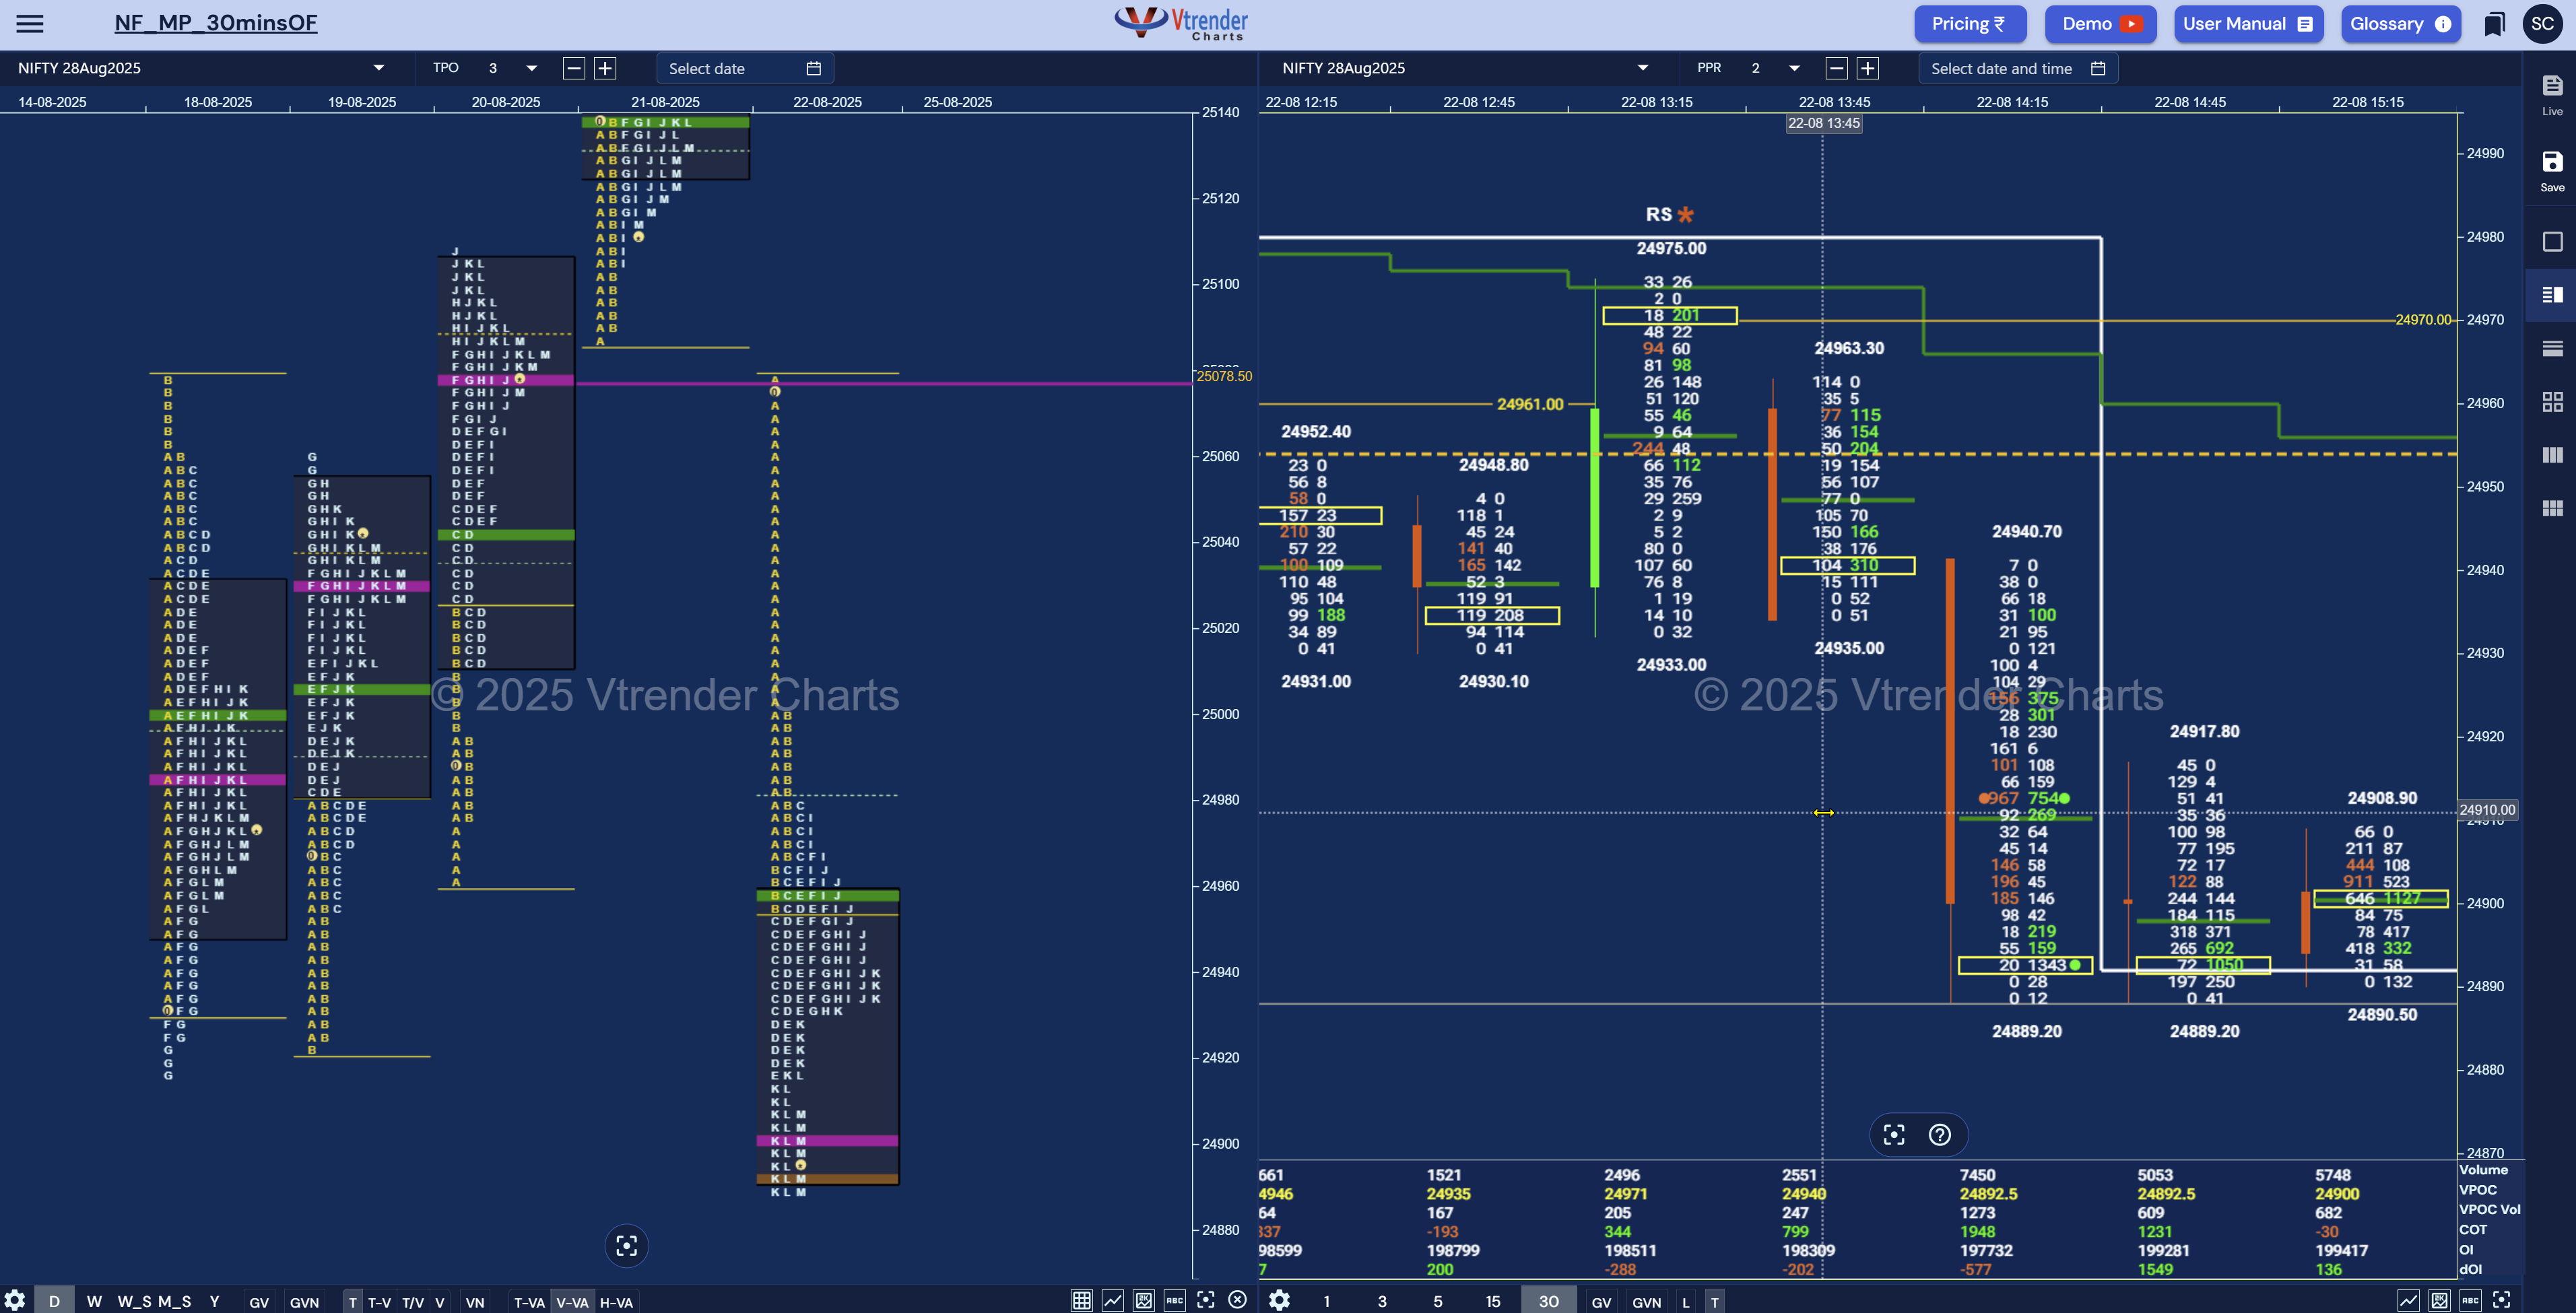
Example: NF - MP & 30min OF
Example: BNF - MP/30min OF
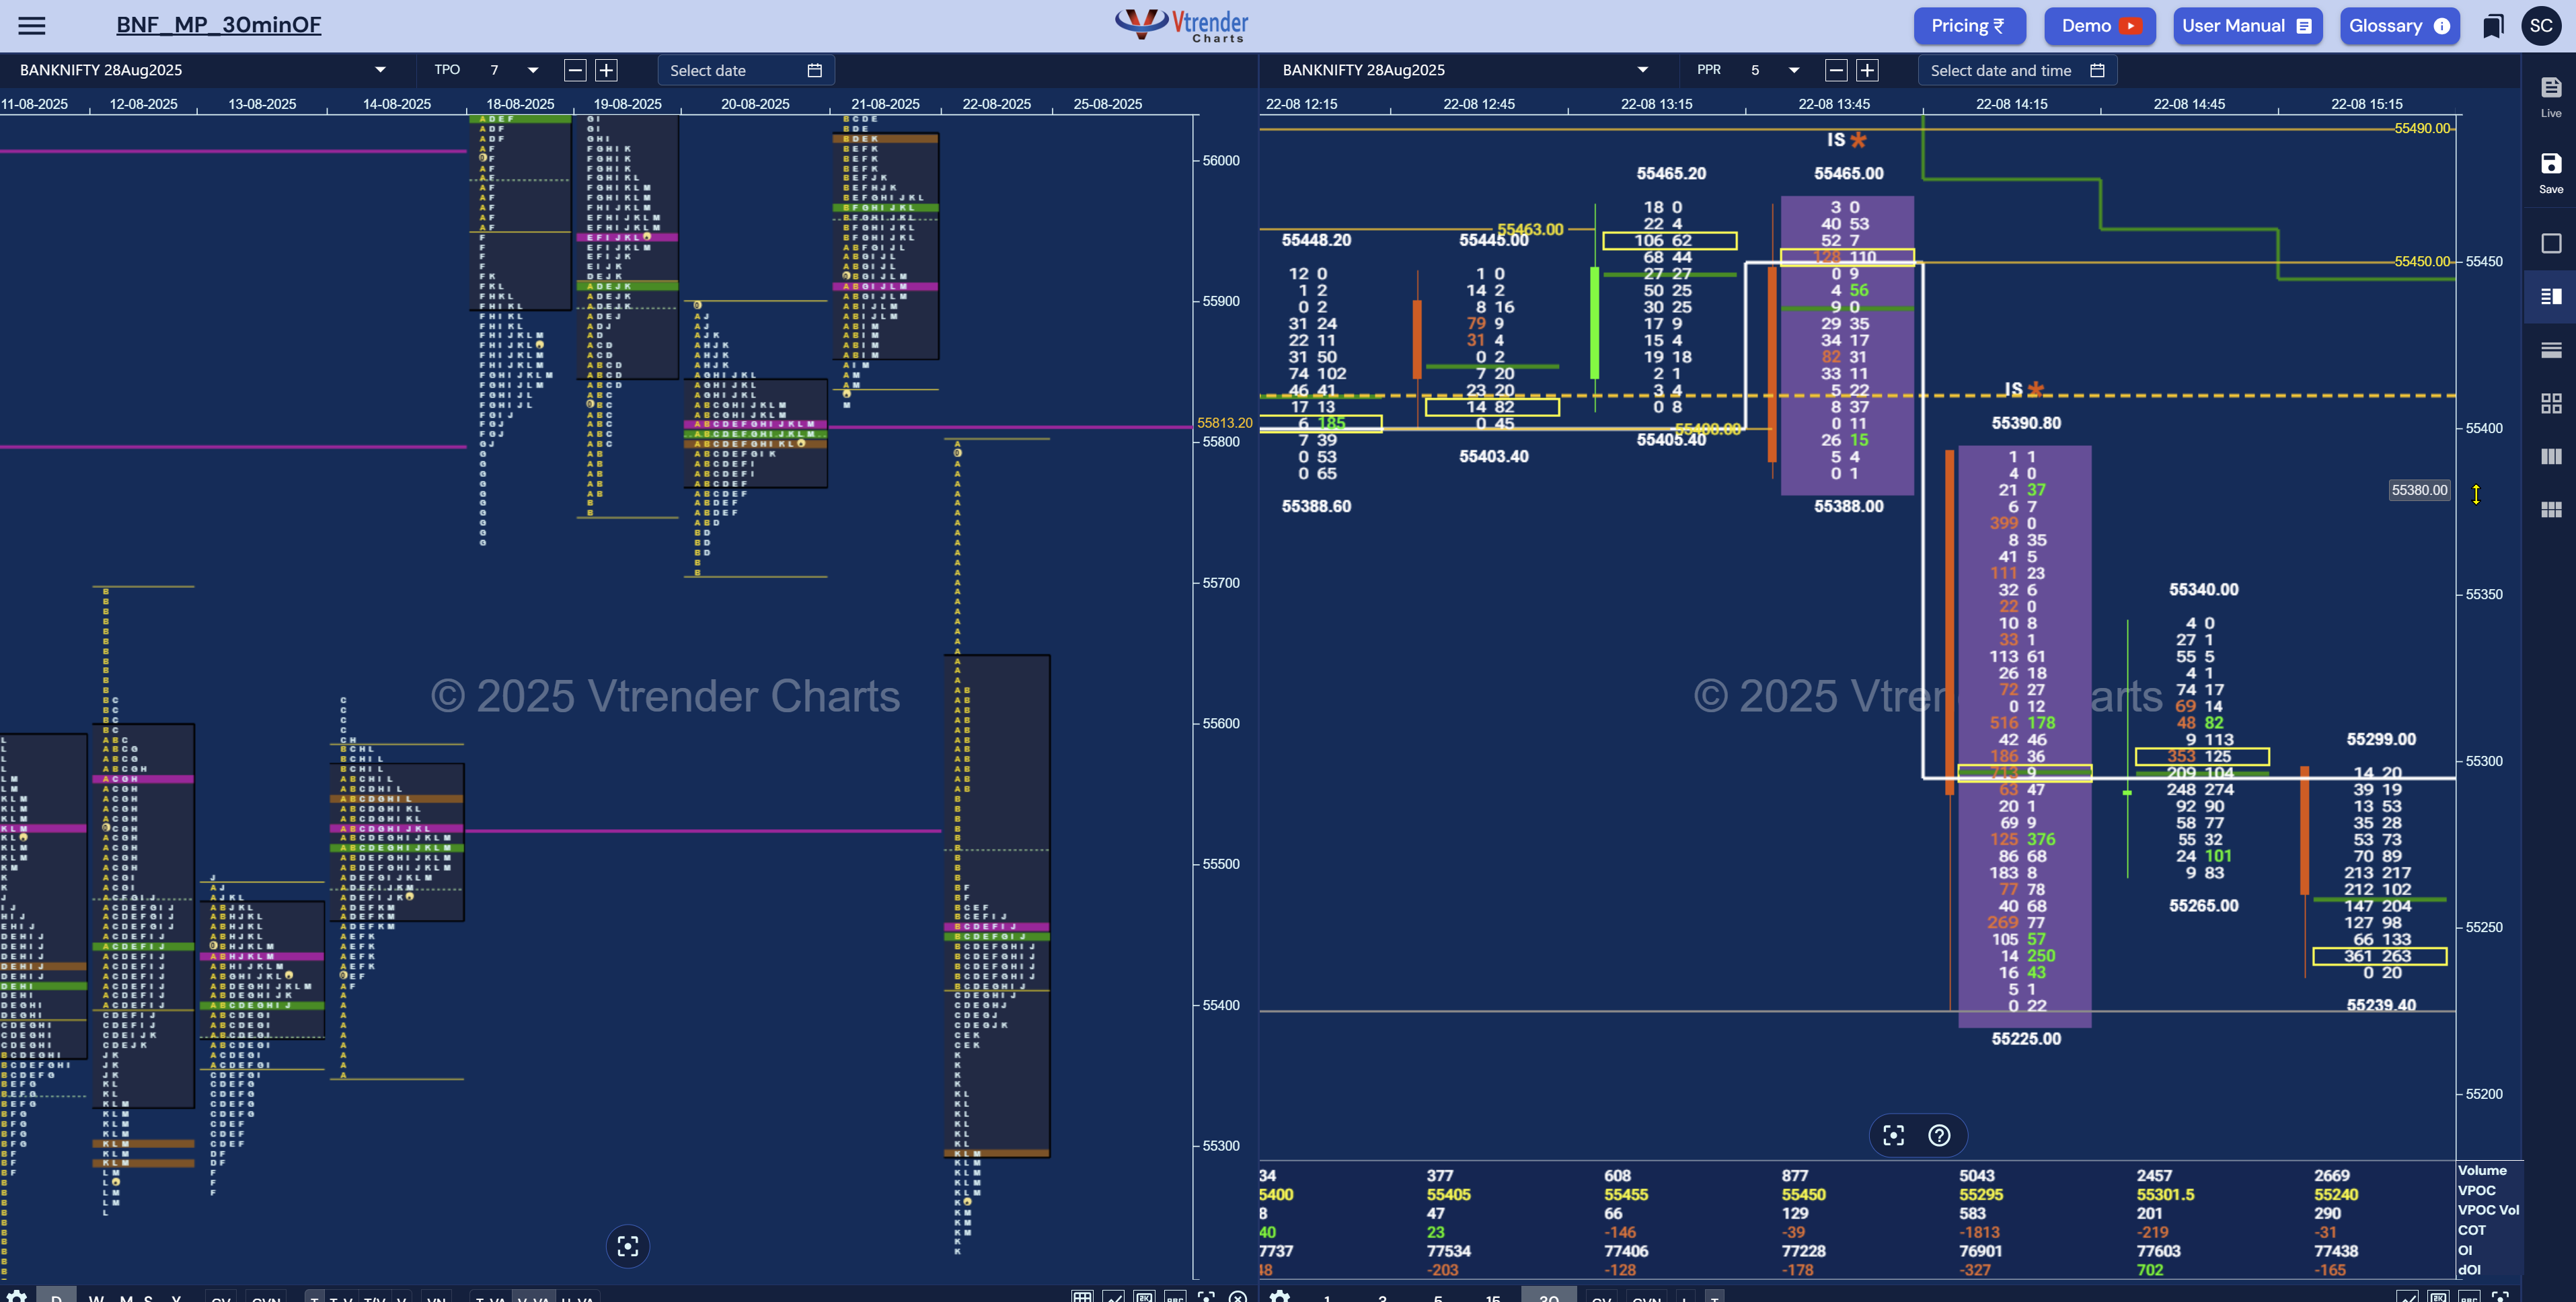
Here, one pane shows you balance, ranges, and value migration. The other reveals IB/IS signals inside the candle — where aggression is real.
This is the quickest upgrade for any trader still staring at naked candles.
Now you add options flow into the mix.
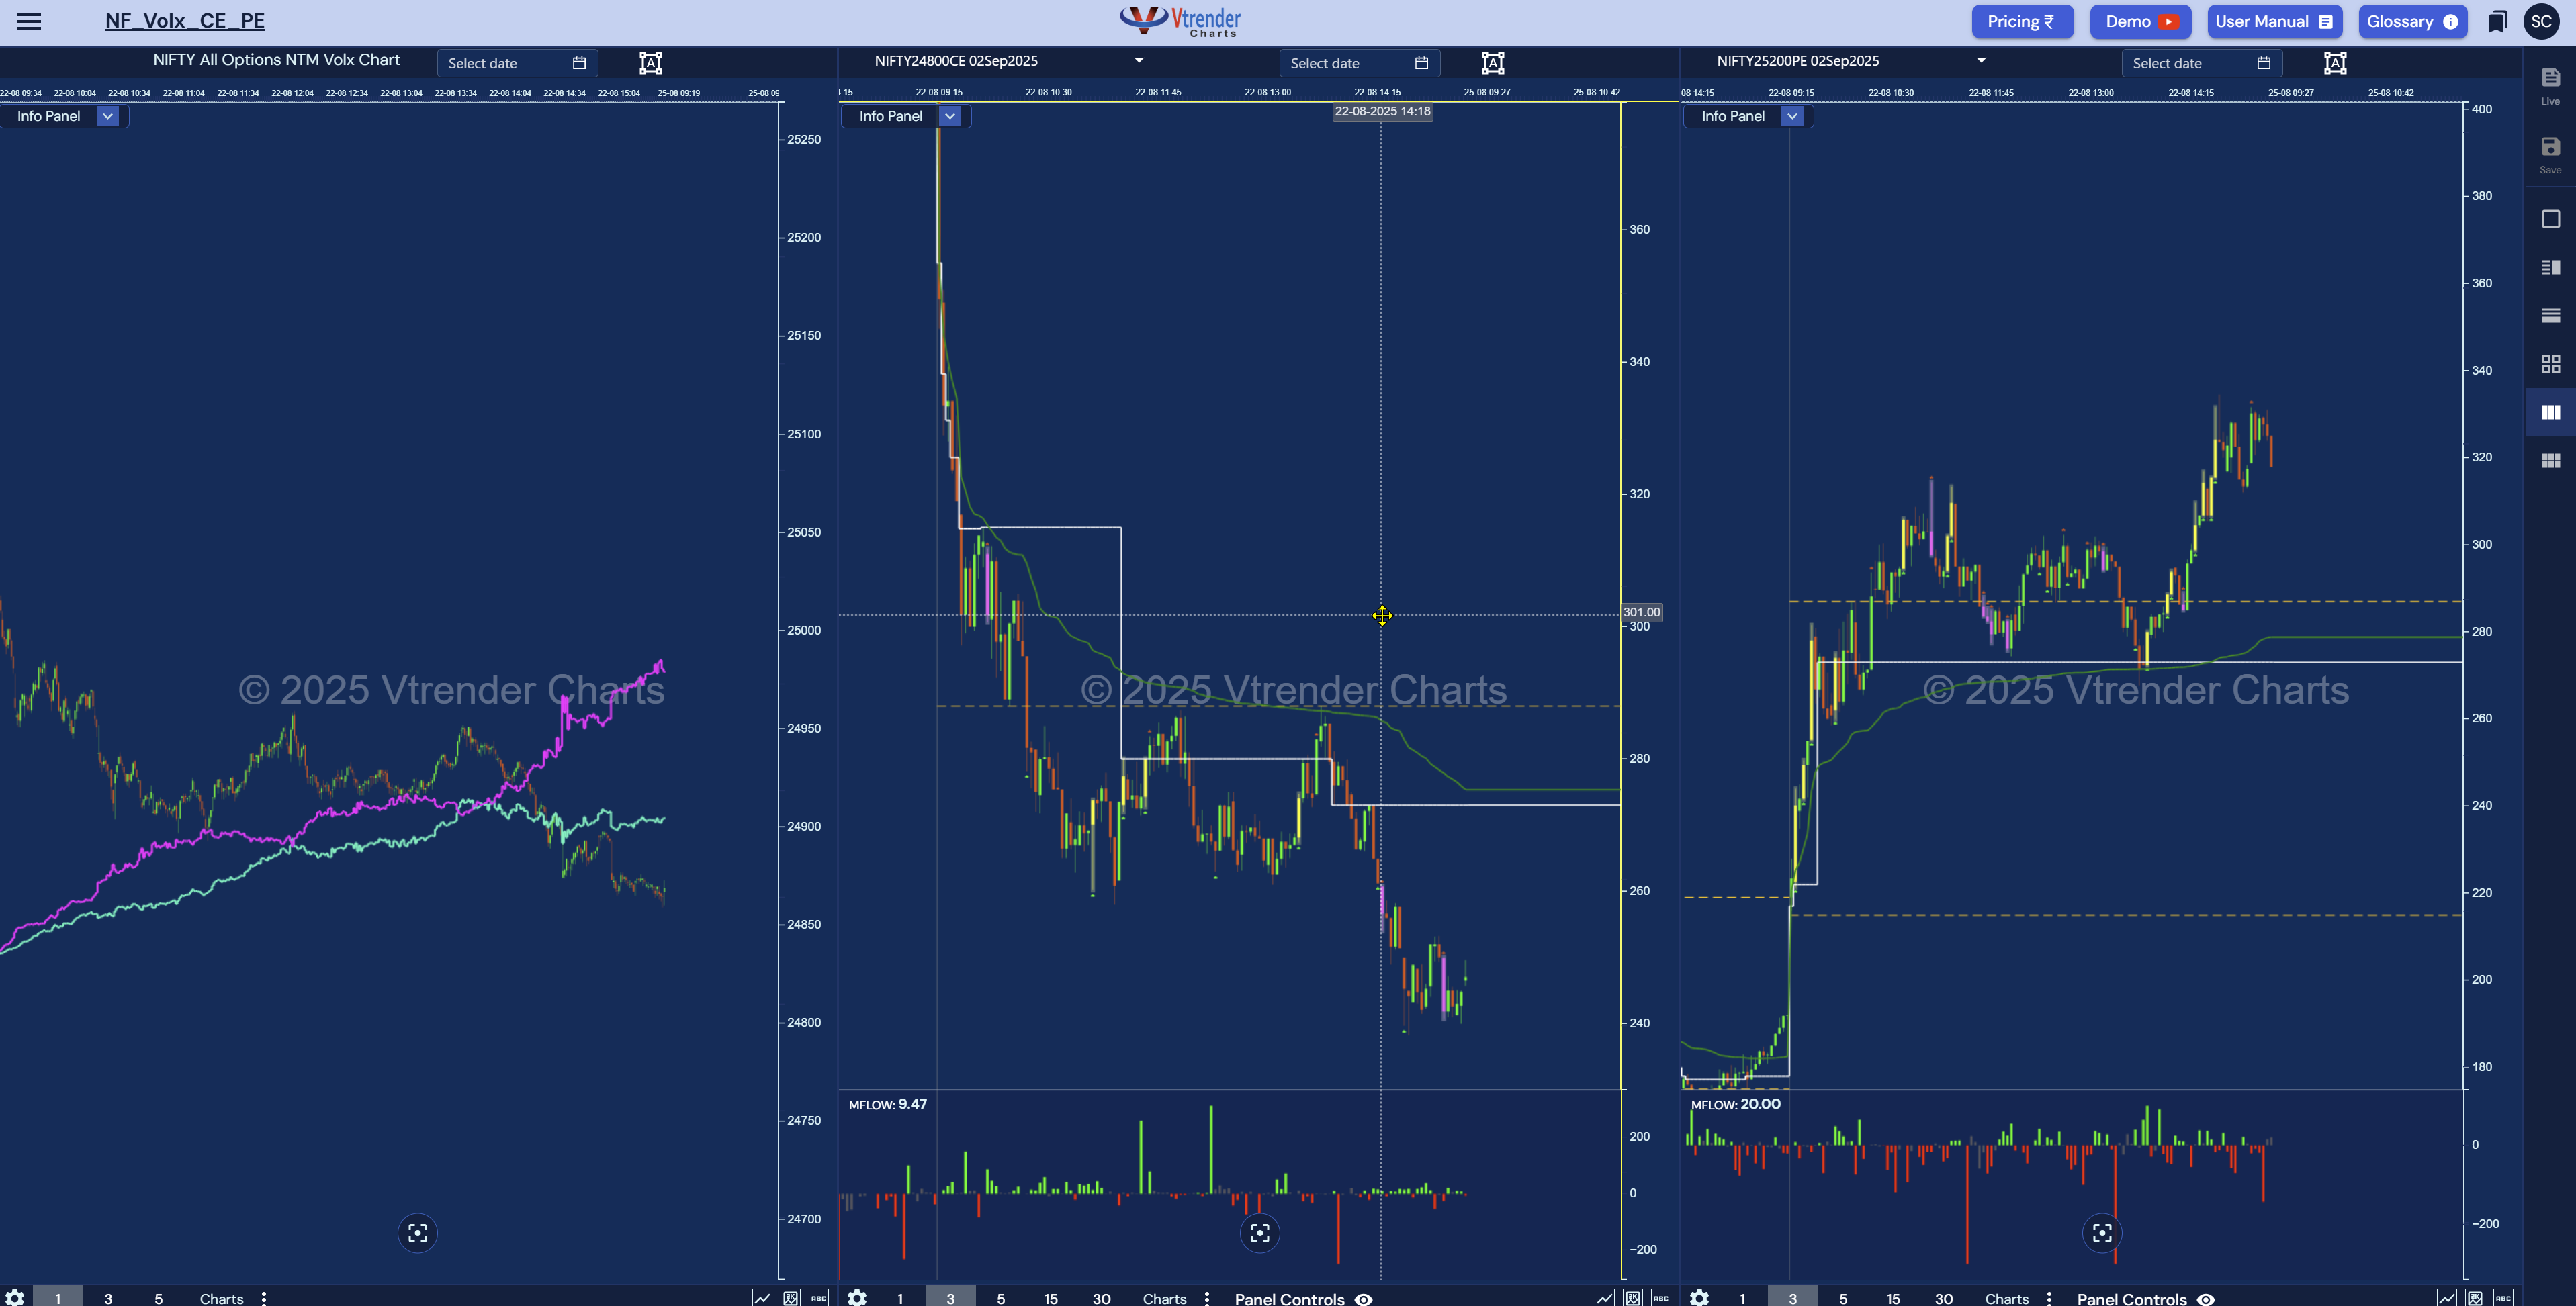
Example: VolX / CE / PE
Example: NF / CE / PE
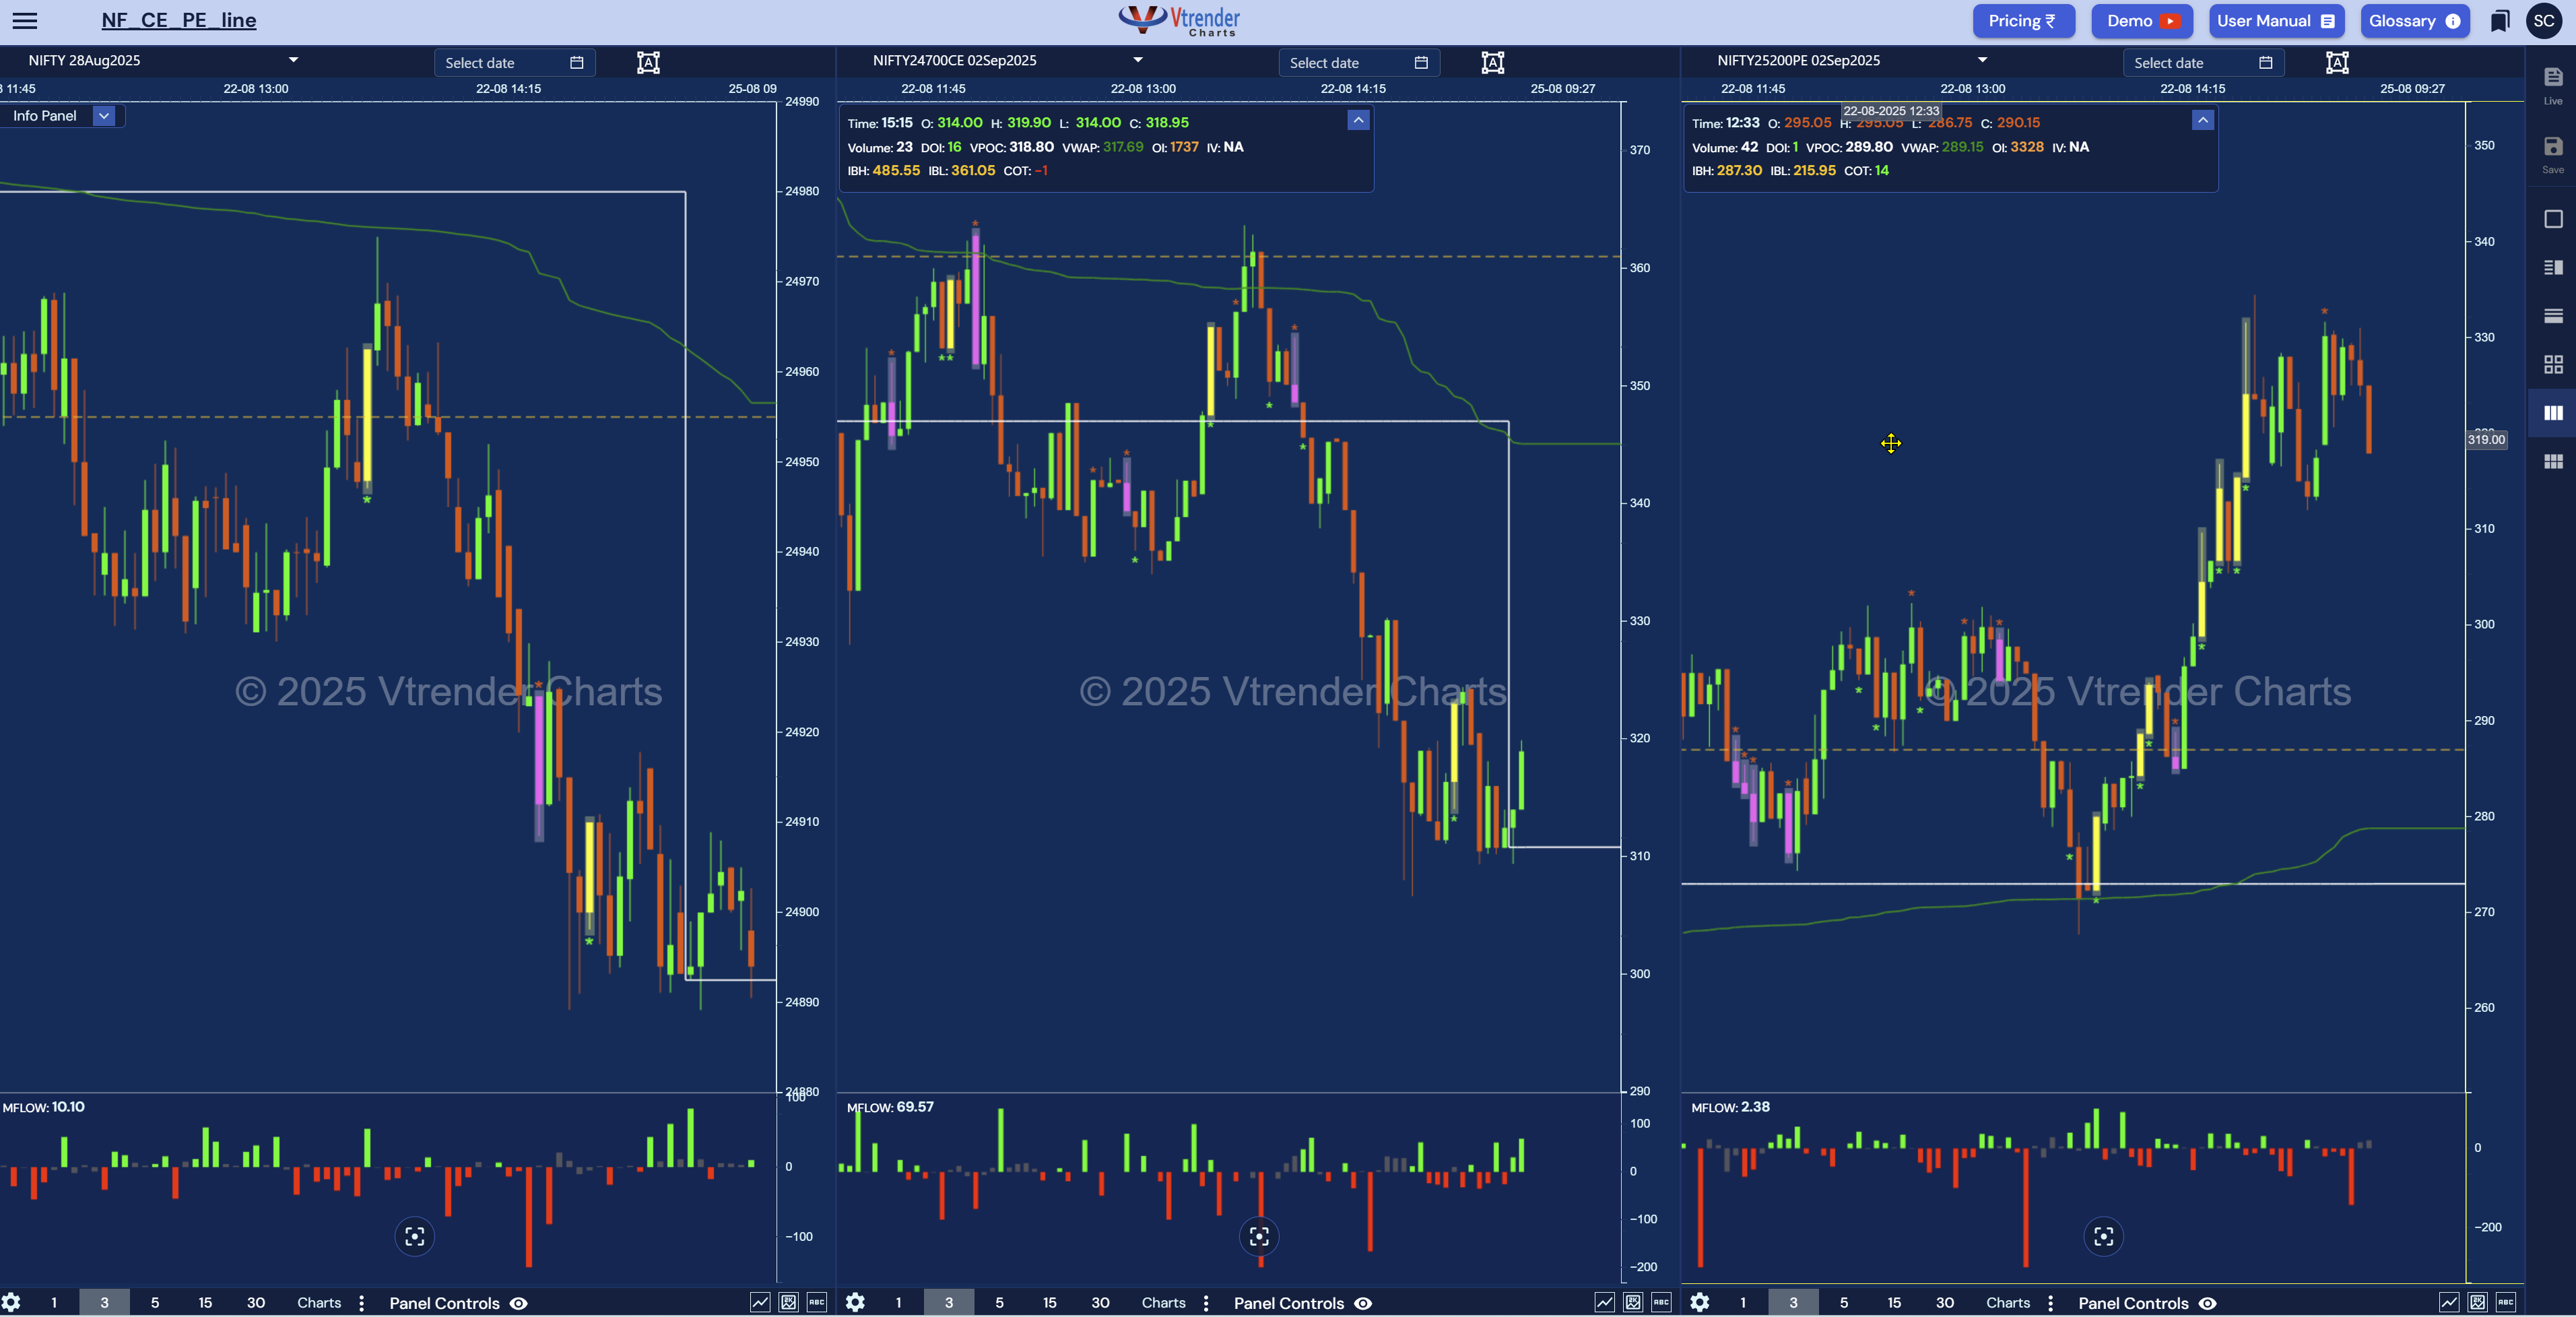
This mode helps you align futures with option writer footprints:
VolX → live demand/supply divergence.
CE/PE → strike-by-strike intent.
Futures → the surface price reaction.
When you see divergence between futures and options, you’re watching intent vs. noise in real time.
The control room setup.
Example: 6 Window Mode
Here you combine:
Market Profile balances
Orderflow IB/IS signals
Spectrum (writers’ intent)
Gamma Density (expected range)
Open Interest overlays
Futures/Options footprints
It’s the institutional lens. And once you trade from here, the one-window world feels like driving a car with the windshield blacked out.
During the webinar, we shared ready-to-use bookmarks. Here are some highlights:
Each of these setups shows how visualization turns raw data into actionable edges.
The derivatives market has evolved.
Candlesticks and RSI once gave an edge. Today, they’re noise.
Institutions track Gamma Density tails, Spectrum shifts, and Orderflow imbalances.
Writers manage the range. Aggressive traders move the tape. And if you’re not tracking them, you’re late by default.
Multi-window mode isn’t a “feature.”
It’s survival.
It trains you to stop reacting to hindsight and start reading footprints in real time.
Here are four ways to level up immediately:
Start simple → Pair MP with OF in a 2-window setup. Context + intent.
Add options flow → Use 3-window mode to see CE/PE positioning.
Spot divergence → Watch when futures disagree with options volume. That’s intent vs. noise.
Build conviction → Use 6-window setups to align structure, intent, and risk zones.
Watch the full webinar replay on YouTube → Multi-Window Visualization Webinar
Explore the live bookmarks listed above.
Practice setting up your own workspace — 2-window, 3-window, or 6-window — until it feels like second nature.
The single-window world is where most traders remain stuck.
They chase price, add indicators, and hope for clarity.
The multi-window world is where professionals operate.
They see structure, intent, positioning, and execution — together.
That’s the difference between guessing and trading with edge.
We built these tools for you — because the market has already moved on.
And once you see it this way, you’ll never trade the old way again.
Welcome to the cockpit.

Markets don't move because indicators change.
Indicators change because markets move.
A practical reference for NSE & BSE derivatives traders. 366 pages, built to sit open beside live charts.