
Love Vtrender Charts? Check out our new offer!
Gamma exposure reveals how options positions create automatic buying and selling pressure in the market, acting like a hidden GPS that guides price movement toward specific levels.
Think of the stock market as a giant tug-of-war game. On one side, you have buyers pulling the rope toward higher prices. On the other side, sellers are pulling toward lower prices. But here's what most people don't realize: there's a third force at play, an invisible hand that can overpower both buyers and sellers. That force is called gamma exposure, and once you understand it, you'll never look at price charts the same way again.
Let me be clear: gamma isn't some mystical concept reserved for Wall Street wizards. It's actually quite simple once we break it down.
Imagine you're driving a car, and every time you press the gas pedal, the car doesn't just speed up—it speeds up faster and faster. That acceleration of speed? That's essentially what gamma does to options positions. It amplifies the movement, creating feedback loops that can send prices soaring or crashing in ways that seem to defy logic.
To understand gamma exposure, we first need to understand gamma itself. Picture this: you're at a playground, and there's a seesaw. When a child sits on one end, the seesaw tilts. That's like delta—the direct relationship between an option's price and the stock price. But now imagine that every time the seesaw tilts, it becomes more sensitive to weight changes. A small child can suddenly have the impact of a much larger person. That increasing sensitivity? That's gamma.
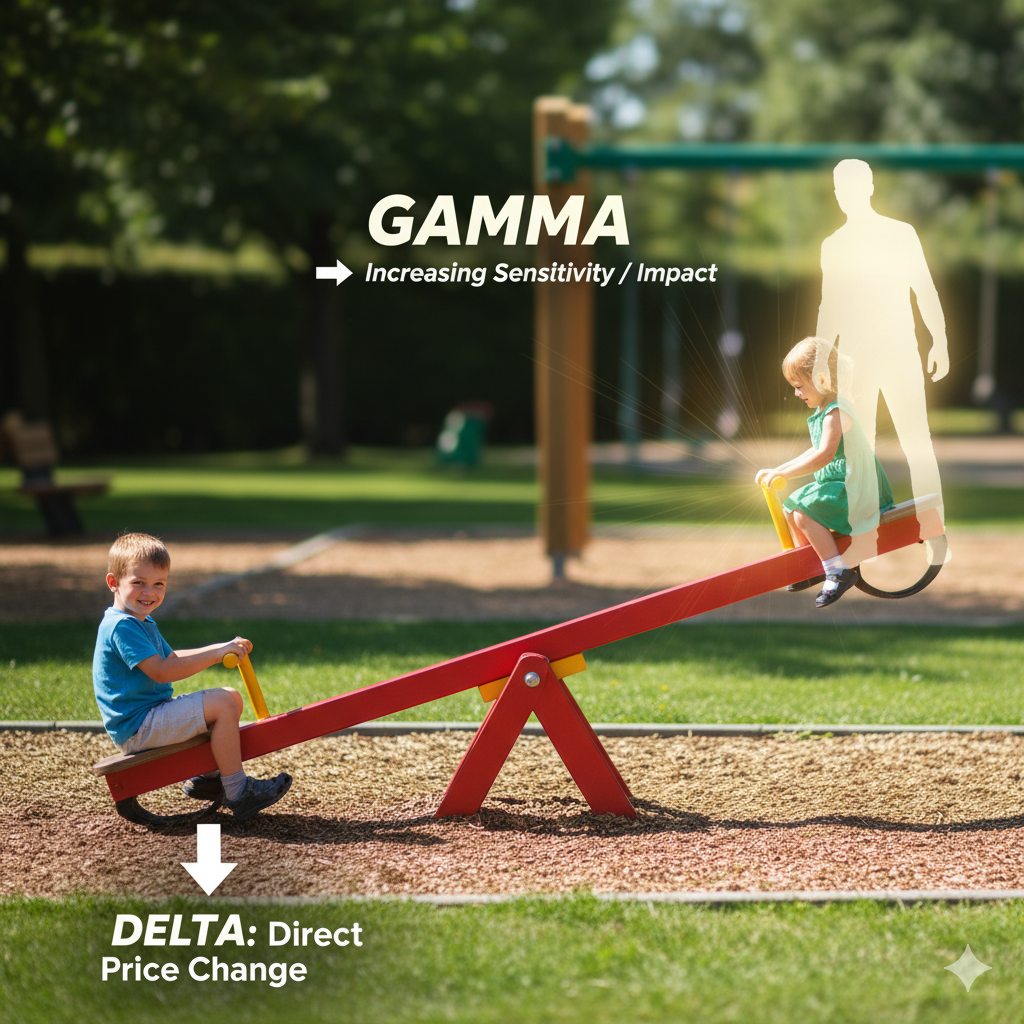
In the options world, gamma measures how much an option's delta changes when the stock price moves. Delta tells you how much your option's price will change for every rupee the stock moves. Gamma tells you how much that sensitivity itself will change. It's the rate of change of the rate of change—acceleration in its purest form.
Here's where it gets interesting for traders: when you own options, you have gamma. When you sell options, you're short gamma. And this creates entirely different behaviors in your position. Think of it this way: owning gamma is like having a sports car that becomes more responsive the faster you go. Being short gamma is like driving a truck that becomes harder to steer as you pick up speed.
W have covered some of this previously. Do give it a look - https://vtrender.com/posts/-long-gamma-vs-short-gamma-see-what-the-pros-see-now-you-can-too
When you're long gamma—meaning you own more options than you've sold—your position accelerates in your favor when the market moves your way, and it decelerates your losses when the market moves against you.
Let's use a simple example. Suppose you buy a call option when NIFTY is at 25,000. If NIFTY moves to 25,100, your option might gain ₹50. But here's the gamma magic: if NIFTY continues to 25,200, your option doesn't just gain another ₹50—it might gain ₹70 or ₹80. Why? Because gamma increased your delta as the market moved in your favor. Your winning position is now winning faster.
Conversely, if NIFTY drops to 24,900, your option might lose ₹30. But if it continues falling to 24,800, it might only lose another ₹20. Your delta decreased, slowing down your losses. This is why professional traders often describe long gamma positions as "self-correcting"—they naturally reduce risk when things go wrong and amplify profits when things go right.
This creates what we call the gamma smile. When markets are calm, your long gamma position might seem boring, even losing money to time decay. But when volatility strikes—and it always does—your position comes alive, providing protection and profit in ways that seem almost magical to the uninitiated.
Being short gamma is an entirely different animal. When you sell options—particularly when you sell more than you buy—you become short gamma. This means your position works against you as markets move. Small moves become big problems, and big moves can become disasters.
Think of short gamma like being a firefighter. Most days are calm, and you collect your steady paycheck—that's the premium you receive from selling options. But when the fire alarm goes off, you don't get to stay home. You have to run toward the danger, not away from it. In trading terms, when markets move against your short gamma position, you're forced to buy high and sell low, over and over again.
Here's a practical example: imagine you sell a call option on NIFTY at 25,000, collecting ₹100 in premium. If NIFTY stays near 25,000, you keep the premium—easy money. But if NIFTY shoots up to 25,300, you're not just losing money on the option you sold. Your short gamma means you're losing money at an accelerating rate. The first 100 points might cost you ₹150, but the next 100 points might cost you ₹250. The position bleeds faster and deeper the more it moves against you.
This is why many retail traders who start by selling options—attracted by the steady premium collection—eventually blow up their accounts. They think they're running a money-printing business until the market reminds them that they're actually sitting on a financial time bomb with a gamma fuse.
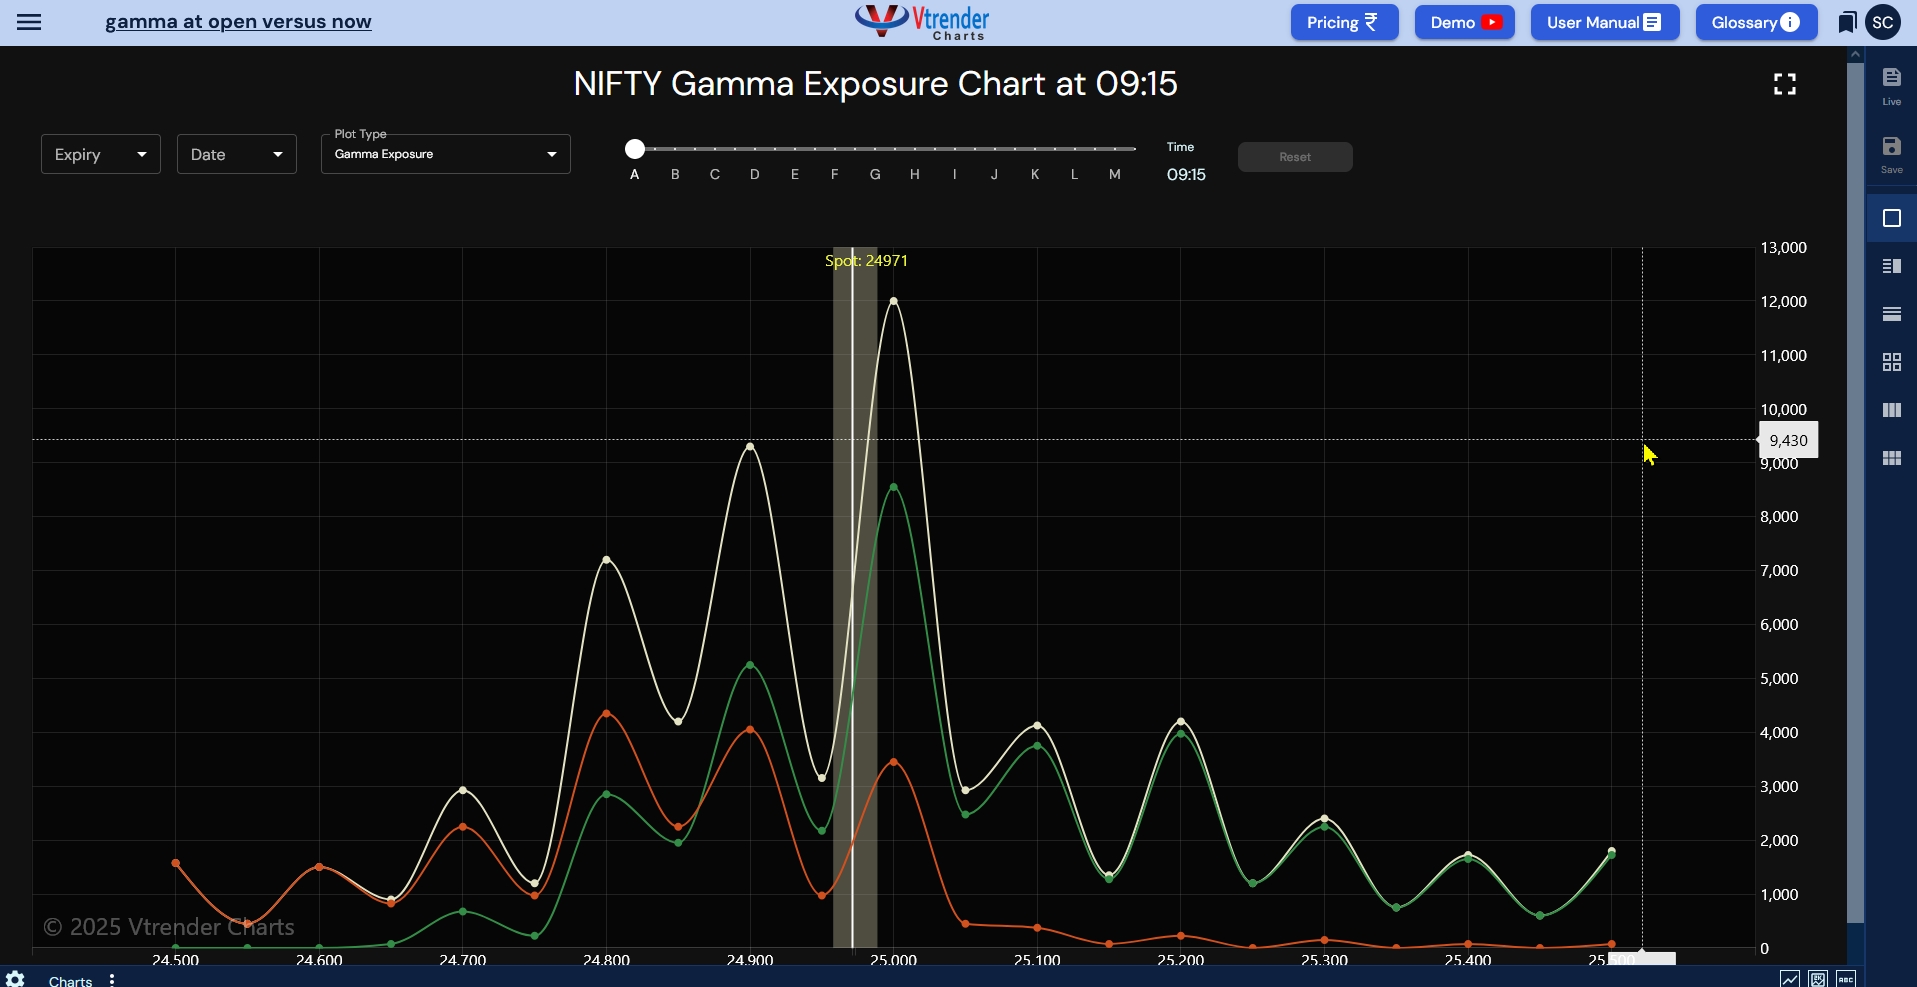
Now, let's look at our NIFTY Gamma Exposure chart and decode what it's really telling us. This isn't just pretty lines and colors—it's a real-time map of market forces that shows you where the hidden buying and selling pressure lives.
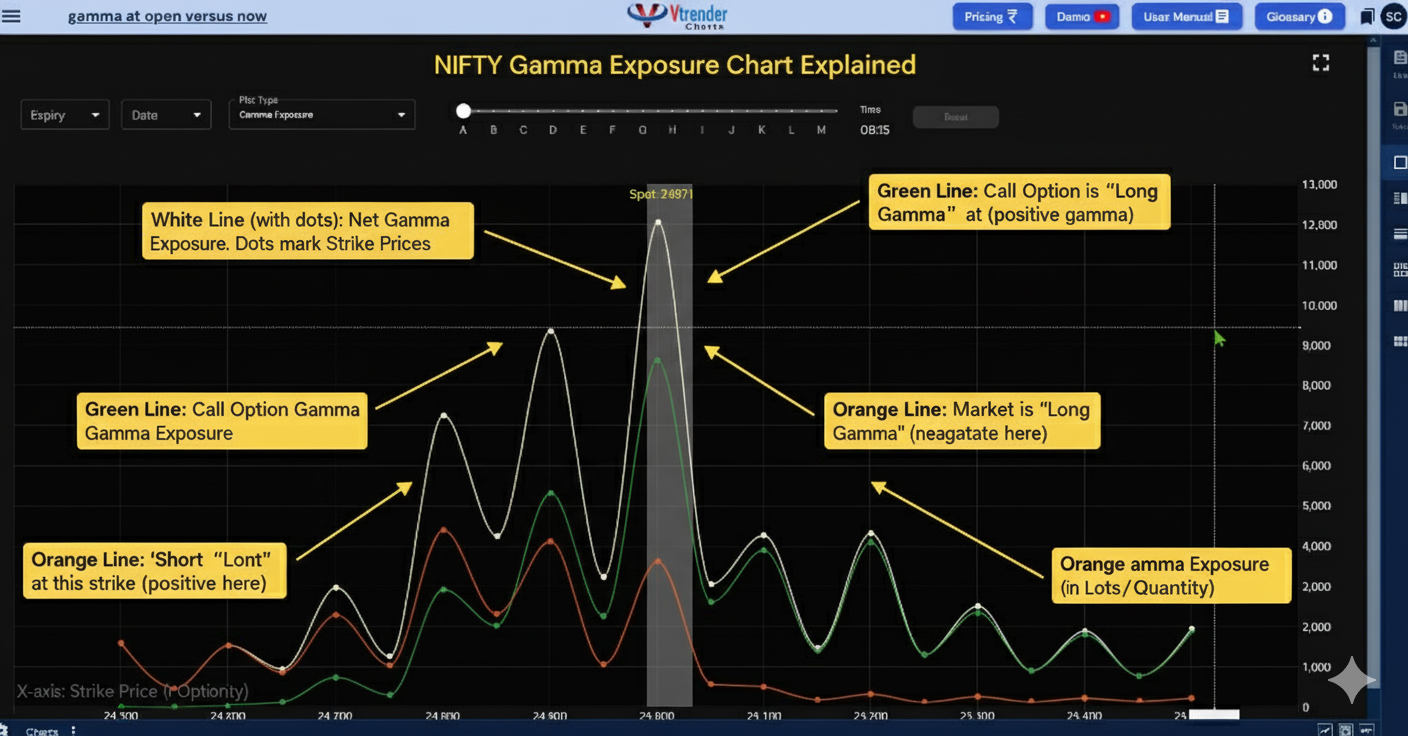
The chart shows us three critical pieces of information: where the market is long gamma, where it's short gamma, and where the massive gamma walls exist. Think of gamma walls like dams in a river. They create resistance to price movement, channeling the market's energy in predictable directions.
In our example, notice the enormous gamma concentration around the current spot price. This grey shaded area represents a massive gamma wall—a level where huge amounts of options positioning creates natural price magnetism. When gamma is concentrated like this, it acts like a powerful magnet, pulling prices back toward this level whenever they try to wander too far away.
The green line shows where the market is long gamma. In these zones, large moves become self-reinforcing. If prices break above a long gamma zone with conviction, they tend to accelerate upward as gamma forces create automatic buying pressure. Similarly, if prices break below with conviction, the selling pressure intensifies.
The orange line reveals short gamma zones—areas where the market becomes increasingly unstable as prices move. These are the danger zones where small moves can become big moves very quickly. Professional traders know to be extra cautious in these areas because normal market dynamics break down.
What makes this even more fascinating is understanding who's positioned where. Our participant-wise data reveals the real story behind these gamma patterns. If the professionals (PROs) are holding massive long call positions—they're the ones creating much of the long gamma in the system. They're positioned for upward moves and have the ammunition to fuel those moves through gamma dynamics.
Meanwhile, the retail clients are predominantly short calls, meaning they're providing the gamma that professionals are buying. This creates a natural tension: when markets move up, professionals make accelerating profits while retail traders face accelerating losses. It's like a poker game where the pros understand the odds while the amateurs are playing with incomplete information.
A look at Open Positions everyday is at - https://charts.vtrender.com/position-table
Understanding gamma exposure transforms how you approach the market. Instead of just looking at price charts and technical patterns, you start seeing the underlying forces that create those patterns. You begin to understand why certain levels hold like concrete walls while others crumble like paper, why some breakouts fail spectacularly while others run much further than anyone expects.
When you see high gamma concentration around a price level, you know that level will be defended by automatic market forces. Prices might test that level multiple times, but they'll keep getting pulled back like a rubber band. This knowledge helps you set better stop losses, identify better entry points, and avoid getting caught in false breakouts.
Conversely, when you identify short gamma zones, you know these are areas of maximum danger and maximum opportunity. If prices enter these zones with momentum, they can move much further and faster than normal technical analysis would suggest. These are the zones where small position sizes are wise, but where the biggest profits often hide.
Think of gamma exposure as your trading GPS. Just as you wouldn't drive through an unfamiliar city without navigation, you shouldn't trade markets without understanding the gamma landscape. It shows you where the traffic jams are likely to occur, where the open highways provide smooth sailing, and where the dangerous curves require extra caution.
The market might seem random and chaotic on the surface, but underneath, powerful forces are constantly at work. Gamma exposure is one of the most important of these forces, creating automatic buying and selling pressures that move prices in ways that fundamental analysis or simple technical analysis cannot explain.
By learning to read gamma exposure charts, you're essentially learning to see the market's central nervous system. You're understanding not just what prices are doing, but why they're doing it and where they're likely to go next. This knowledge doesn't guarantee profits—nothing in trading does—but it gives you a significant edge in understanding market dynamics.
Remember: successful trading isn't about predicting the future with certainty. It's about understanding probabilities, managing risks, and positioning yourself to benefit from the forces that drive markets. Gamma exposure gives you a window into those forces, transforming you from someone who reacts to price movements into someone who understands the machinery that creates those movements in the first place.
The next time you see a sudden, seemingly inexplicable market move, don't just ask what happened—ask where the gamma was positioned. More often than not, you'll find that gamma exposure provides the answer, turning market mystery into market mastery.
Here's the crucial point that separates successful gamma traders from those still struggling with yesterday's data: positions aren't built once and forgotten. They're constantly changing, evolving, and shifting throughout the trading session. Every options trade, every hedge adjustment, every institutional flow changes the gamma landscape in real-time. Yet most traders are still analyzing gamma exposure using Excel spreadsheets and end-of-day historical data—essentially trying to navigate today's traffic using yesterday's road conditions.
Think about it this way: would you drive through Mumbai traffic using a map that's one week old? Of course not.
Traffic patterns change by the minute, new obstacles appear, alternate routes open up. The same principle applies to gamma exposure. What matters isn't where gamma was positioned yesterday at market close—it's where gamma is positioned right now, this very moment, as live trading unfolds.
At Vtrender, we recognized this critical gap in the Indian options market. Through our partnership as registered NSE data distributors, we provide the only live, real-time gamma exposure tracking for NSE derivatives. While others are still crunching yesterday's numbers in Excel, our traders are watching gamma walls build and dissolve in real-time, seeing exactly where the market's pressure points are developing as they happen.
This isn't just a technical advantage—it's a strategic revolution. When you can see gamma positioning change live, you catch institutional moves as they develop, not hours after they've already moved the market. You spot emerging gamma walls before they become impenetrable barriers. You identify when short gamma zones are expanding, signaling potential volatility breakouts before they explode.
The difference between end-of-day gamma analysis and live gamma tracking is the difference between reading about yesterday's weather and having a real-time weather radar. One tells you what happened; the other tells you what's happening and what's likely to happen next.
If you're serious about understanding and trading gamma dynamics in NSE derivatives, experience the power of live, exchange-level data at charts.vtrender.com. Because in options trading, timing isn't just important—it's everything. And timing requires real-time data, not yesterday's history.

Markets don't move because indicators change.
Indicators change because markets move.
A practical reference for NSE & BSE derivatives traders. 366 pages, built to sit open beside live charts.