Love Vtrender Charts? Check out our new offer!
Learn how MFLOW separates new business from old business so traders can read conviction, unwind, short covering and liquidation.
Read More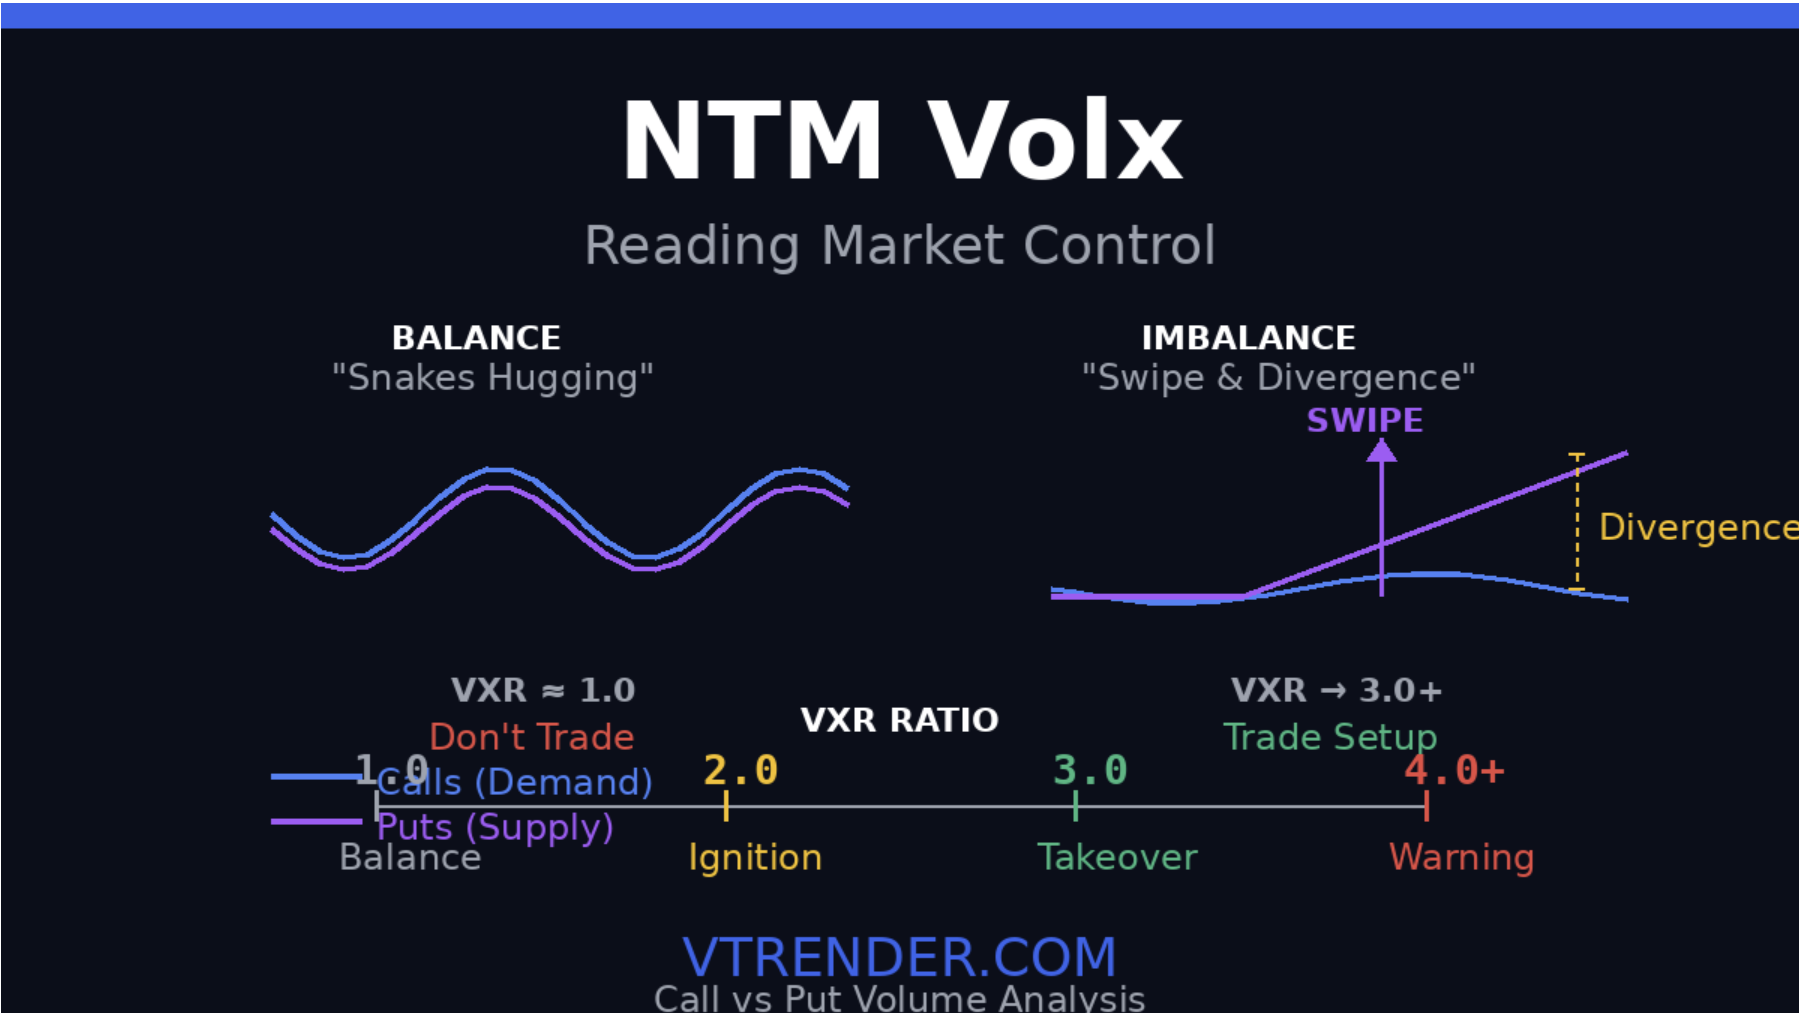
Learn how NTM VolX shows who controls near-the-money options pressure around spot using VXR range, swipes and range behaviour.
Read More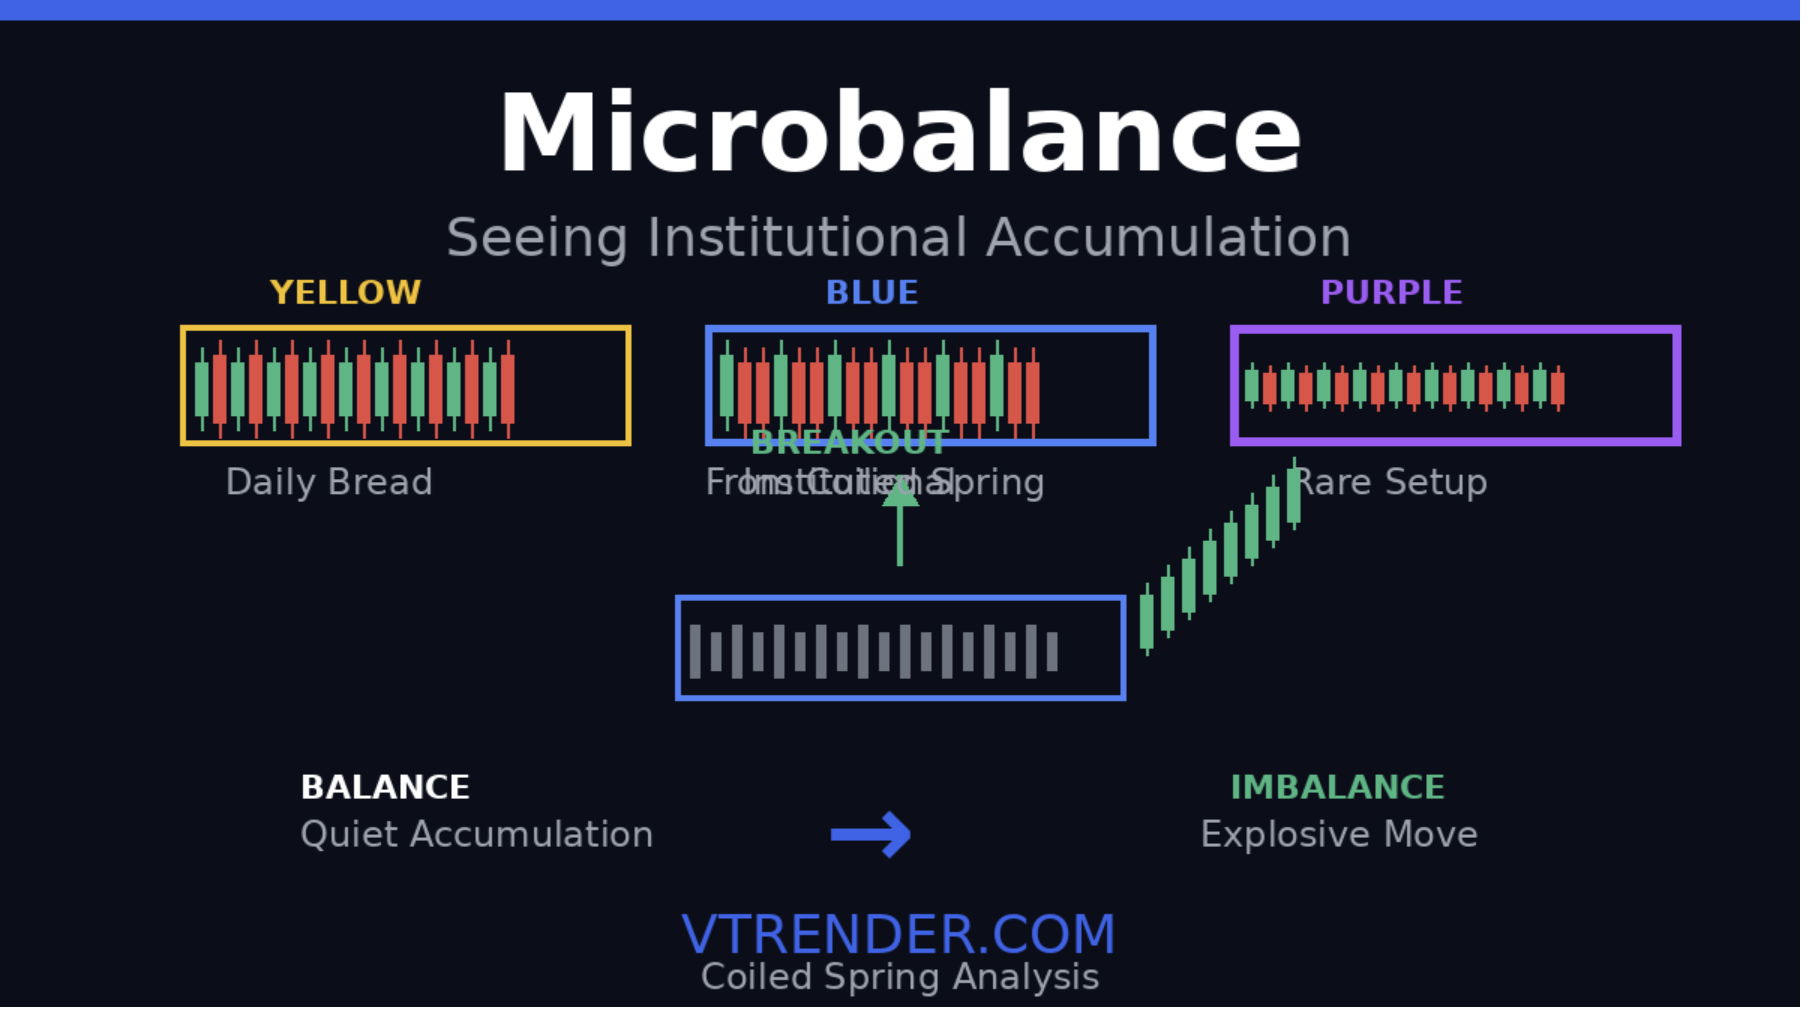
Learn how Micro Balance zones inside Smart Candlesticks can show quiet position building before larger moves develop.
Read More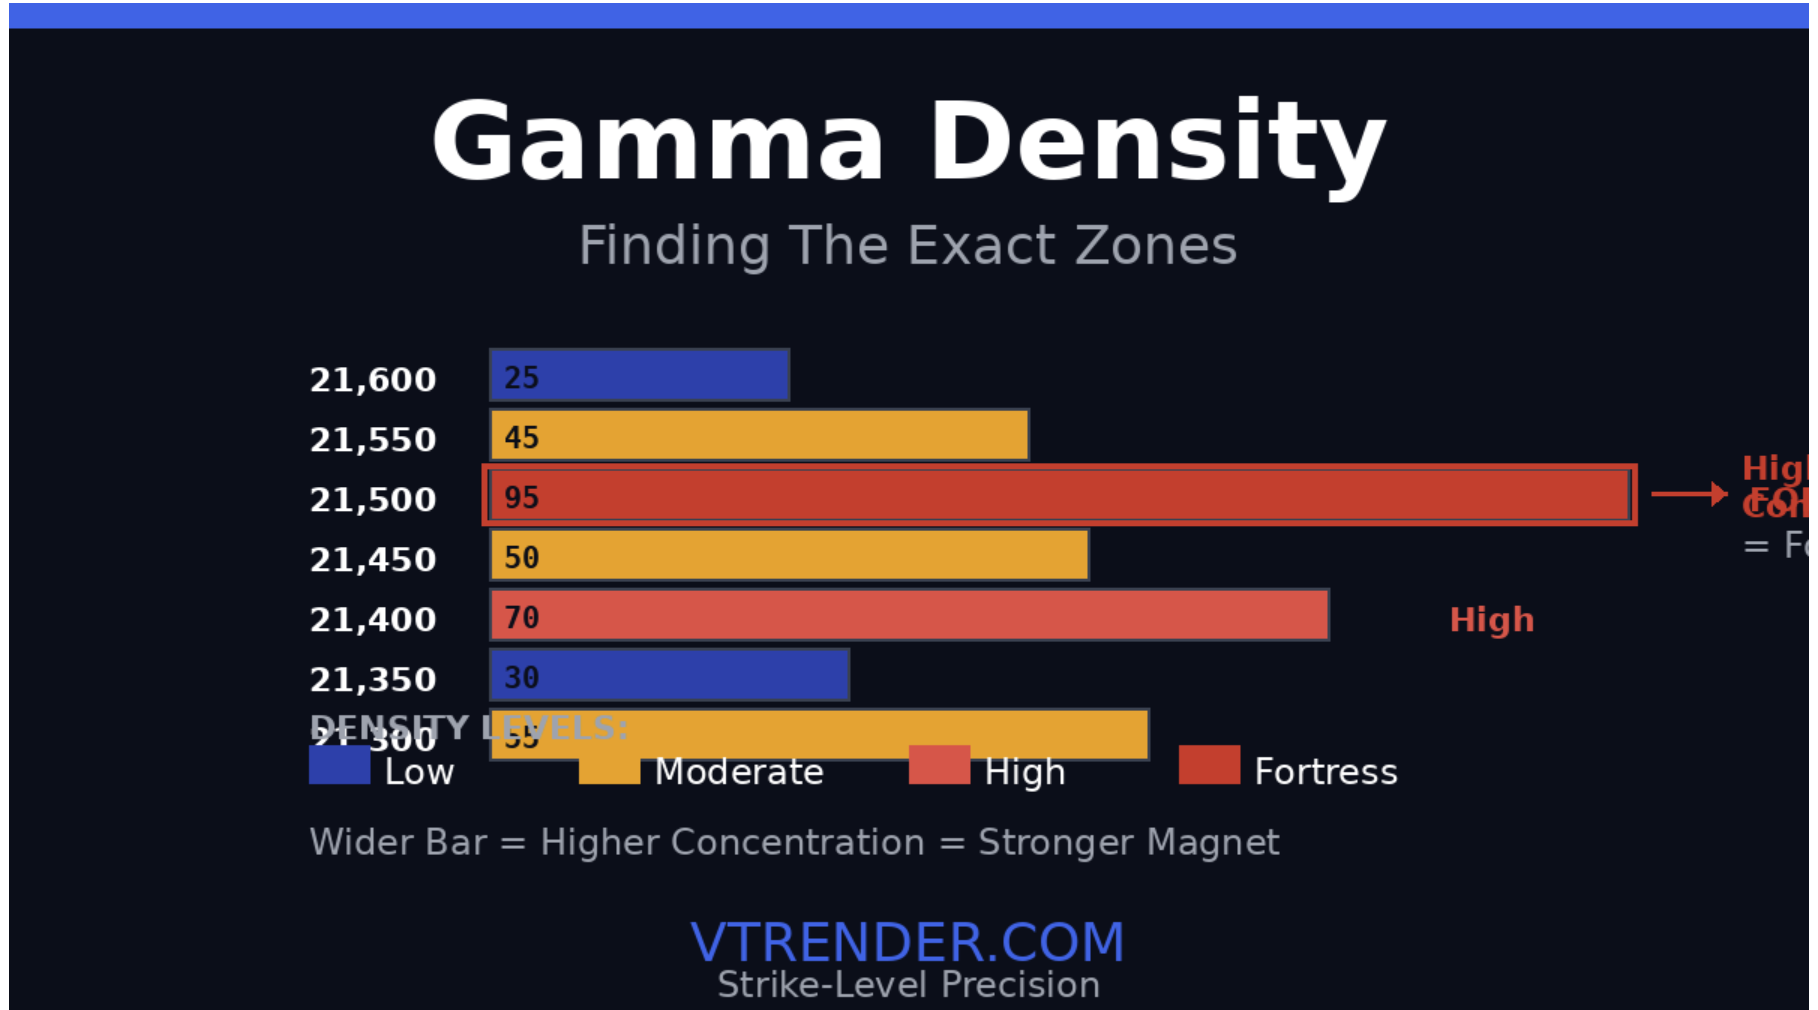
Learn how Gamma Density shows the NIFTY strike zones where options sensitivity is concentrated and price may react.
Read More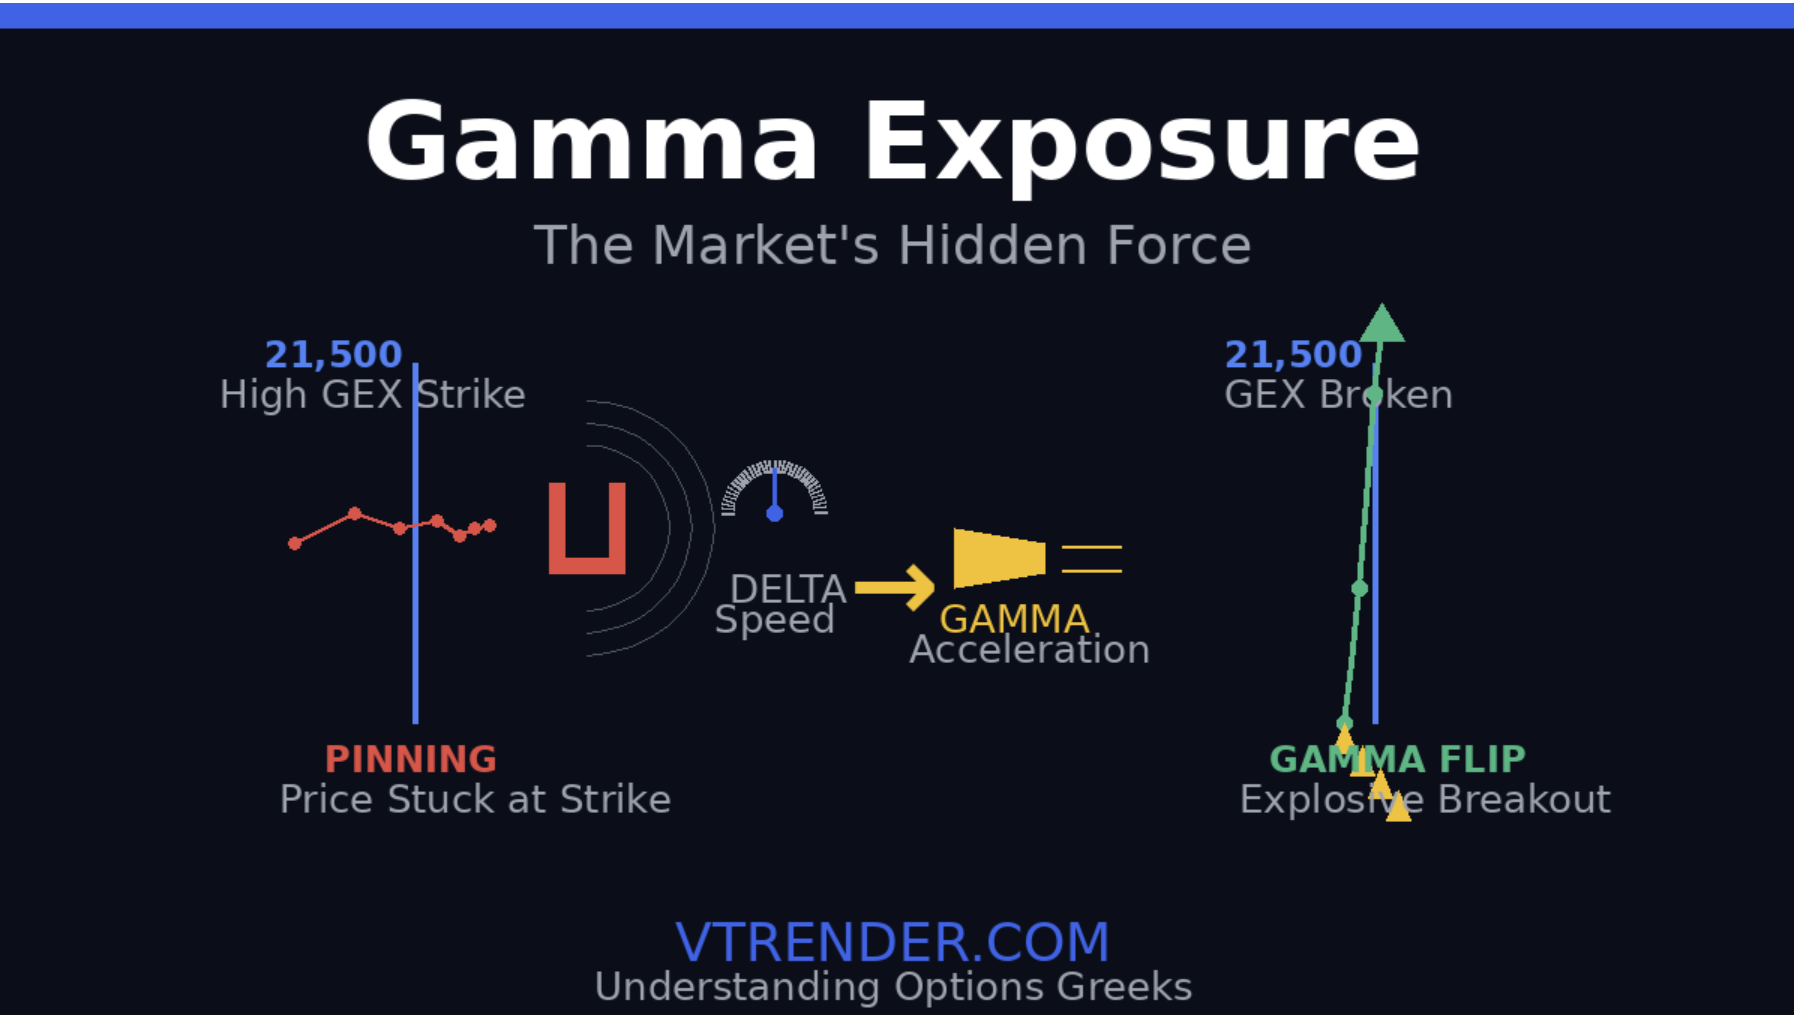
Learn how Gamma Exposure shows long-gamma and short-gamma regimes, pinning zones and acceleration risk in NIFTY options.
Read More
You know what frustrates me most about trading? It's the feeling that everyone else knows something you don't. You're watching Nifty move, and it feels like there's this invisible force pushing it in a direction that makes no sense based on your charts. Then later, after the move is over, you find out that institutions were massively positioned for exactly that move. They knew. You didn't. Here's the thing: that information wasn't actually hidden. It was right there in the options market, visible to anyone who knew where to look. The institutions weren't trading with secret knowledge - they were trading with better data visualization.
Read More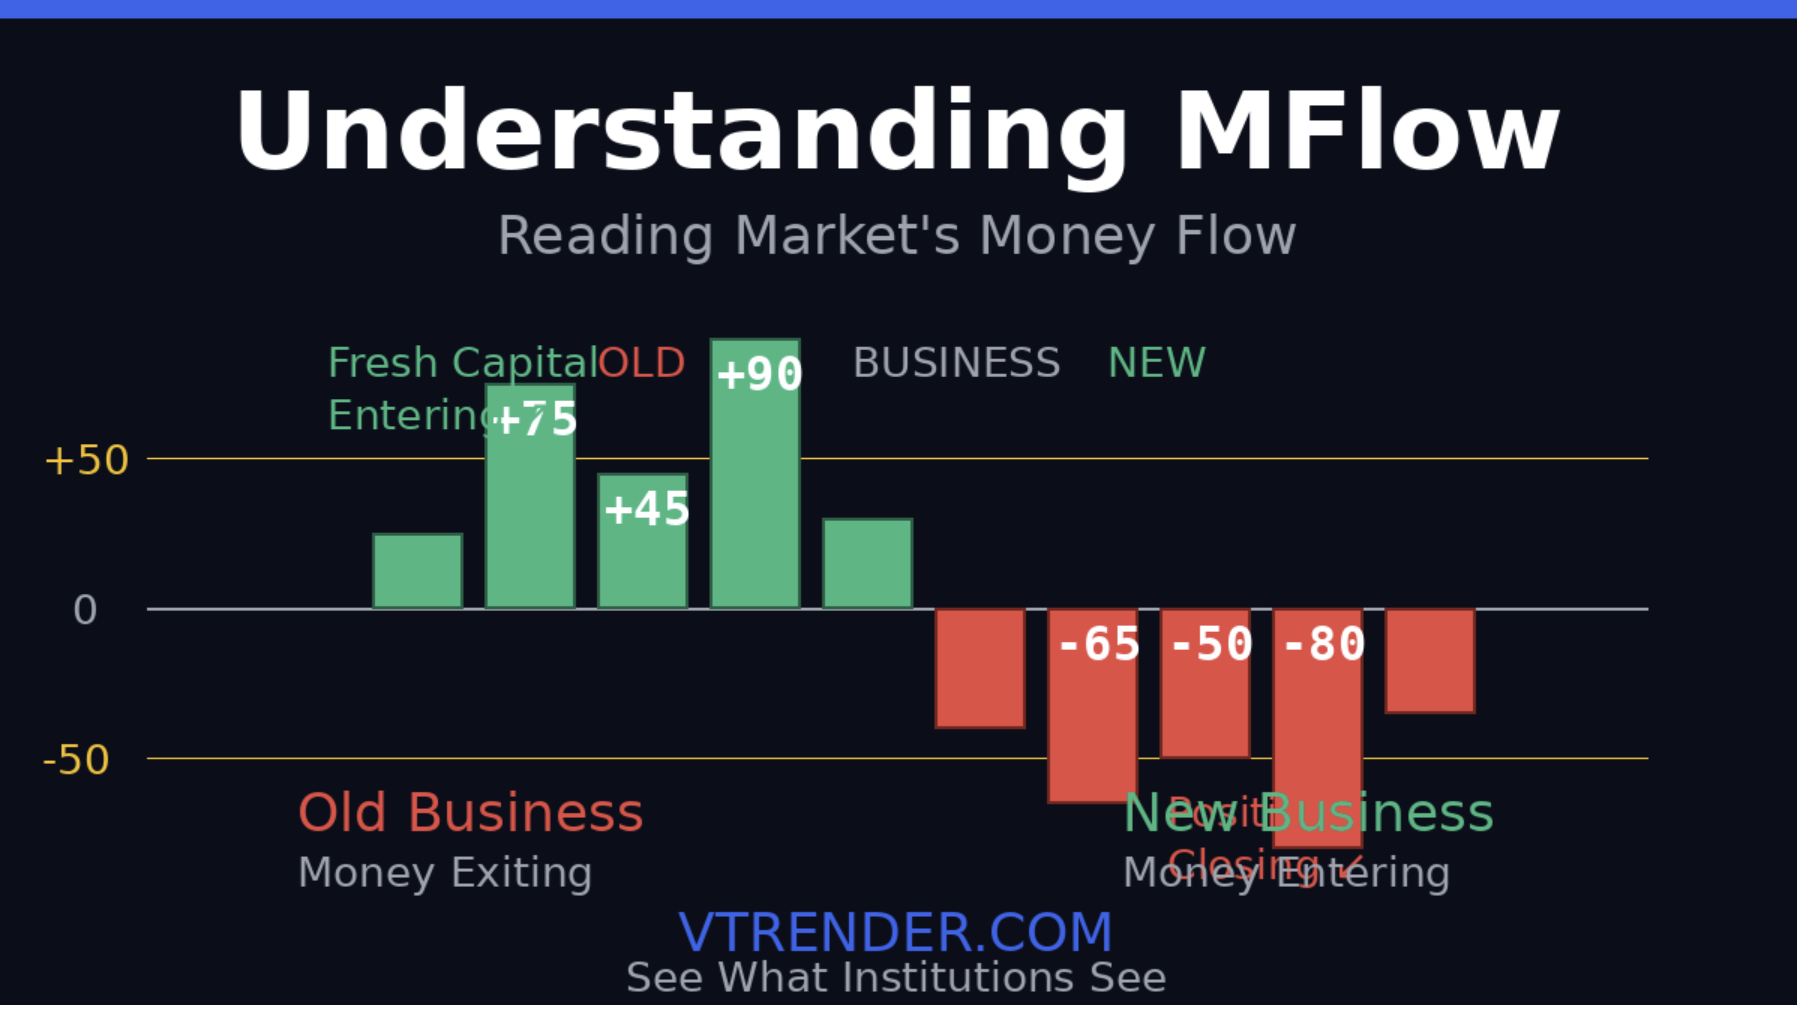
Learn how MFLOW helps traders read new business, old business, unwind, short covering and conviction behind price movement.
Read More
You know that feeling when you watch a big green candle shoot up on your Nifty chart and you think "I wish I'd seen that coming"? Here's the thing: someone did see it coming. Multiple someones, actually. They saw it building, they positioned themselves ahead of it, and they profited while you were left wondering what just happened. I'm not talking about some mystical market wizards with crystal balls. I'm talking about traders who simply have better information than you do. Not insider information - that's illegal. I'm talking about information that's available to everyone but that most traders simply don't know how to read.
Read More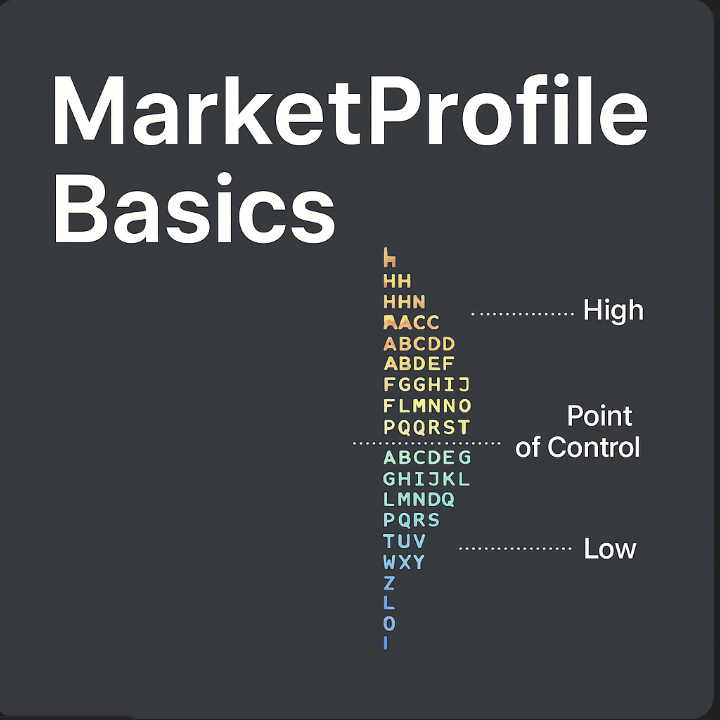
Learn Market Profile basics for NIFTY: TPO, Value Area, POC, Initial Balance, acceptance and rejection on Vtrender Charts.
Read More