Love Vtrender Charts? Check out our new offer!
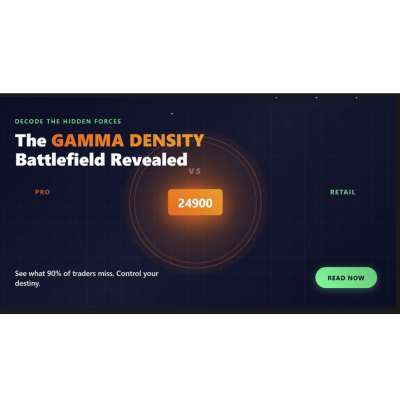
The options market isn't about buying and selling. It's about control, concentration, and the invisible forces that pin prices exactly where the big players want them. Today, you'll learn to see what 90% of traders miss.
Read More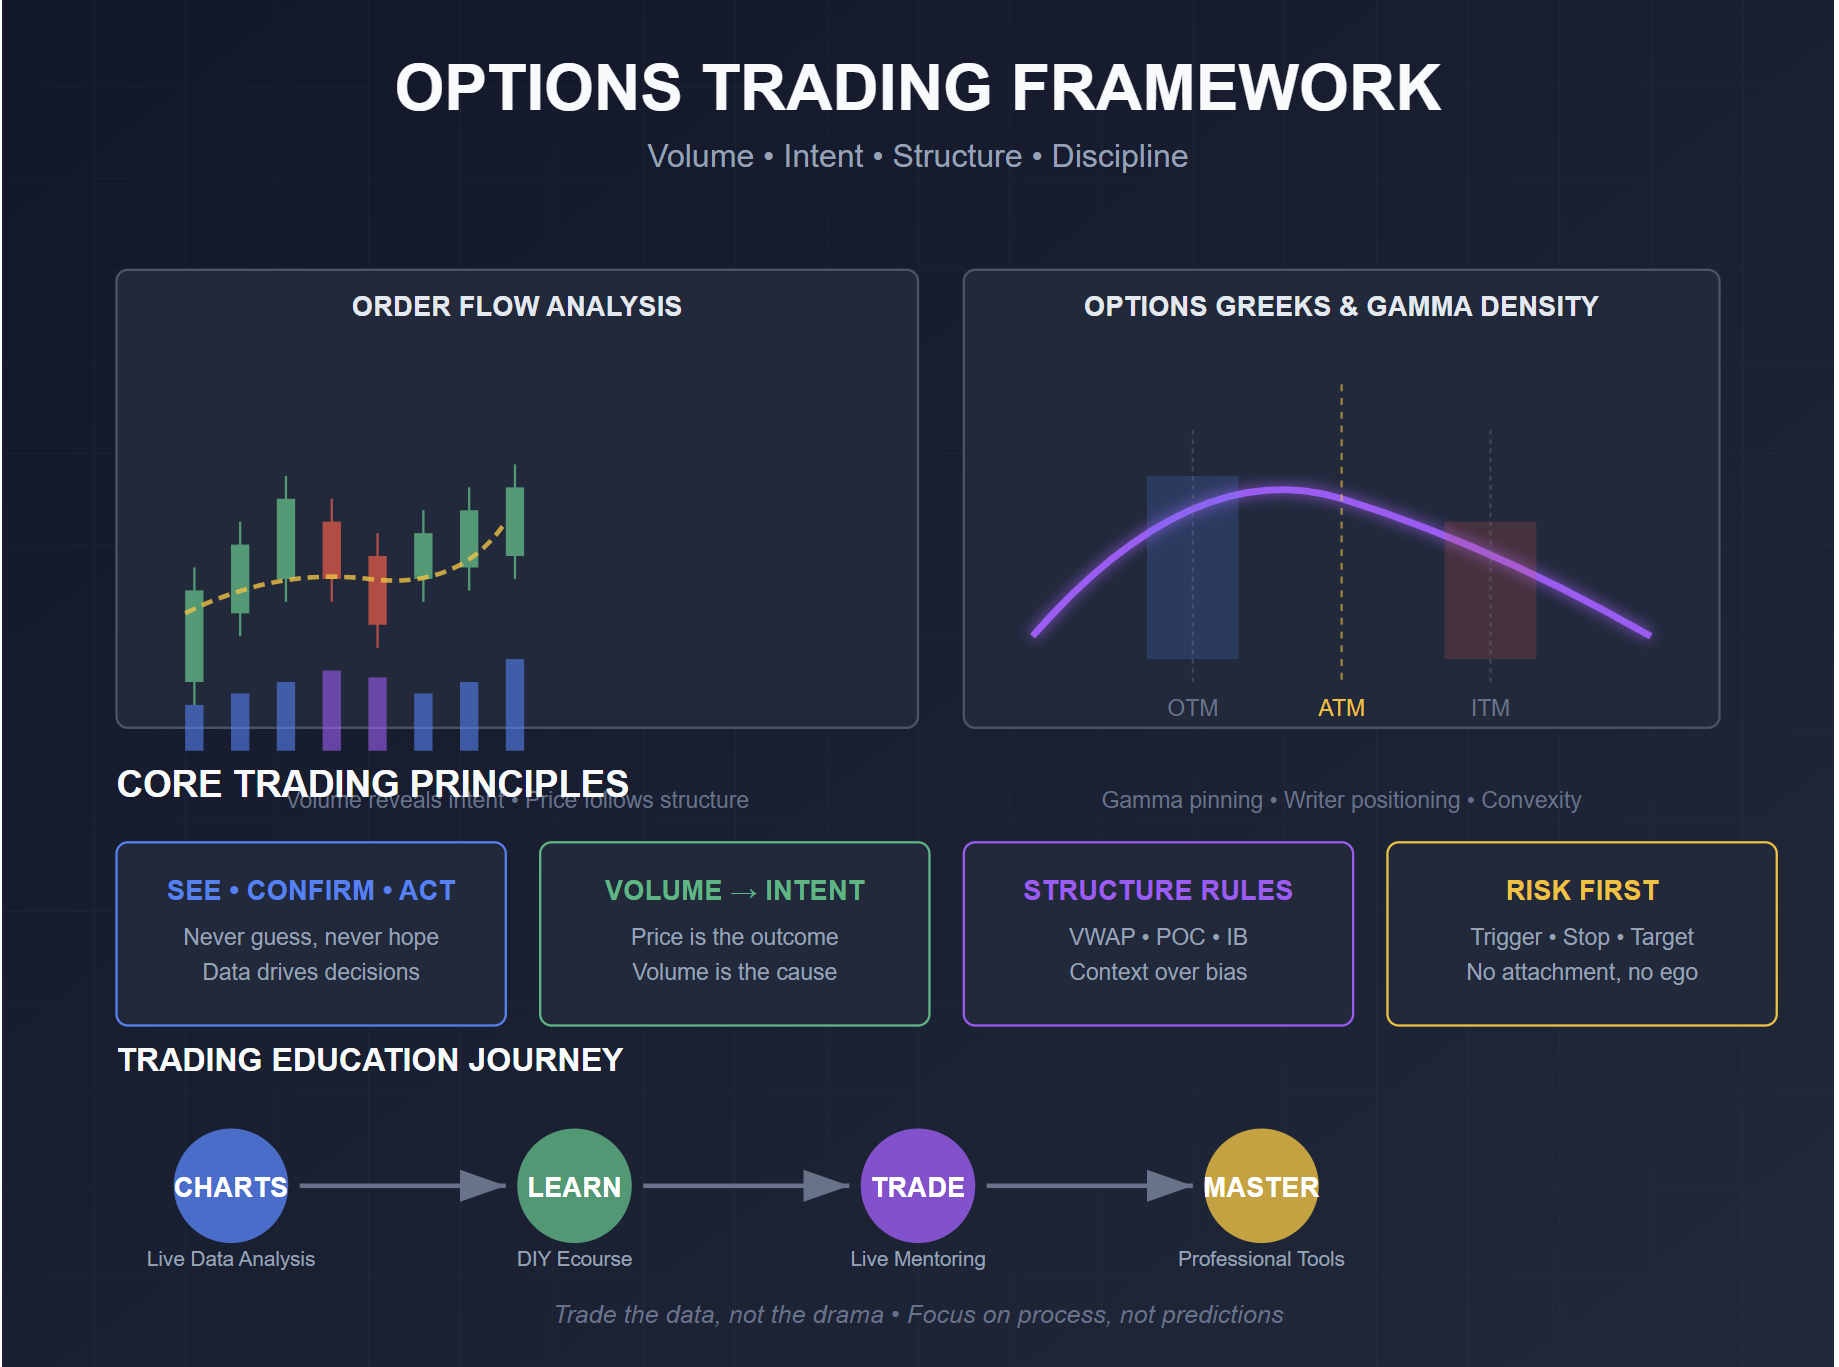
This isn't just education - it's live trading intelligence. Your members didn't just learn about options flow; they traded it profitably in real-time.
Read More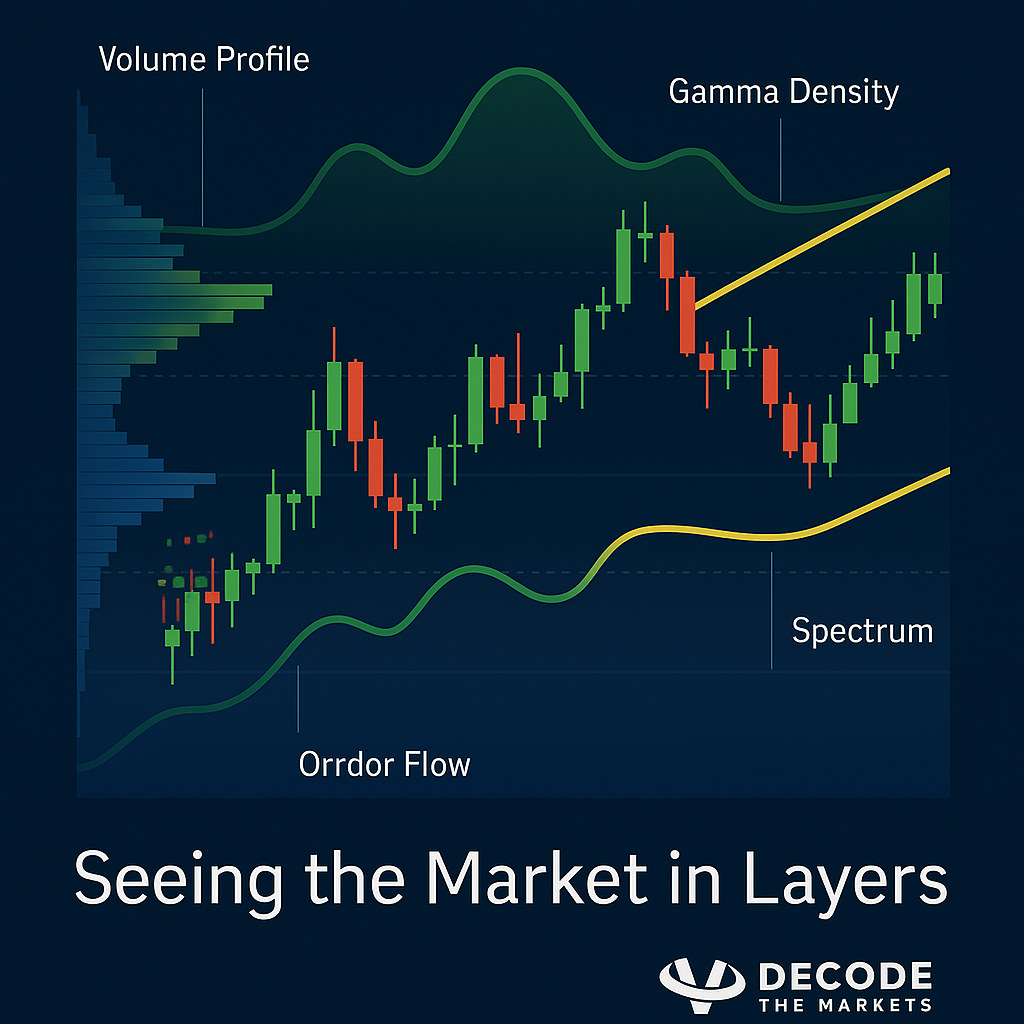
To trade with intent, you need to see the market in layers — structure, flows, footprints, and positioning. That’s where Market Profile, Orderflow, and Options analytics work together, giving us a playbook that repeats every series and every settlement cycle. This post takes lessons from our recent webinar and distills them into timeless principles — tools you can use in any expiry week to move beyond candles and into clarity.
Read More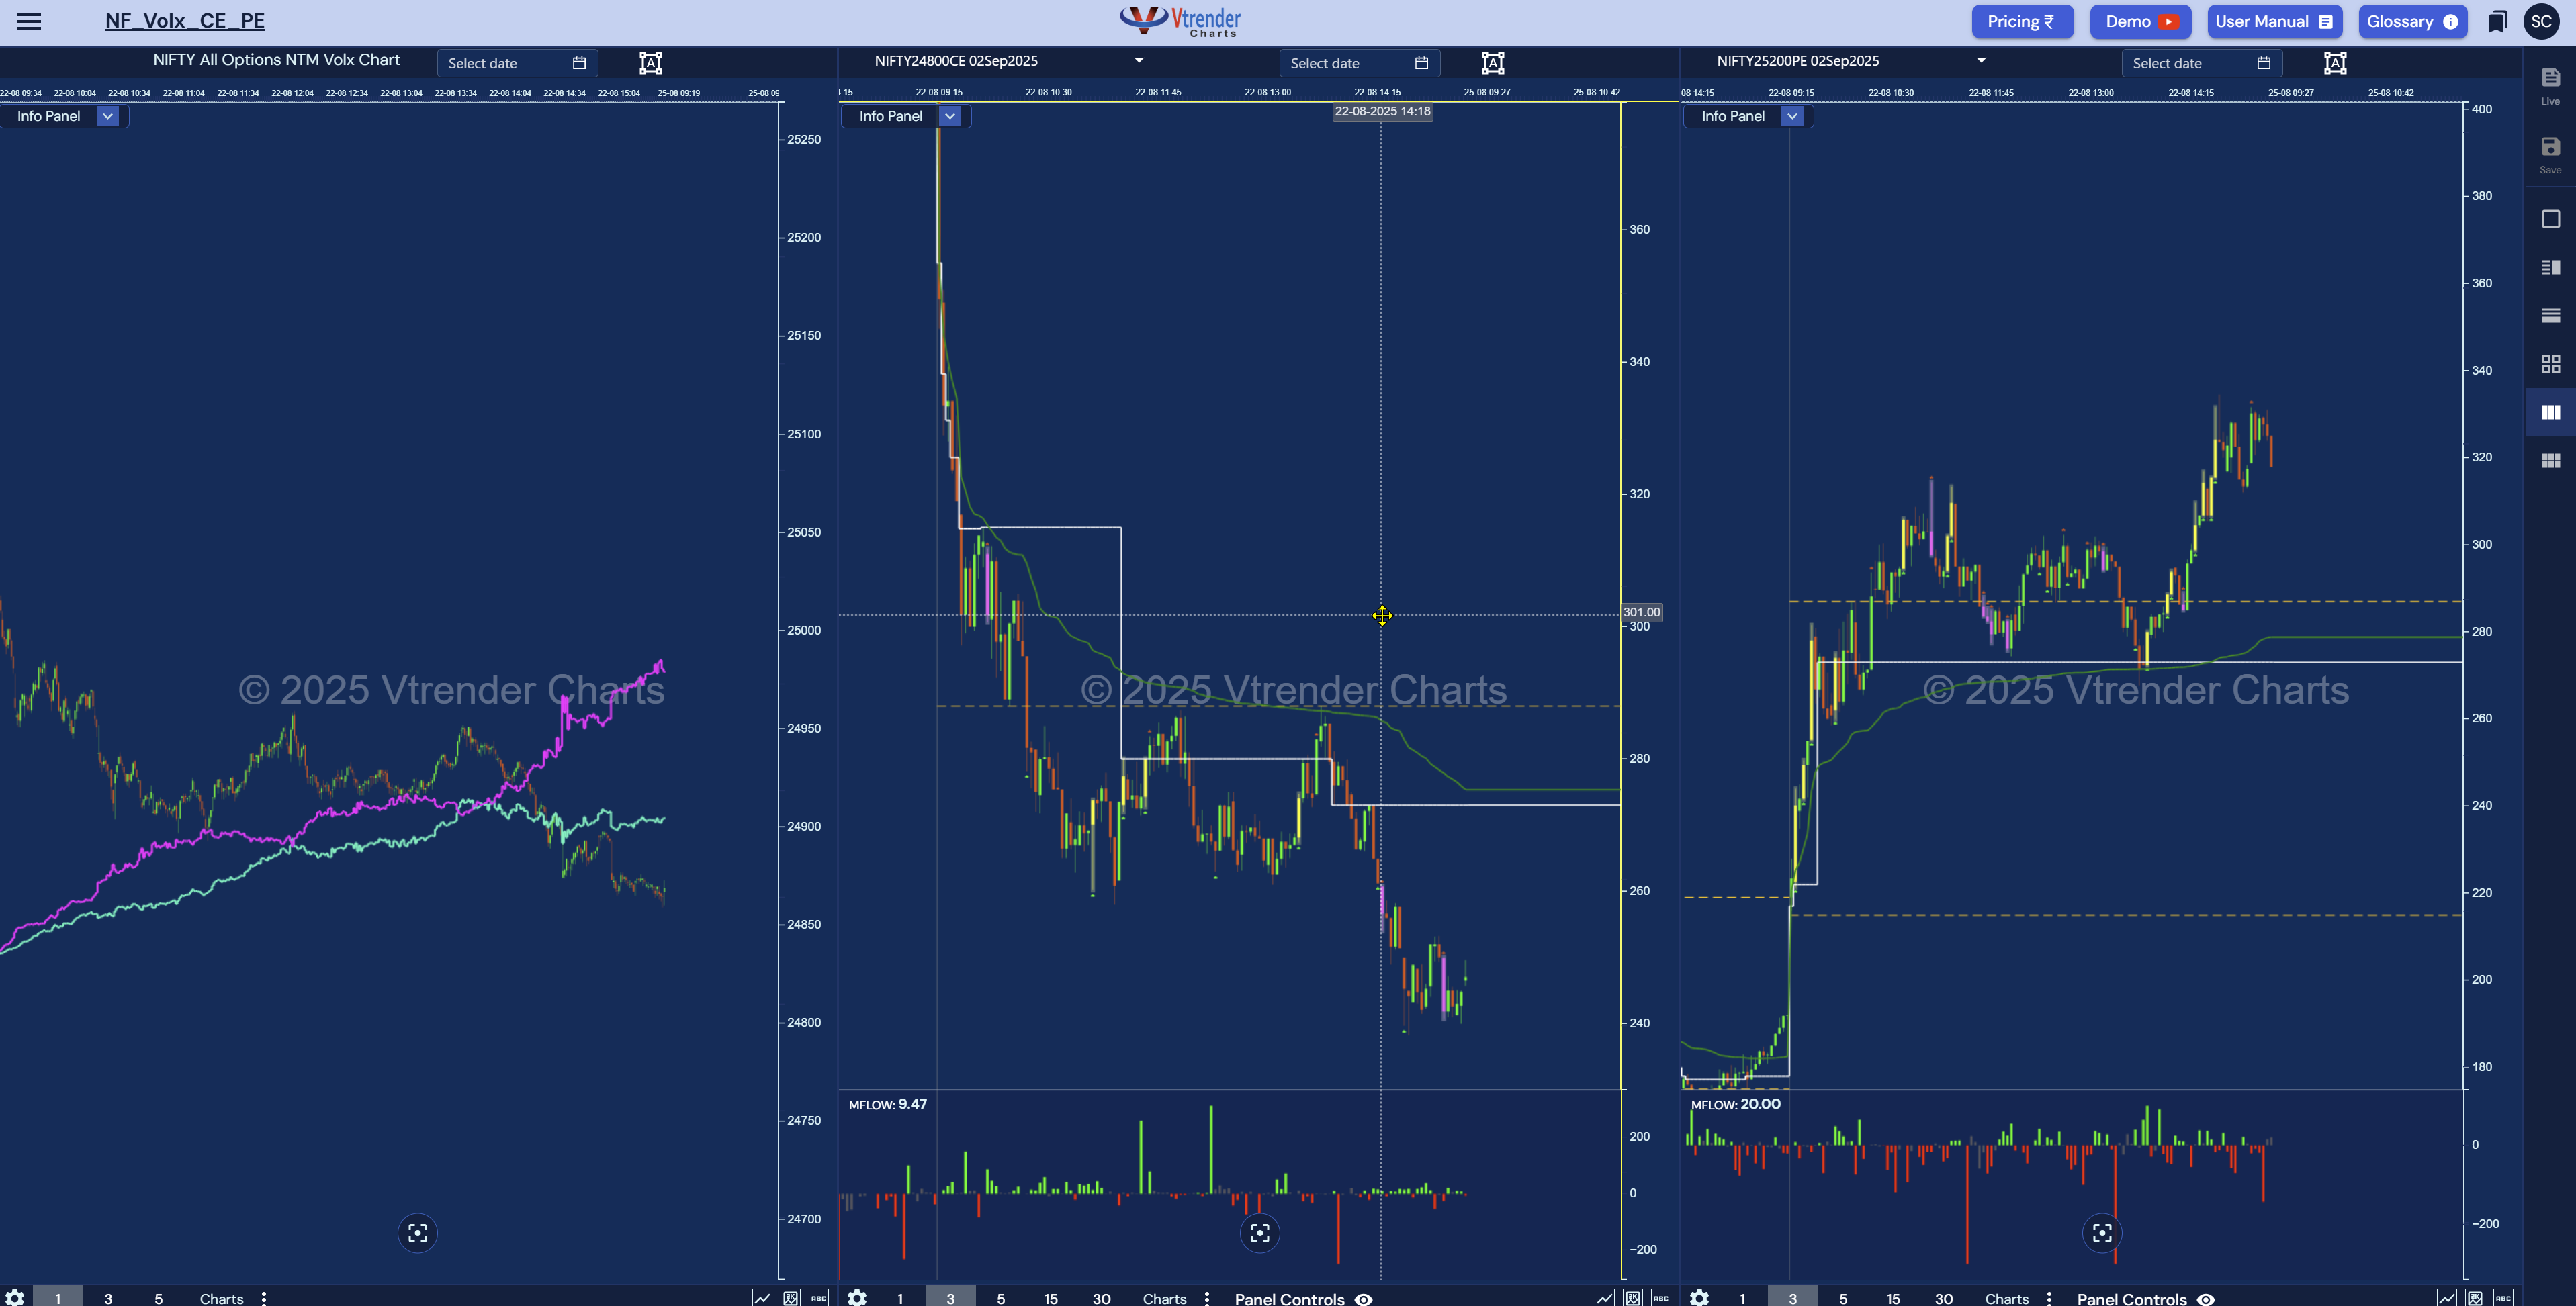
At Vtrender, we’ve built the Multi-Window mode into our charts because today’s derivatives markets demand a cockpit, not a rear-view mirror. You need to see context, intent, and execution — together.
Read More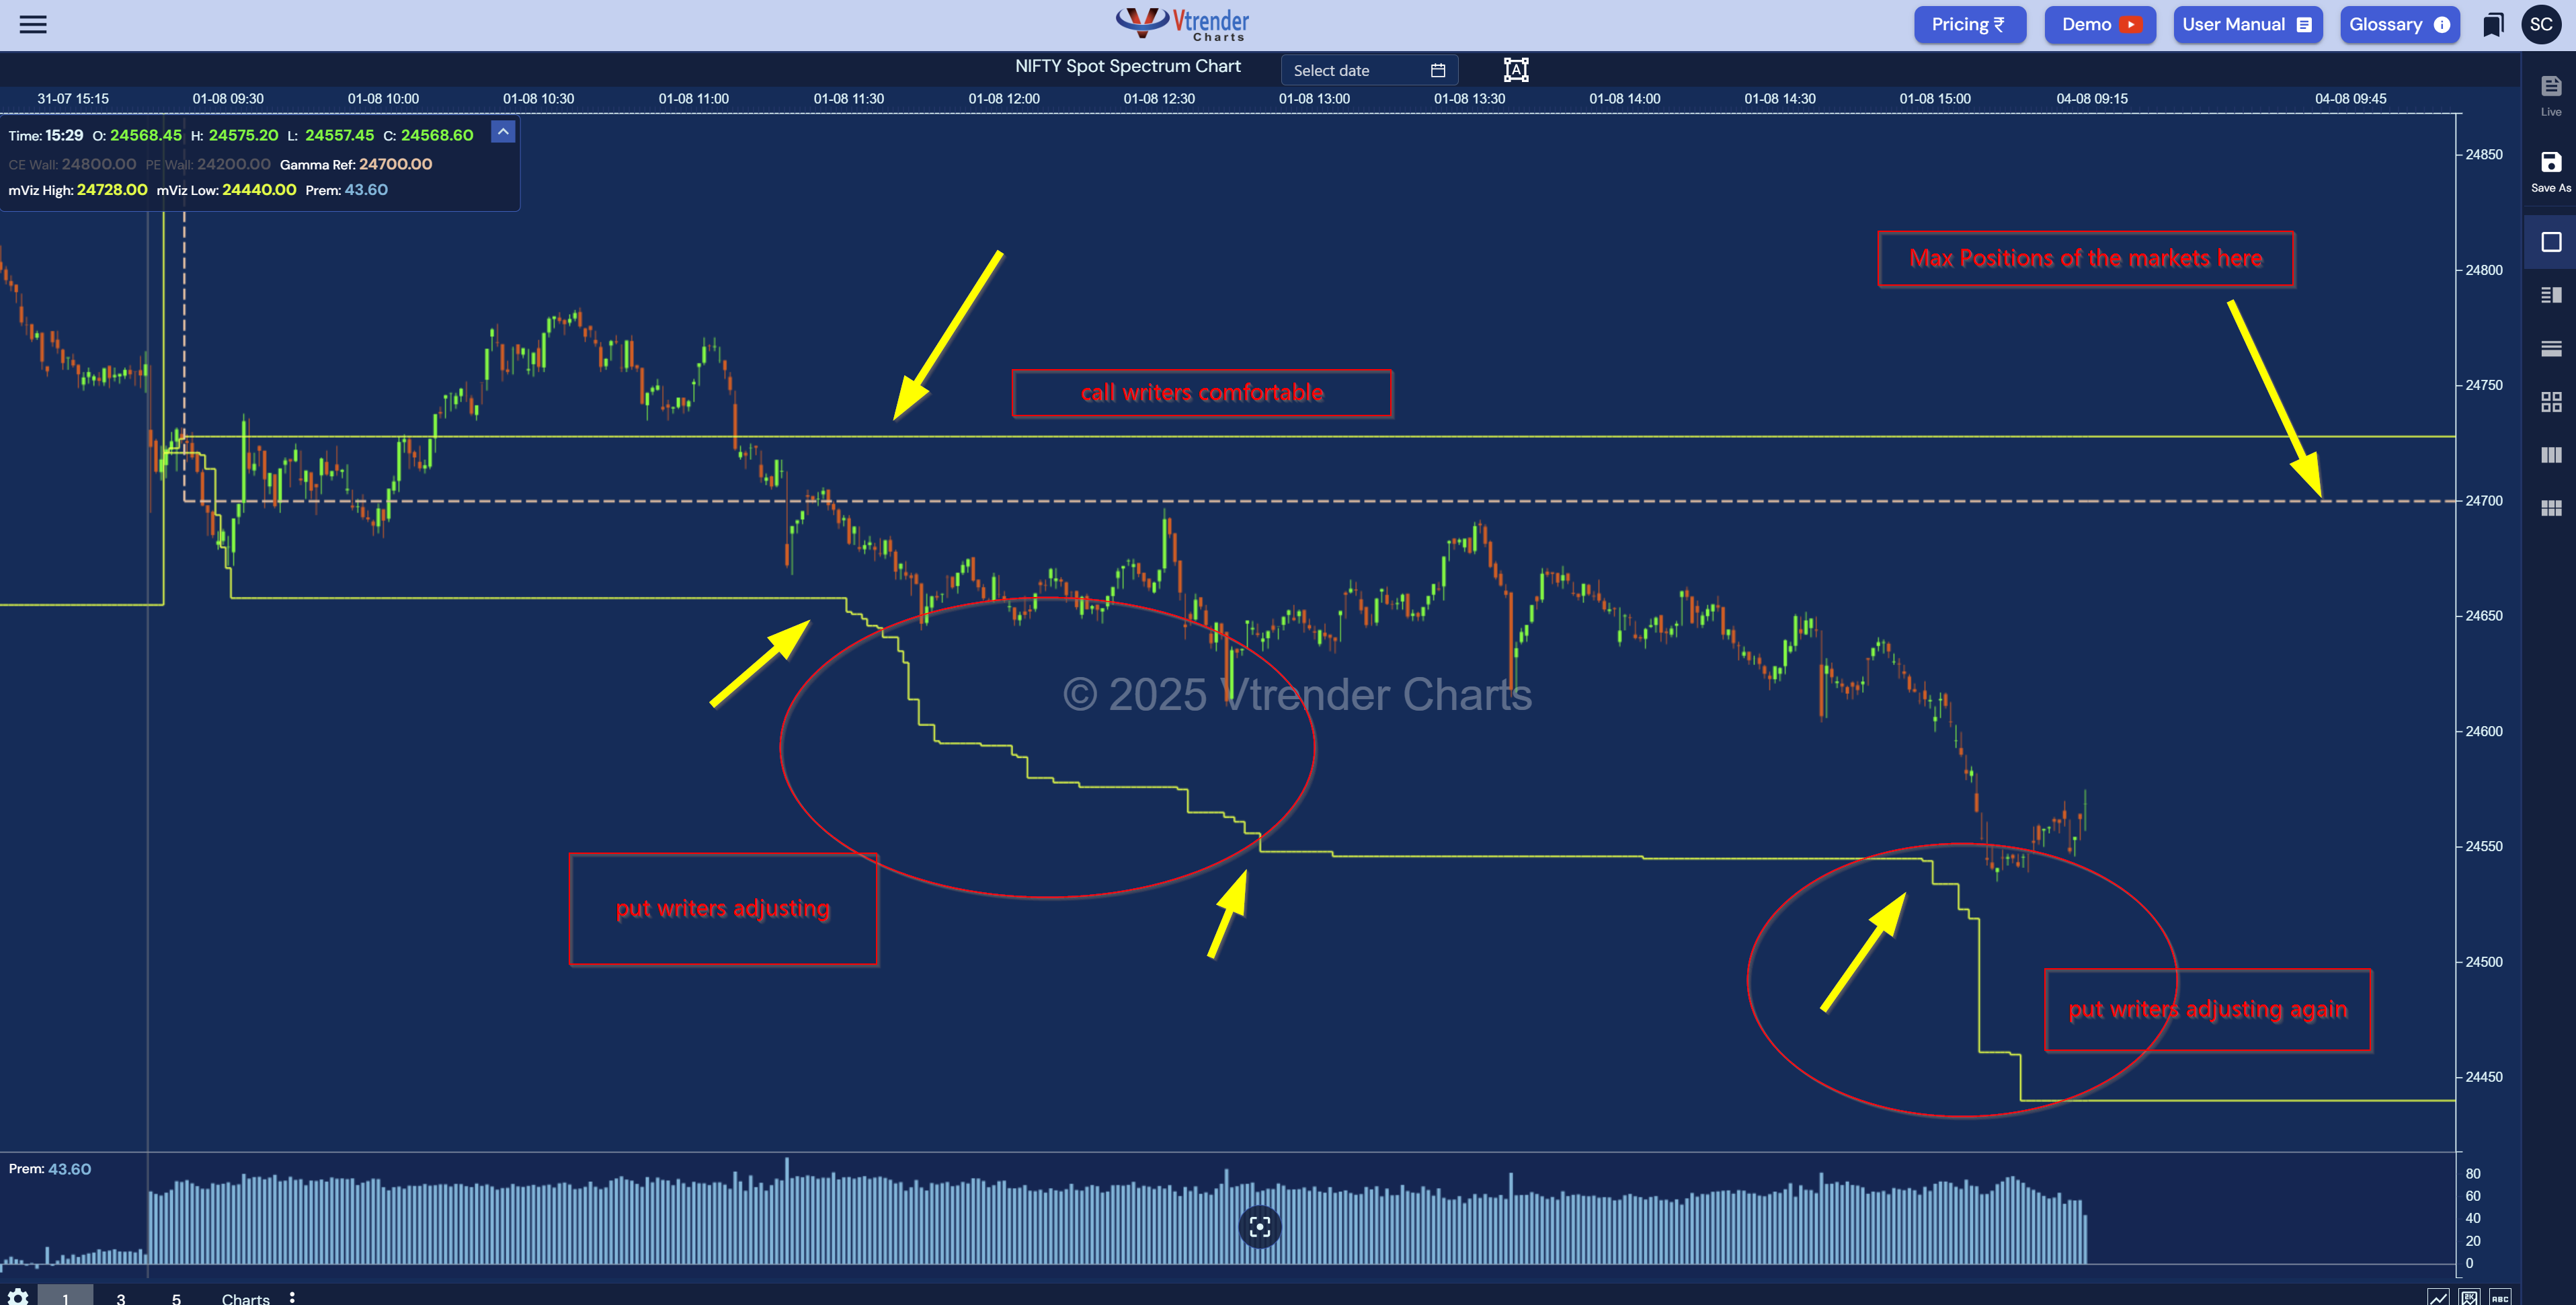
We call it the Spectrum Chart — and it’s where the “silent crowd” of option writers start to speak. This chart doesn’t track price. It doesn’t chase volume. It tracks intention. Specifically — the intentions of those writing options, the ones shaping range, volatility, and direction by their willingness to hold or adjust positions.
Read More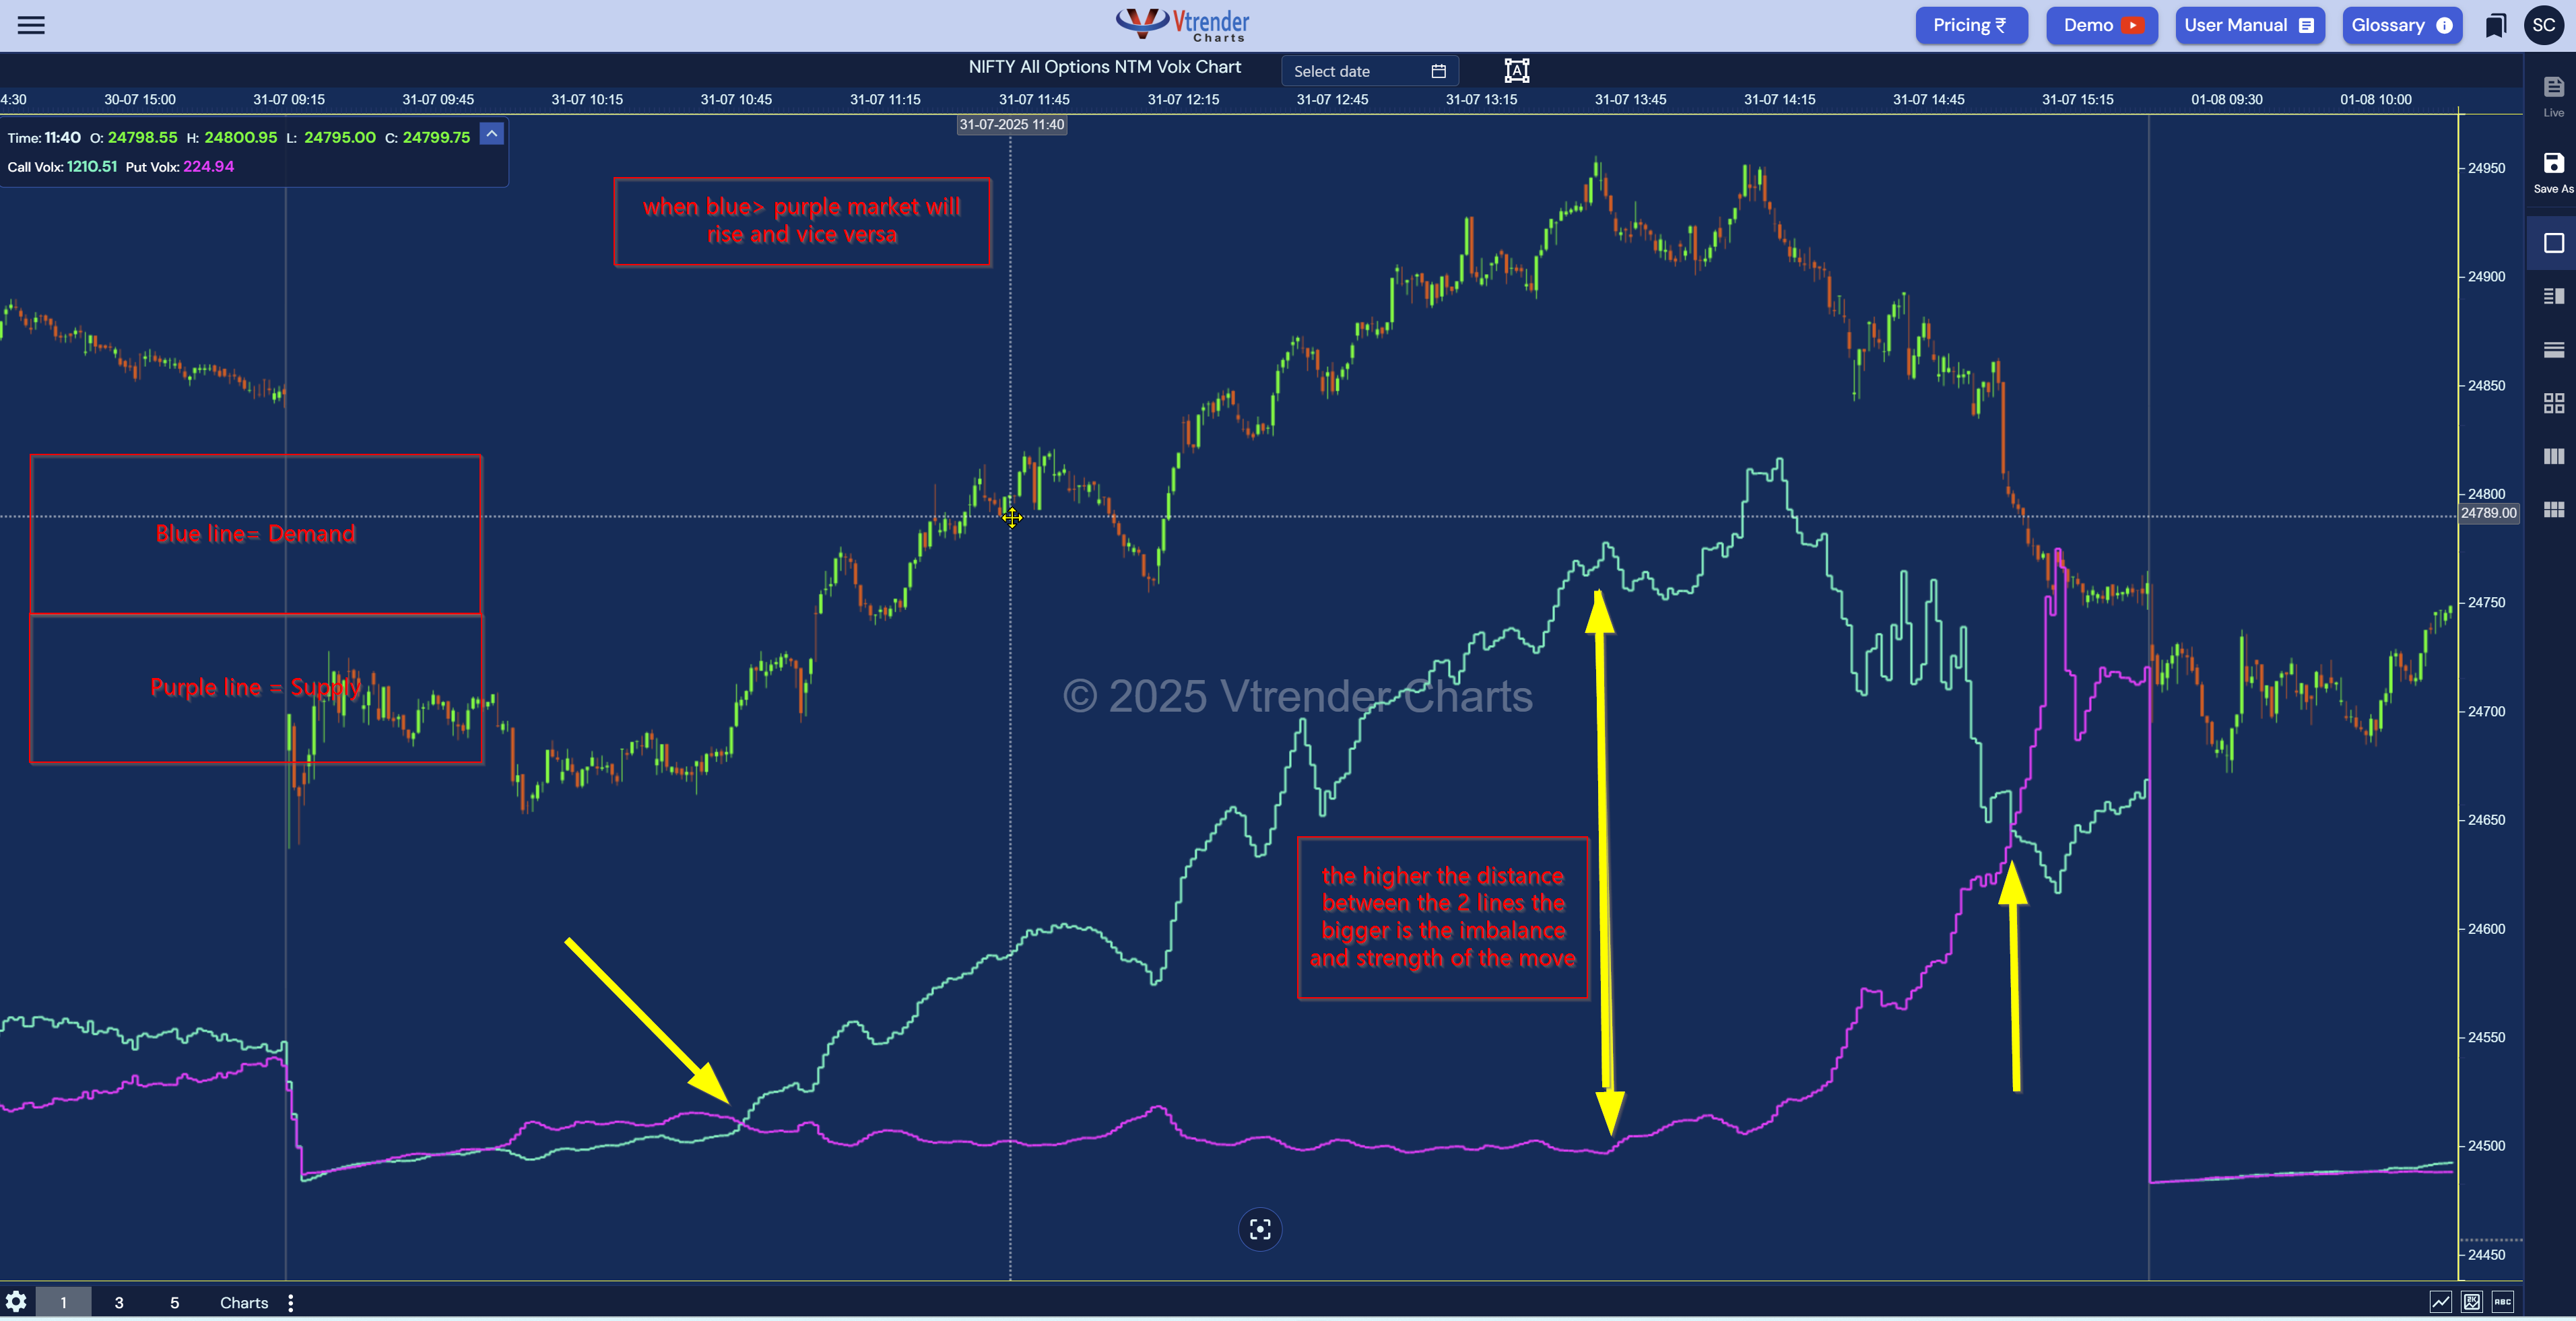
At Vtrender, we’ve built a simple but powerful chart that reveals the real-time battle between Demand and Supply. No filters. No lag. No guesswork. We call it the NTM VolX Chart.
Read More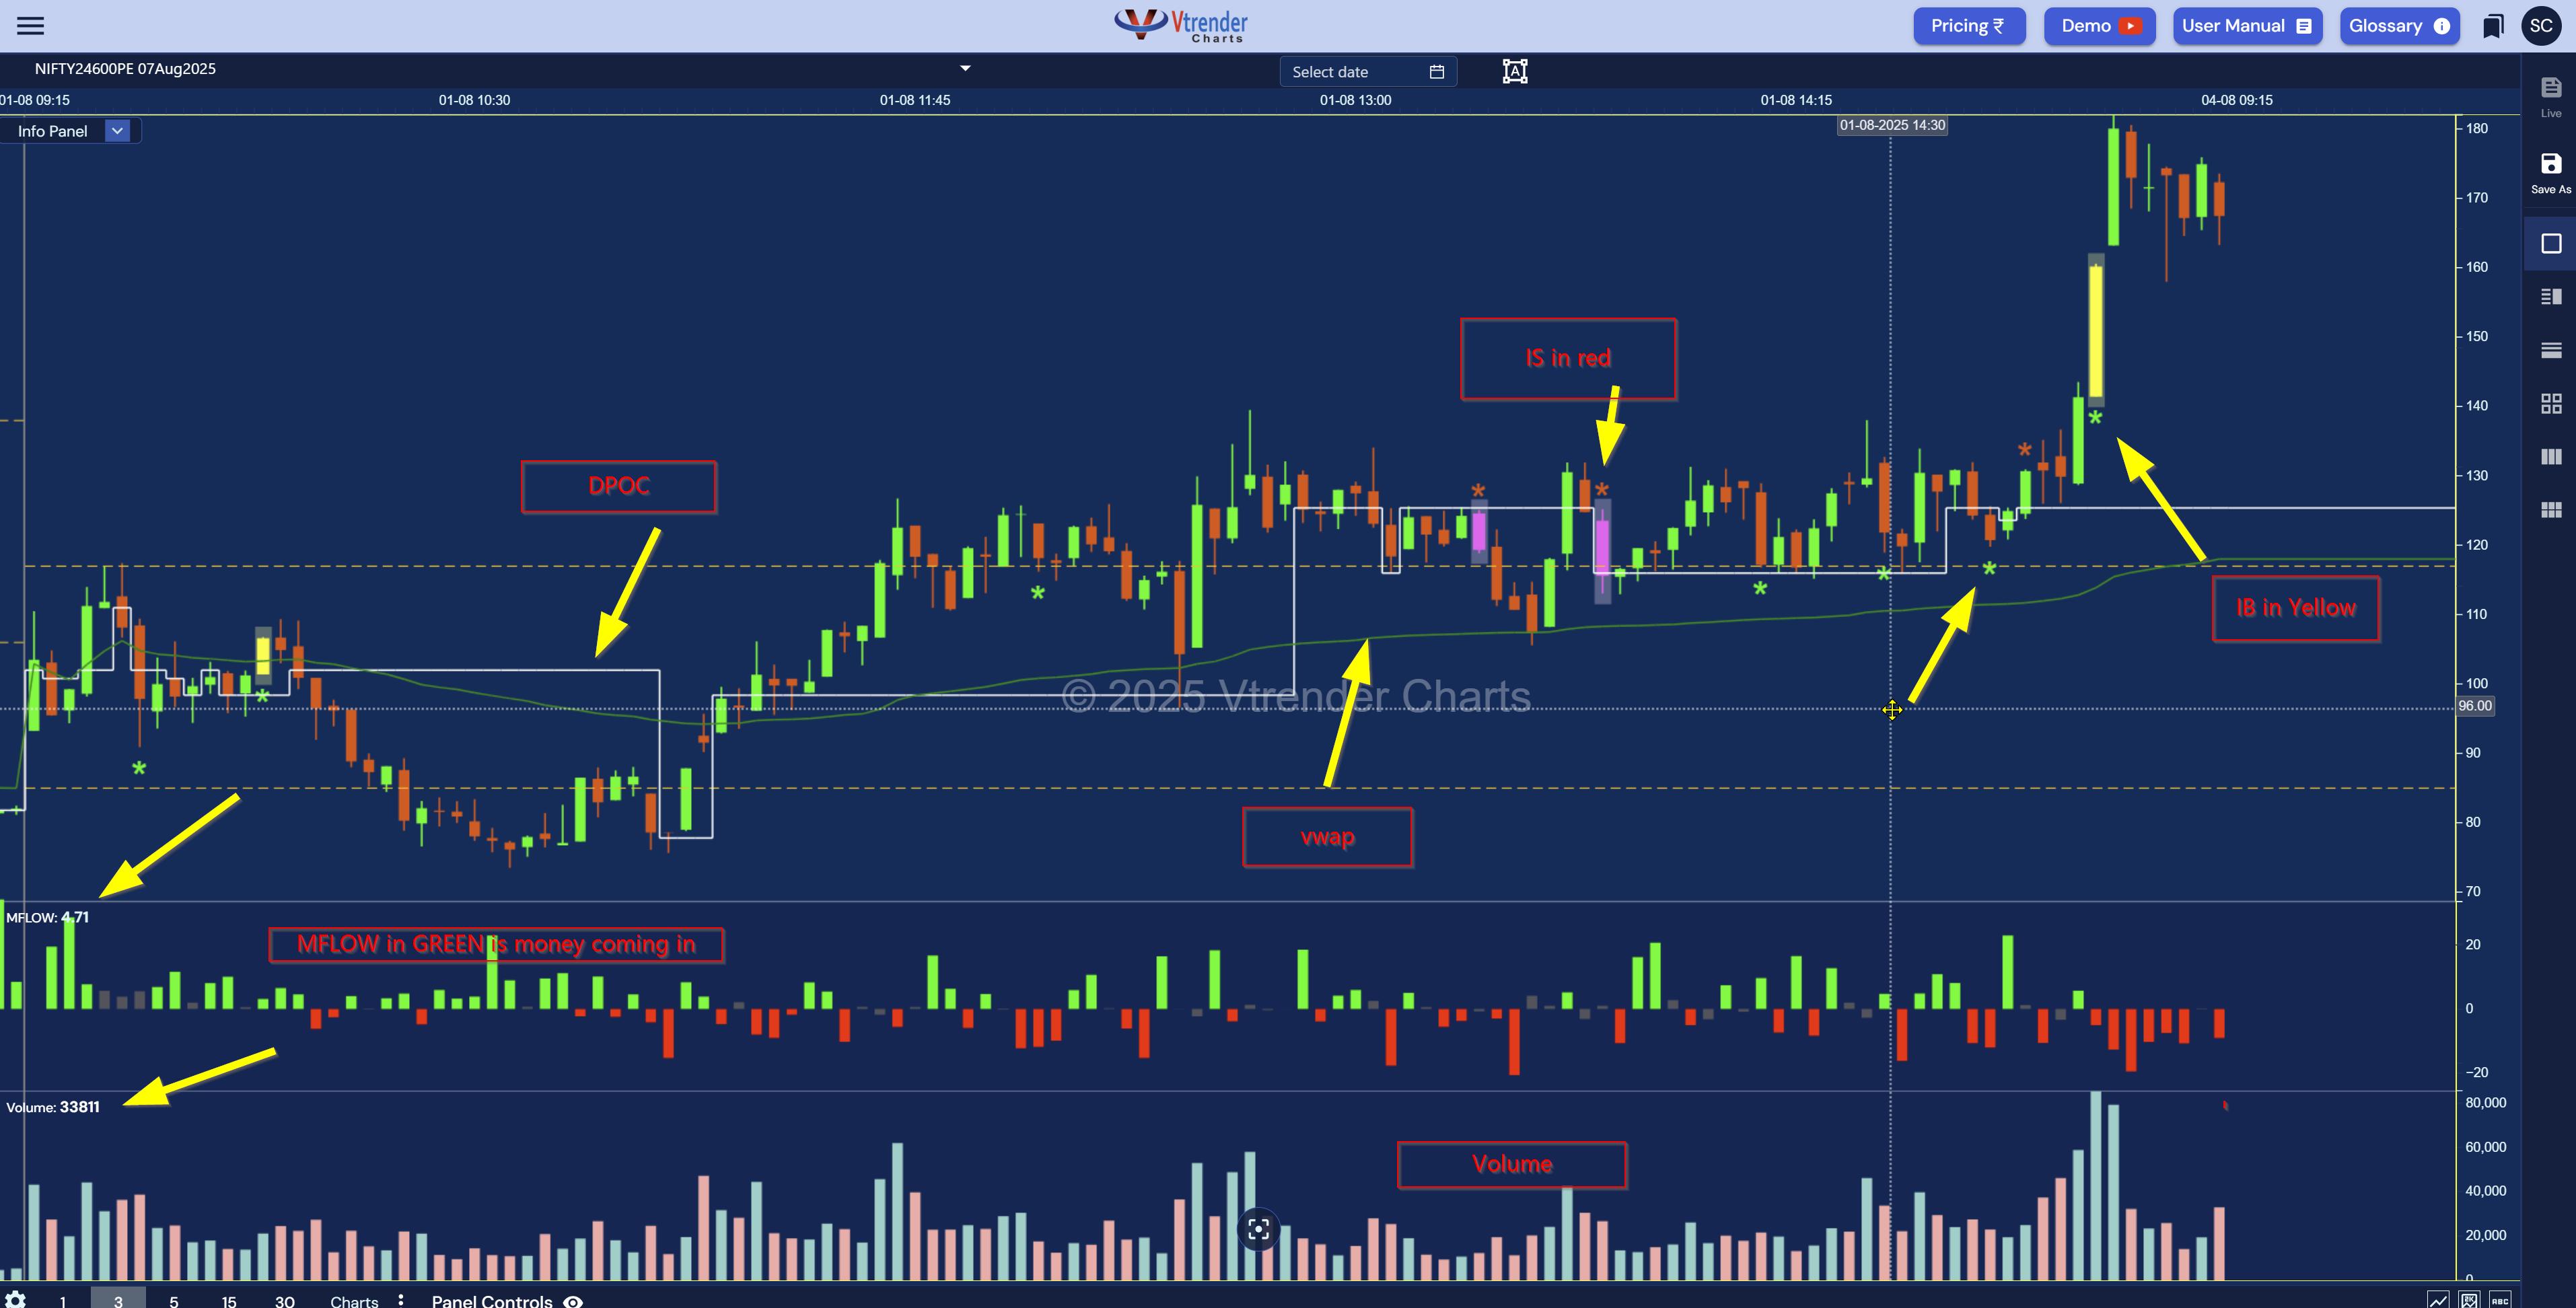
At Vtrender, we’ve built a candlestick view specifically for Option traders—one that helps you visually catch the pulse of initiative buying and selling. And right at the center of that view is a concept we call MFLOW. Let’s walk you through it, layer by layer.
Read More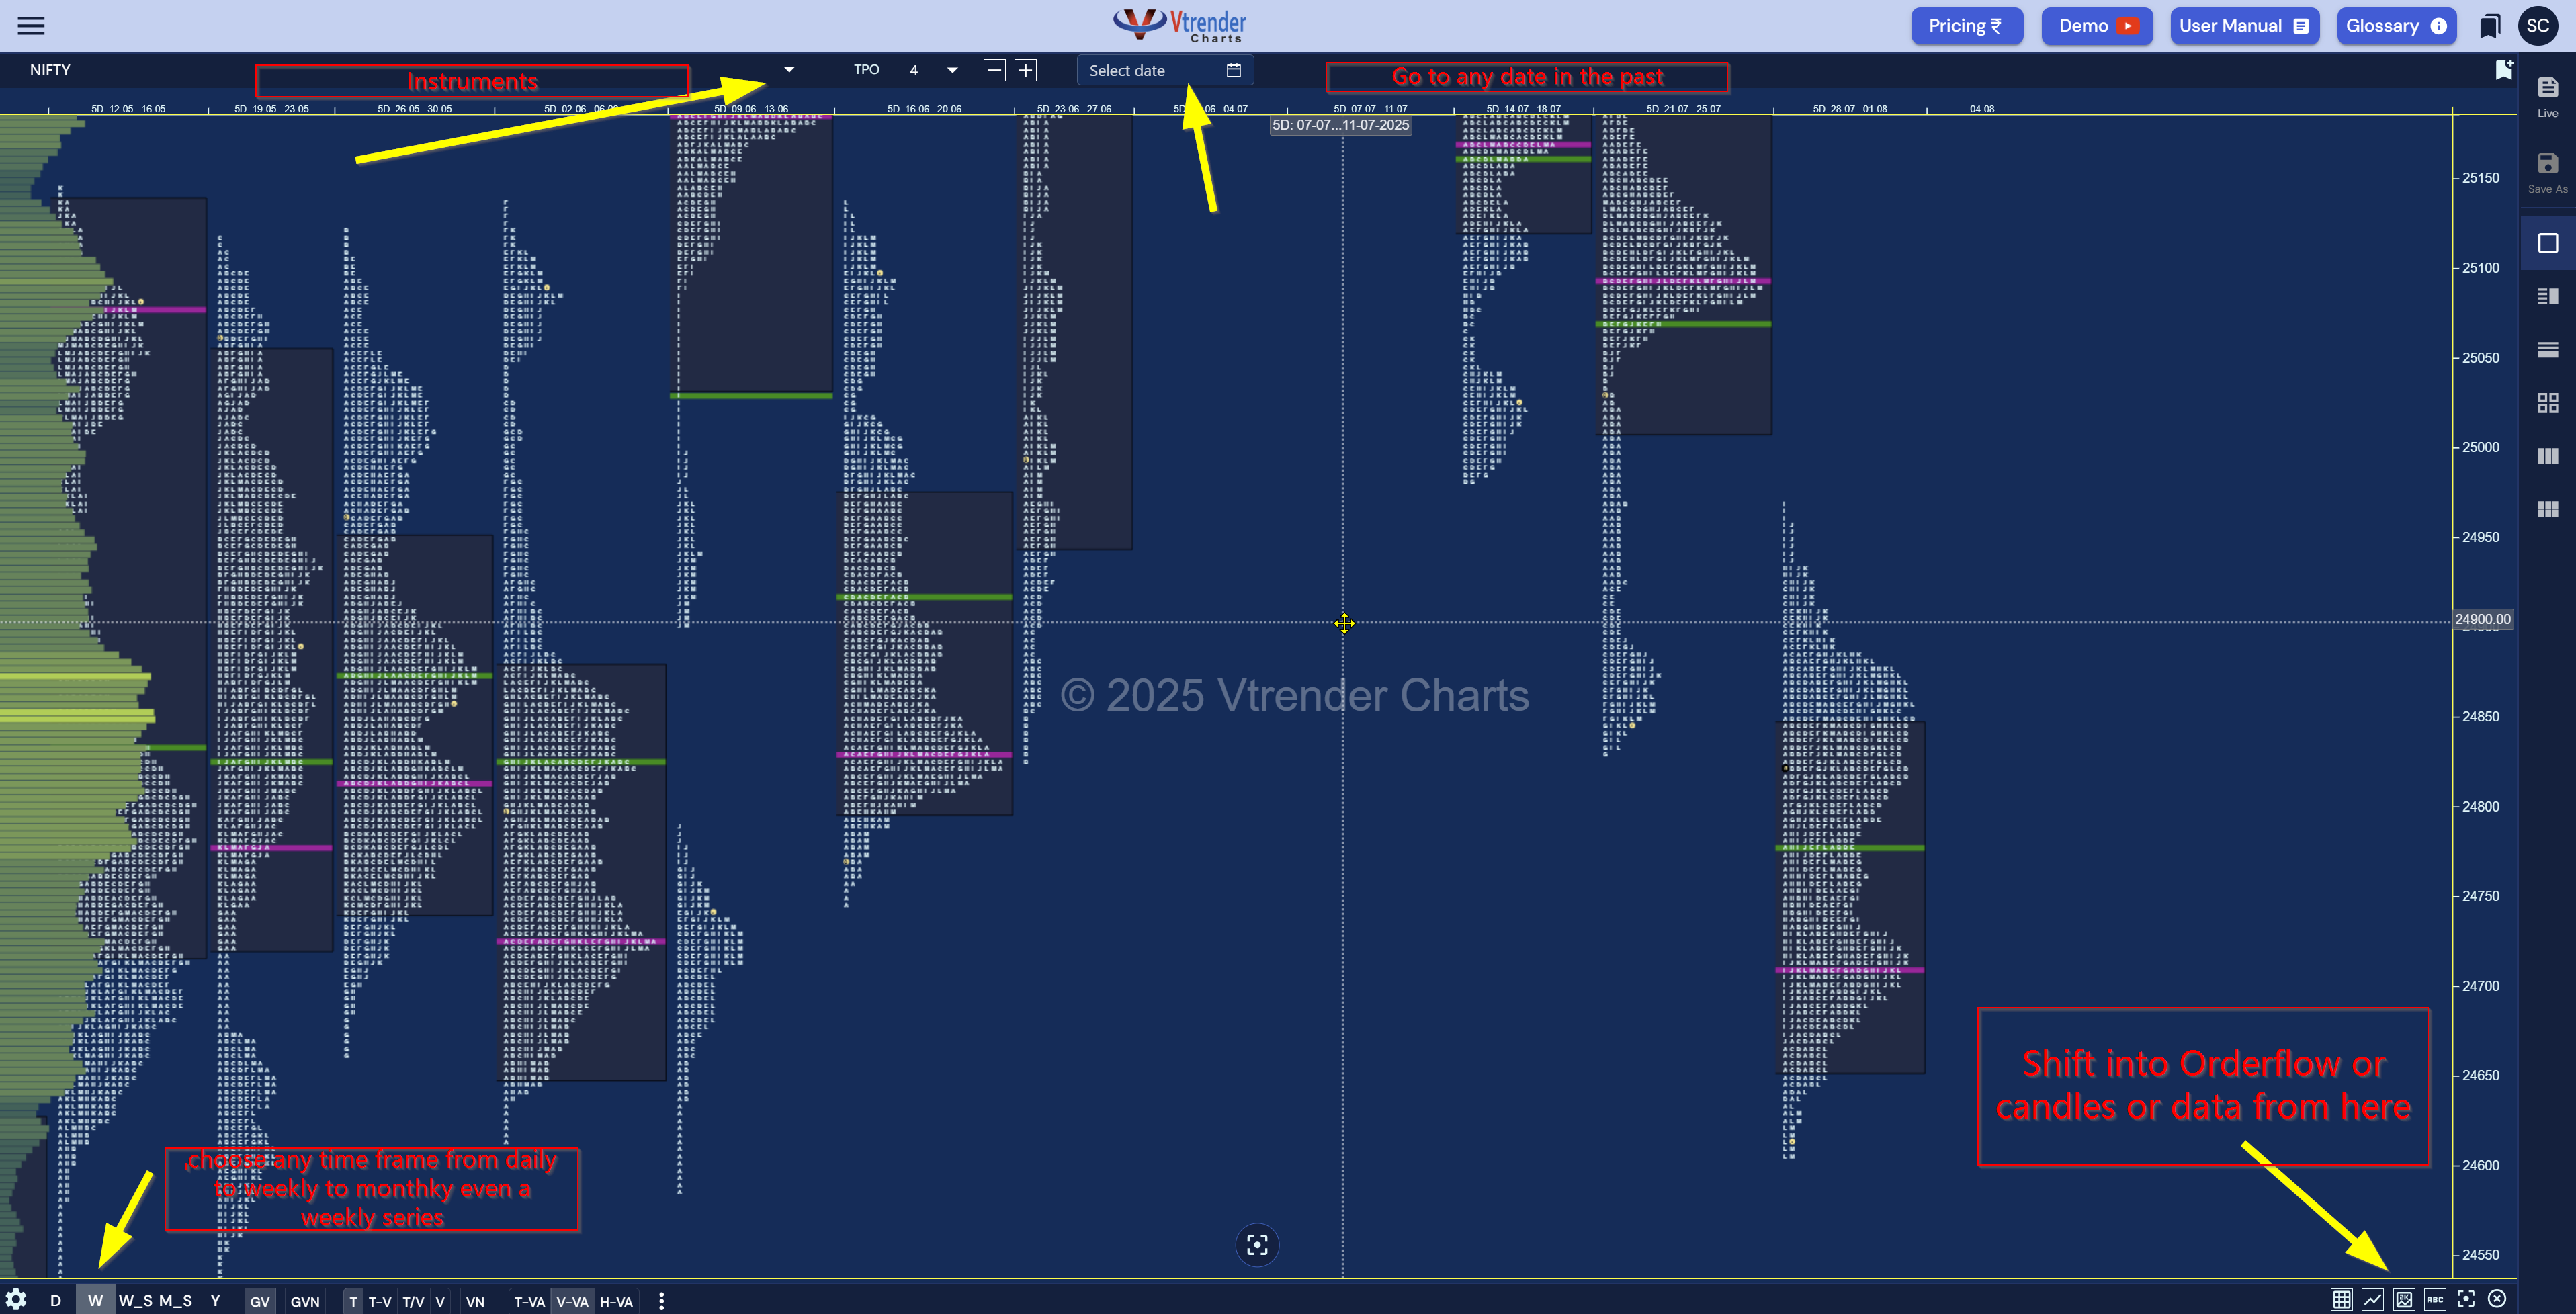
Why MarketProfile? Because the market is an auction. And every day, participants come in to determine value. MarketProfile maps that auction process, helping you identify: 🔹 Where buyers and sellers agree (value) 🔹 Where they don’t (imbalance, opportunity) 🔹 When the market is trending or balancing 🔹 Which levels have high conviction (POCs, singles, etc.) It's not a prediction tool. It’s a context tool.
Read More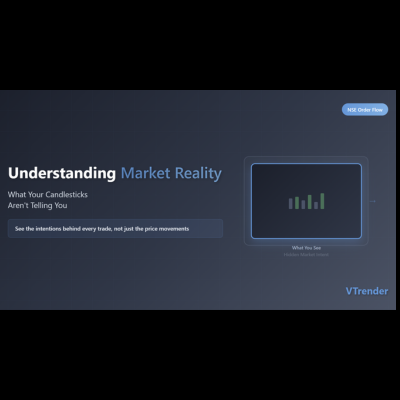
Why Look Inside the Bar? Most charting platforms show you what happened. Orderflow shows you who did it — and how aggressive they were. When you look at a Vtrender Orderflow chart, you're not just seeing red and green bars. You're stepping into the engine room of the market.
Read More