
Love Vtrender Charts? Check out our new offer!
In the fast-paced game of options trading, momentum is a fleeting visitor—and initiative activity, when spotted early, can make all the difference between a random scalp and a trade with conviction.
At Vtrender, we’ve built a candlestick view specifically for Option traders—one that helps you visually catch the pulse of initiative buying and selling.
And right at the center of that view is a concept we call MFLOW.
Let’s walk you through it, layer by layer.
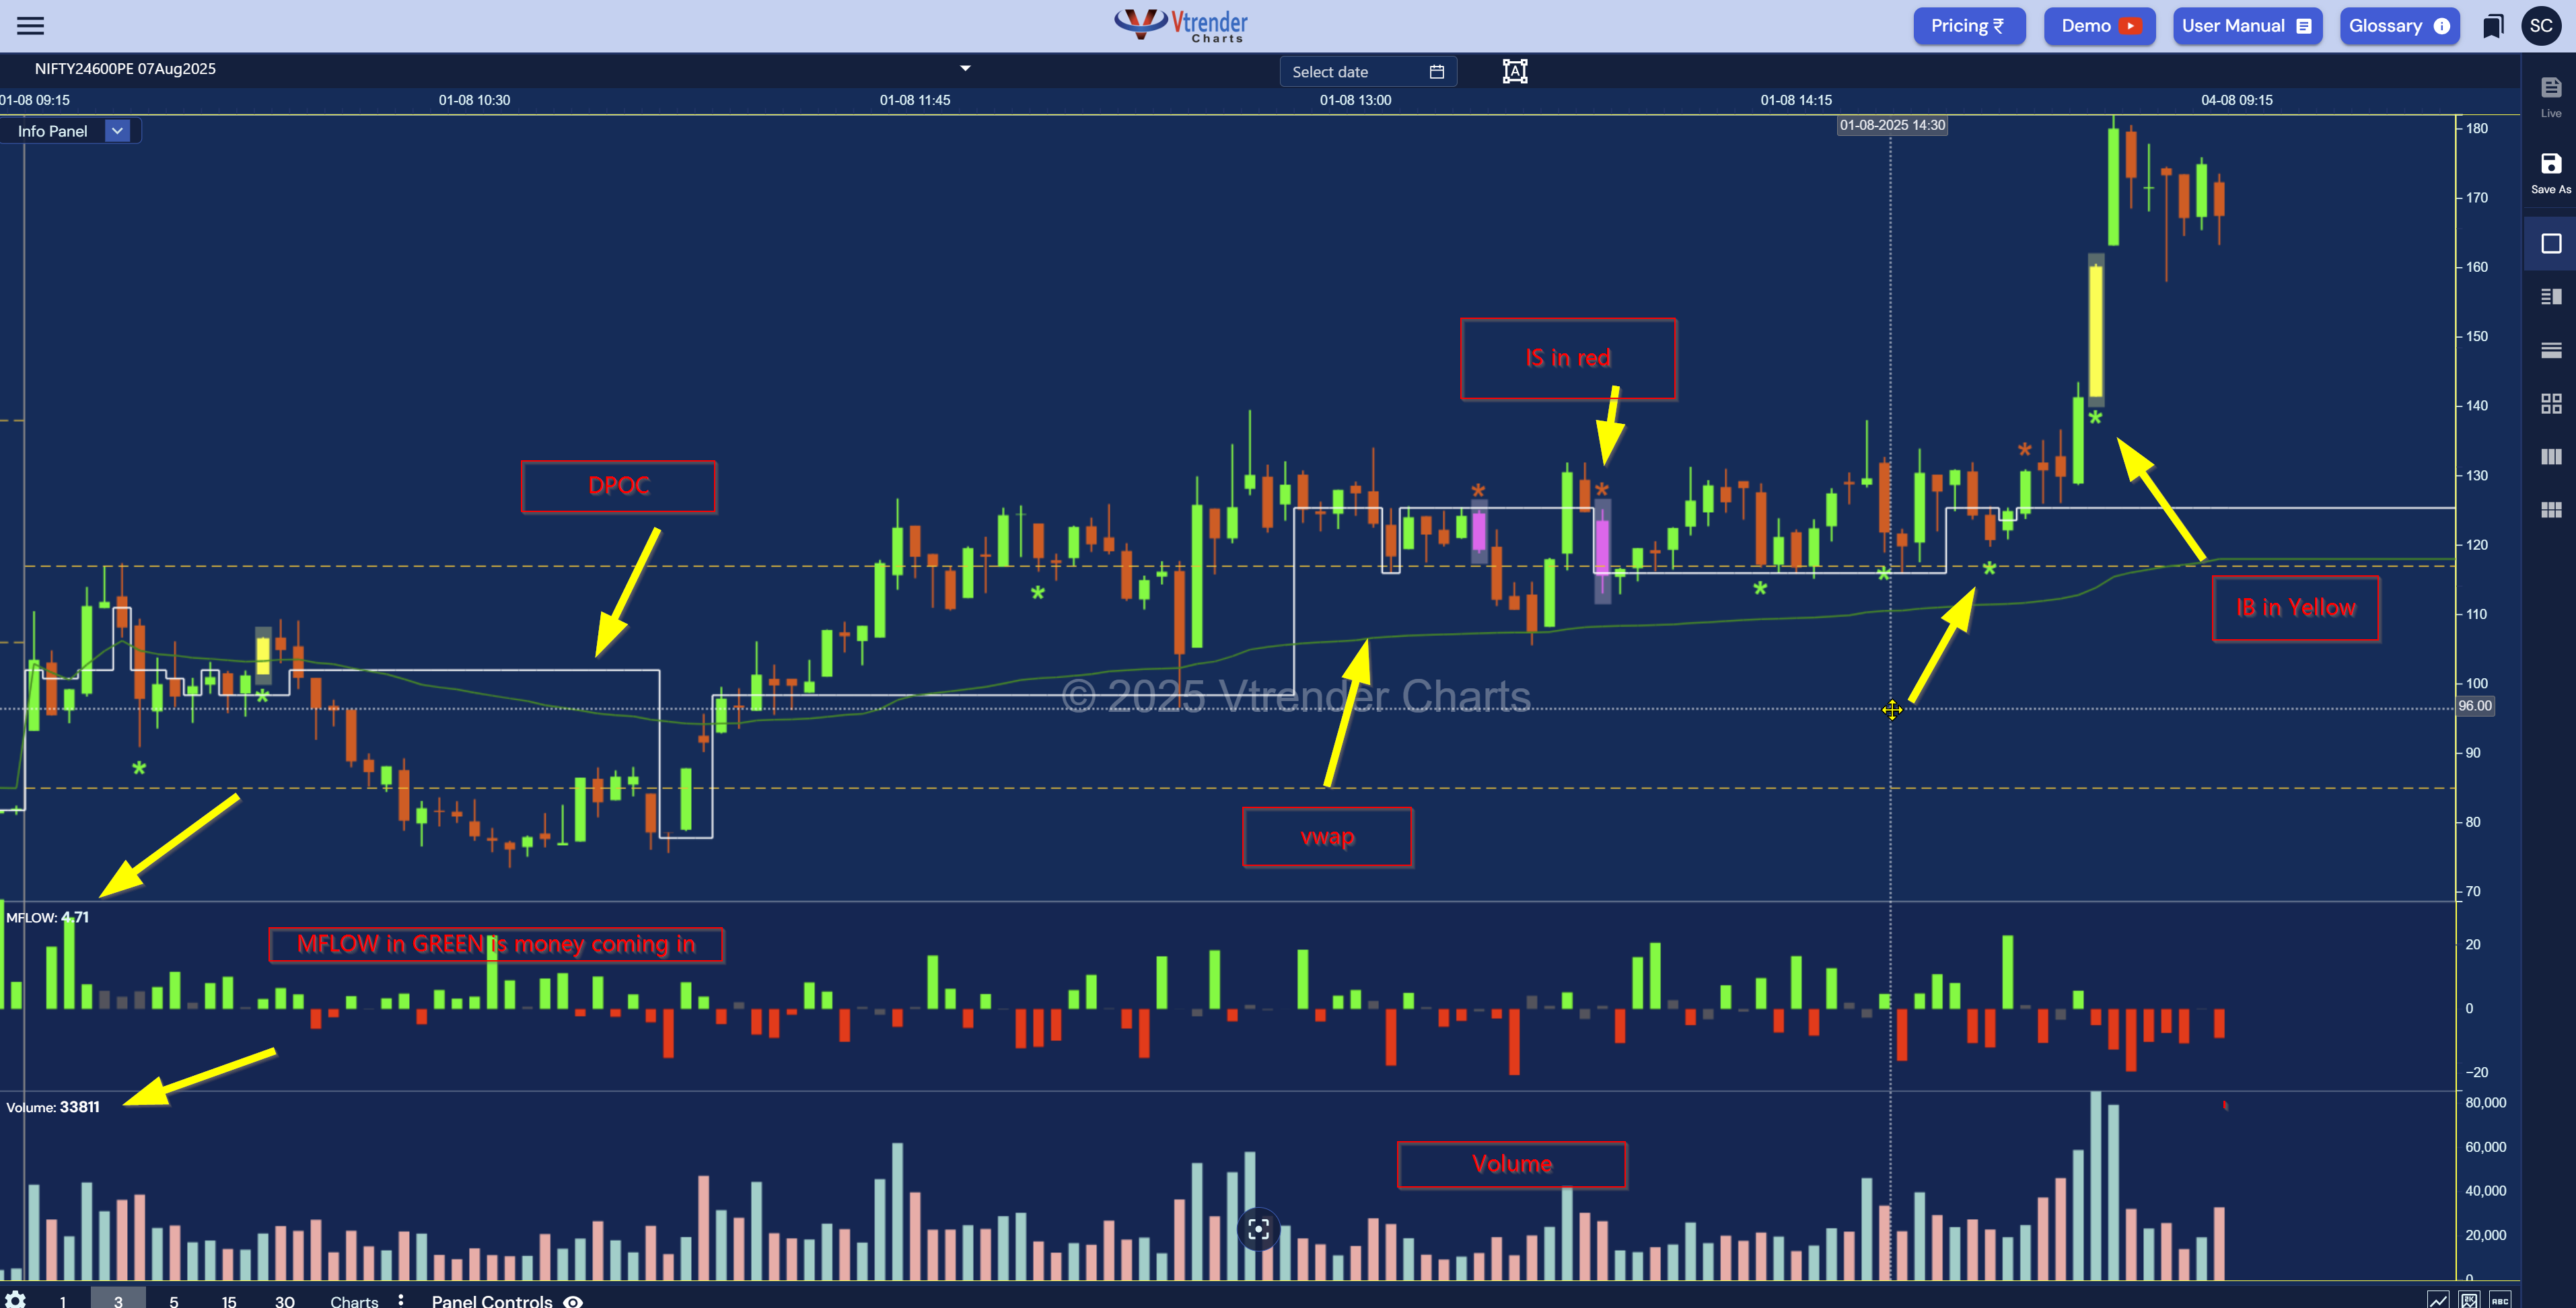
This chart you’re seeing isn’t your usual OHLC display.
It’s built for function, not flair—and every layer has a purpose:
🔸 VWAP Line: Your gravity reference. Traders anchored to price and average positioning.
🔸 DPOC Box: Developing Point of Control—where business is actually happening bar-by-bar.
🔸 Color-coded Initiative Bars: Red (Initiative Sellers), Yellow (Initiative Buyers).
🔸 Volume Panel (bottom): Total traded quantity bar-by-bar.
🔸 MFLOW Panel (middle): The heartbeat of money flow in and out, color-coded for clarity.
Let’s focus on that last bit.
MFLOW is our real-time indicator of money flow strength—a proprietary signal that tells you whether an instrument (typically an options strike) is attracting fresh participation or simply seeing churn from earlier positions.
Unlike regular volume, MFLOW is behavior-aware. It asks:
Is this volume a new buyer walking in with intent?
Or is this just old inventory getting squared off or exited?
Let’s bring in one of the best minds in MarketProfile—Jim Dalton.
Dalton famously classified volume as either:
Old Business: Positioning that is being unwound—squares, exits, stops.
New Business: Fresh initiative—market participants acting with purpose, building positions at new price levels.
This framework is crucial to interpreting intraday behavior.
In our charts, MFLOW in green = money coming in.
MFLOW in red = money leaving (demand waning, exits, or stop losses).
Now overlay that with the color-coded bars:
Yellow candles = Initiative Buying detected
Red candles = Initiative Selling detected
You’re now looking at a double-confirmation framework:
MFLOW expanding in green + yellow bar = High conviction long
MFLOW expanding in red + red bar = Panic exit or strong short flow
Add VWAP and DPOC to this, and you’re not just looking at price…
You're watching positioning evolve in real time.
This chart style is specifically optimized for Options like NIFTY24600PE (as seen above). Here's how traders can use it:
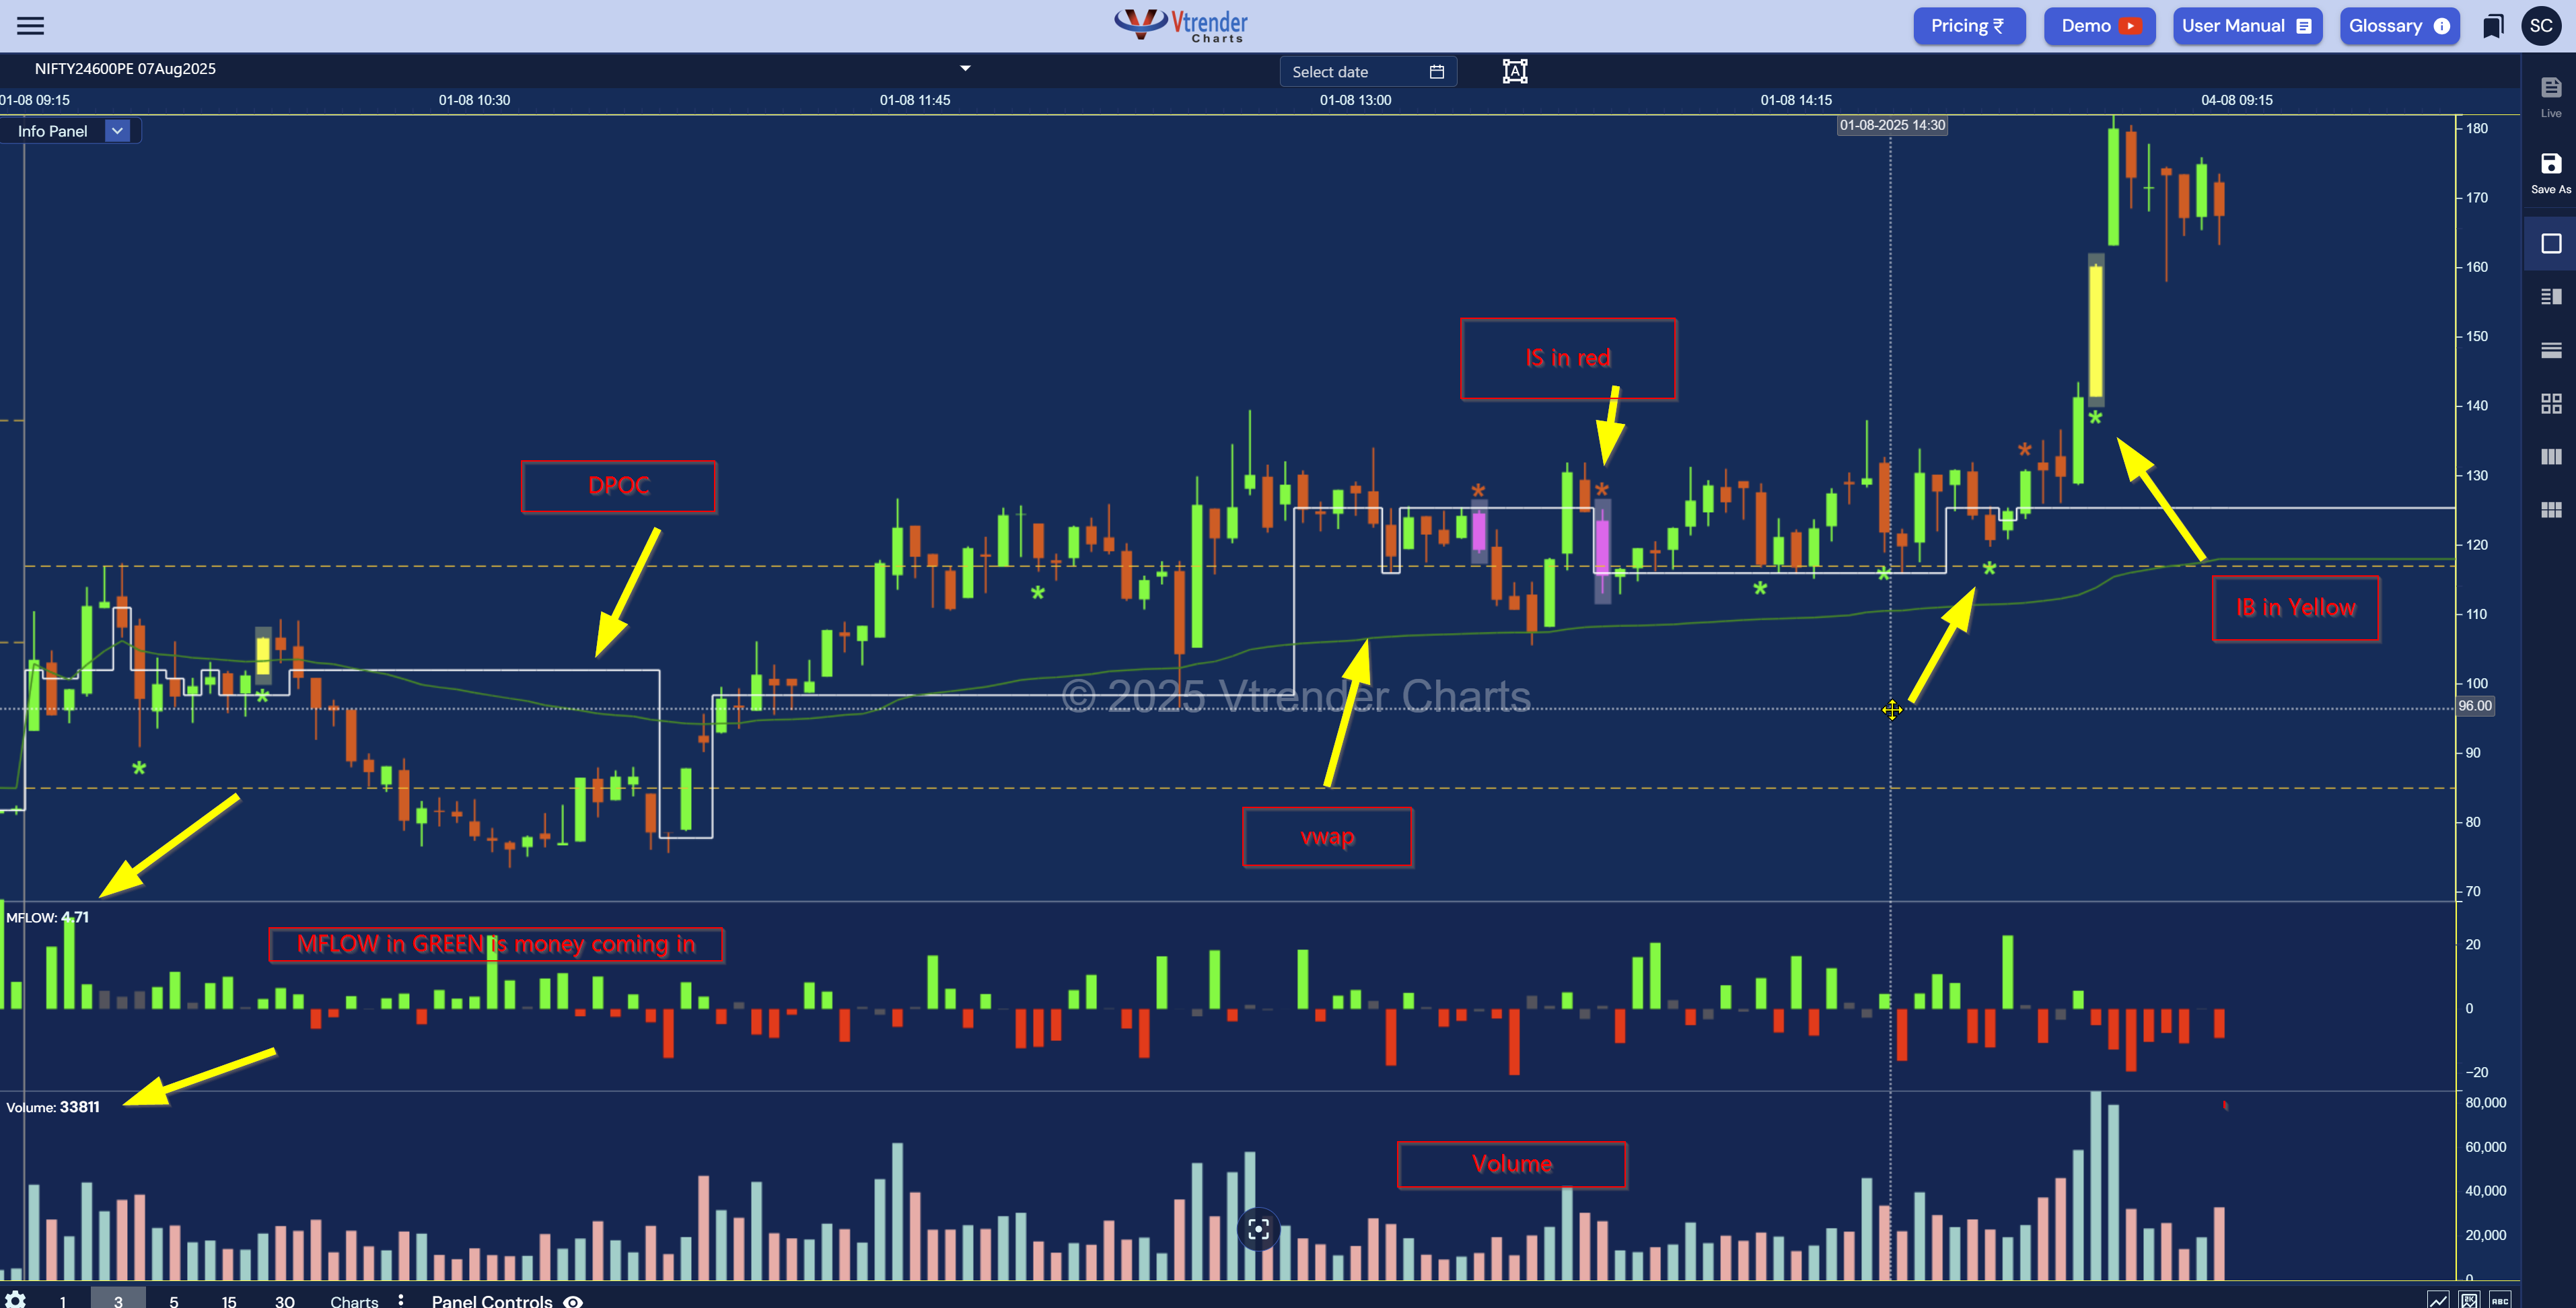
Notice how MFLOW flips green before the price candle takes off?
This tells you fresh money is coming in—often a precursor to momentum.
Combine this with a yellow IB (Initiative Buying) candle, and you have a potent signal.
Sometimes price rises… but MFLOW is red.
That’s a sign of old business being exited, not new positions being built.
Such moves often fade.
MFLOW keeps you from chasing these false rallies.
When price reclaims VWAP with green MFLOW bars and holds DPOC, we know control has shifted.
Buyers aren’t just lifting offers—they’re building territory.
This is what conviction looks like.
MFLOW picks up aggression before volume catches up.
It’s not just about how much was traded—but who initiated it.
Let’s break this down:
Around 13:00 hours, price breaks below VWAP. MFLOW dips red—exit of long positions likely.
Around 13:45–14:00, green MFLOW bars start appearing. Buyers are testing waters.
At ~14:15, we get a yellow bar + surge in MFLOW + reclaim of VWAP.
Within 2–3 bars, the strike explodes vertically from 120 to 180+.
This wasn’t luck.
It was initiative, spotted early.
You’ll find MFLOW charts across all active strikes in:
Just click on your instrument (e.g., NIFTY24600PE) and toggle into Candlestick View from the bottom-right corner.
You’ll instantly see:
VWAP and DPOC lines
Initiative Buying/Selling bars
MFLOW pane
Volume pane
No guesswork. Just structured clarity.
In an ocean of indicators that all say the same thing, MFLOW is different.
It focuses on behavior, not just math.
When you pair MFLOW with Vtrender’s DPOC + VWAP + Initiative Bar system, you don’t just watch charts—you understand market intent.
And when you understand intent, your decisions become sharper.
Explore More:

Markets don't move because indicators change.
Indicators change because markets move.
A practical reference for NSE & BSE derivatives traders. 366 pages, built to sit open beside live charts.