
Love Vtrender Charts? Check out our new offer!
Every trading day, there's a hidden war happening in the options market. It's not between bulls and bears. It's not between buyers and sellers. It's between those who understand gamma and those who don't. Today, you join the ranks of those who do.
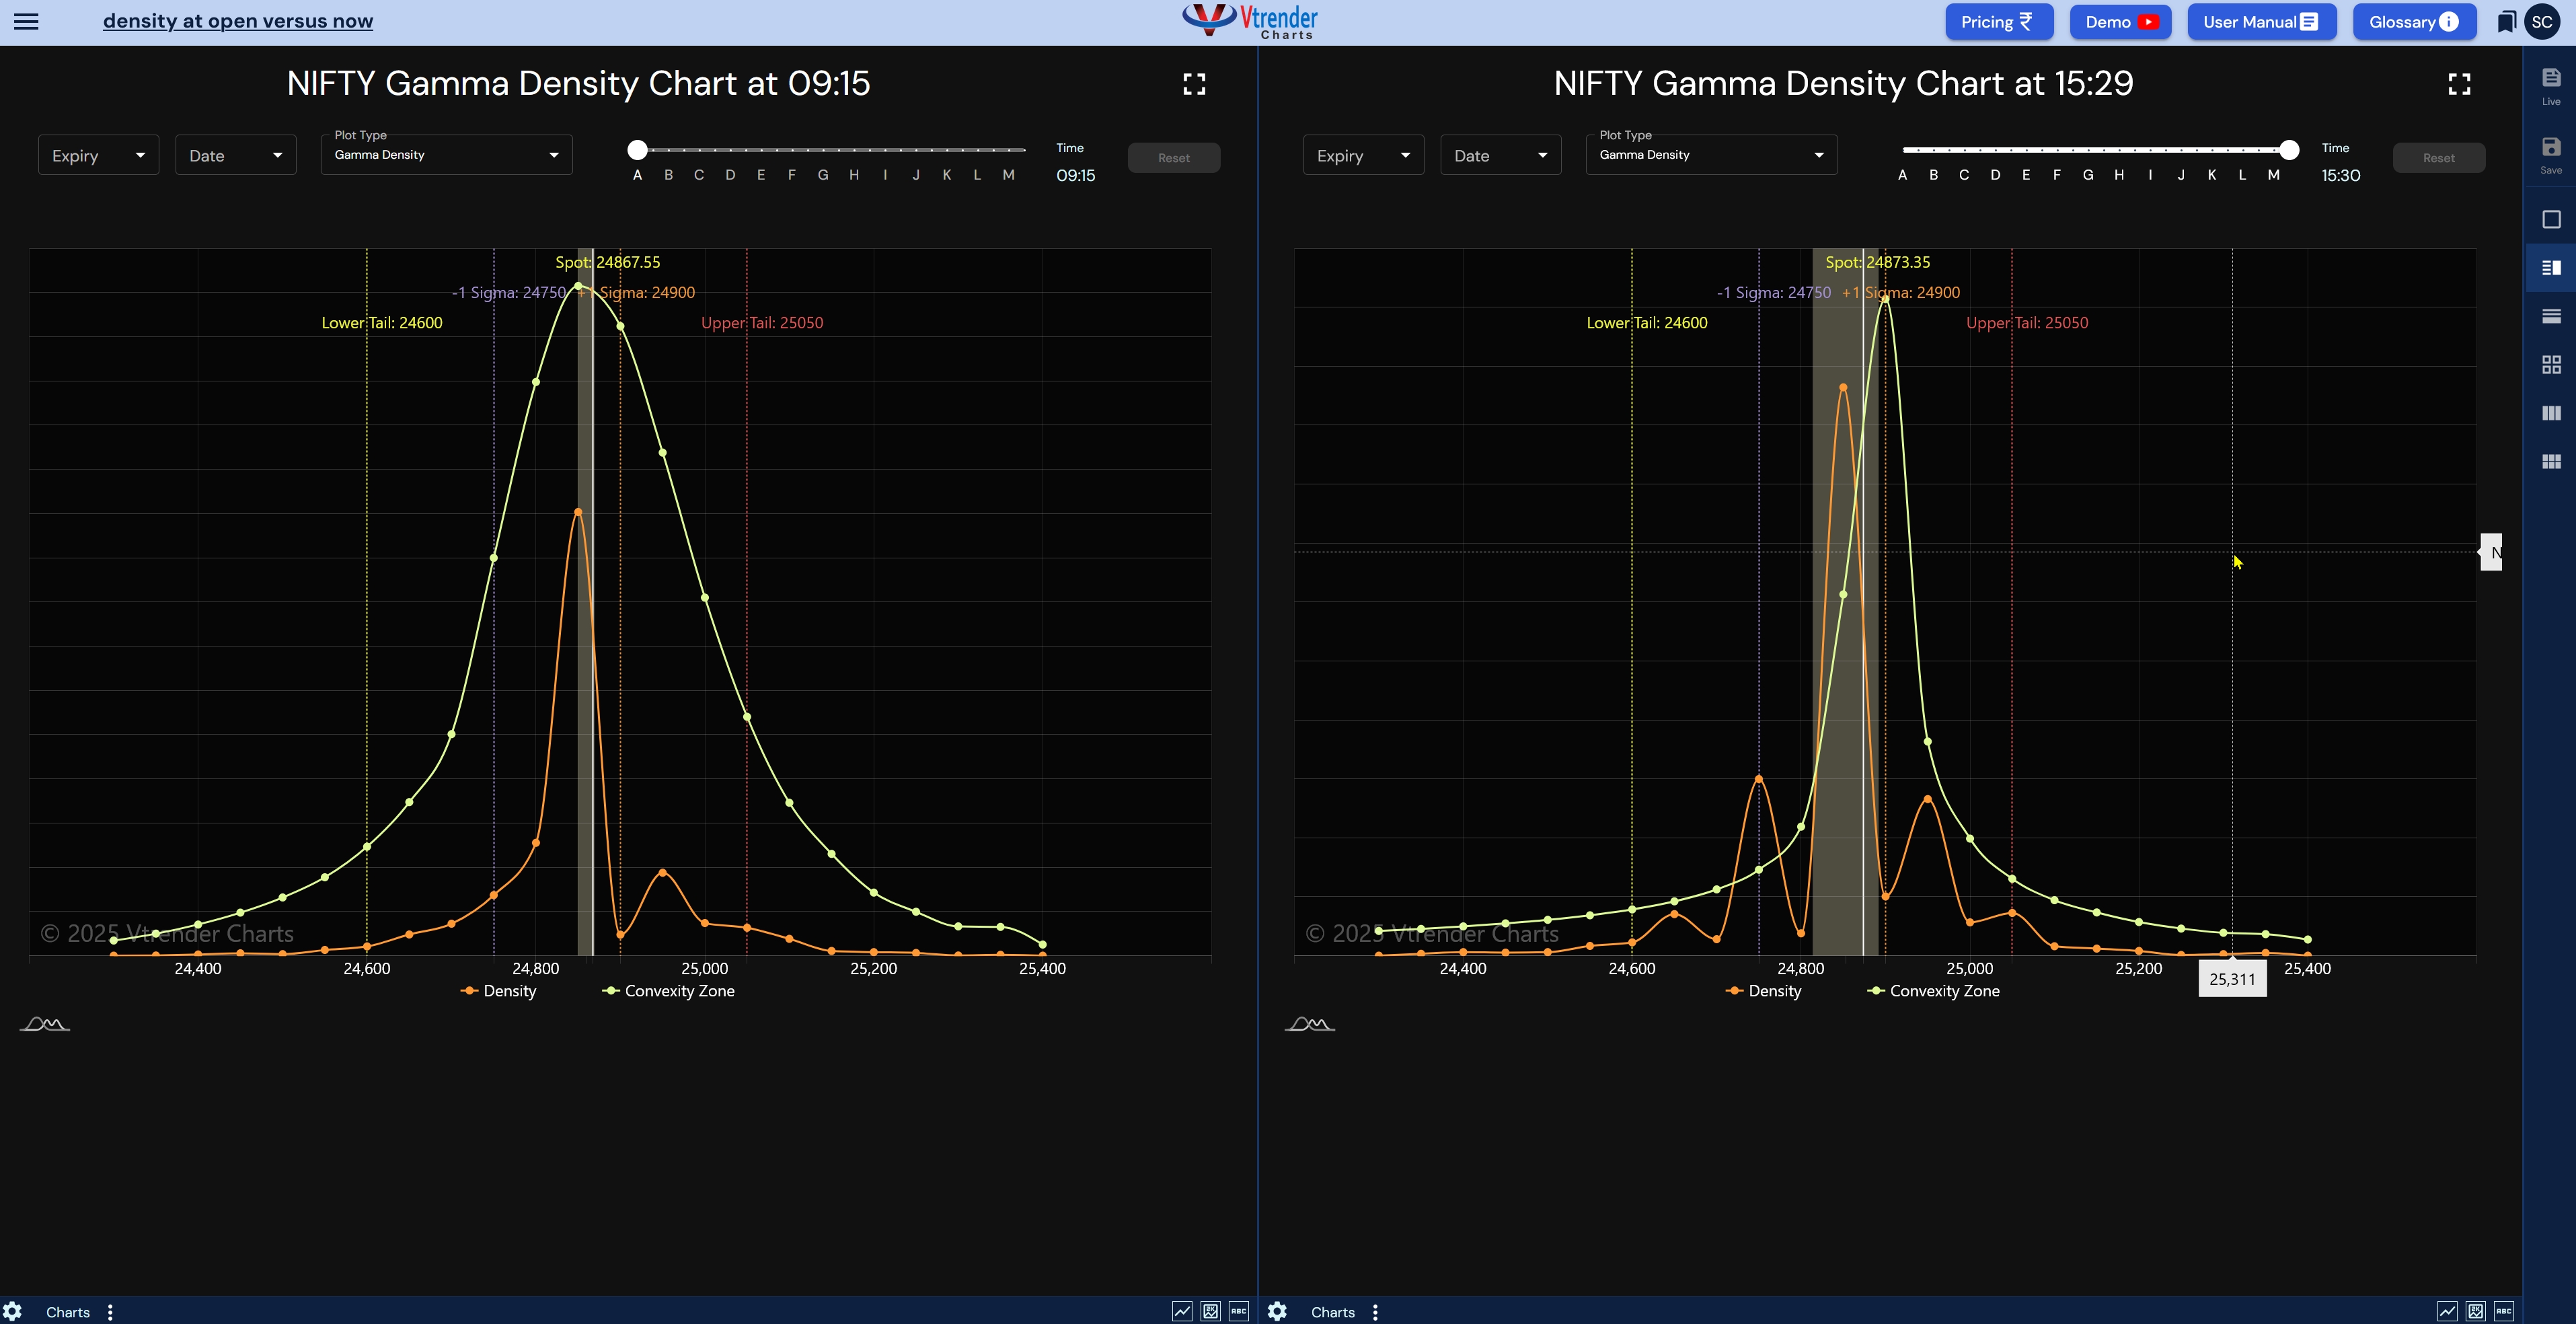
Look at the two snapshots of the NIFTY gamma density chart above – one from market open at 09:15 and another near close at 15:29.
What you're seeing isn't just lines and curves. You're seeing the battlefield where PROs and retail traders clash, where fortunes are made and lost, where the market's true direction is decided not by news or fundamentals, but by the invisible force called gamma.
But what exactly is gamma, and why should you care about its density?
Think of gamma as gravity. Just as gravity pulls objects toward earth, gamma pulls prices toward certain strike prices. The stronger the gravity, the harder it is for prices to escape. The denser the gamma, the more powerful this gravitational pull becomes.
Here's what happens in the real market: When PRO traders write (sell) options at a particular strike price, they create gamma. When thousands of options accumulate at the same strike, they create what we call gamma density – a concentration of gravitational force so powerful that it can hold the entire market hostage. They defend these levels. They hedge around these levels. They profit from keeping prices near these levels.
In our NSE market, unlike Western markets with designated market makers, this game is more raw, more real, more profitable for those who understand it. Here, it's PRO traders – the sophisticated institutional players – battling directly with retail and HNI traders. No middlemen. No obligations. Just pure strategic warfare.
A link to our previous writeup on density is at - https://vtrender.com/posts/introducing-the-gamma-density-chart-on-vtrender
Let's decode what these charts reveal about the battle. At market open (left chart), notice how the gamma density curve spreads wide like an open palm. The yellow line shows gamma distributed across multiple strikes from 24,400 to 25,400. This is the market in discovery mode – PROs are still setting their plans, retail traders are still placing their bets, and the day's narrative hasn't yet been written.
By market close (right chart), everything changes. The curve transforms into a sharp spike, a mountain peak centered at 24,900. This isn't random. This isn't luck. This is the PROs winning.
What happened during these six hours? The PROs identified 24,900 as their fortress. They sold massive quantities of options at this strike. They collected premium from other traders betting on movement. They then used their capital and futures positions to ensure prices stayed exactly where they wanted them. The spot price moved a mere 6 points all day – from 24,867 to 24,873 – despite thousands of trades, millions in volume, and countless attempts to break free.
This is the power of gamma density. It turns the market into a magnet, and that magnet sits exactly where the smart money places it.
Every options expiry follows three immutable laws, and understanding them through gamma density charts gives you an edge most traders never achieve.
First, there's concentration. Where gamma concentrates, prices gravitate. It's not a suggestion; it's a mathematical certainty. The PROs know this. They use this. They profit from this.
In our chart, watch how the scattered morning gamma coalesced into that sharp 24,900 spike. This is calculated positioning by traders who understand that concentration equals control.
Second, there's convexity. The yellow line on our chart shows the convexity zone – think of it as the battlefield's front line. When prices approach these zones, hedging activity explodes. PROs must buy when prices rise, sell when prices fall. This creates the whipsaw action that frustrates retail traders but enriches those who understand the game. Notice how the convexity zone became more jagged, more fractured as the day progressed. Each peak represents a strike where PROs are vulnerable, where coordinated retail action could force covering, where the tables could turn.
Third, there's time decay. Every minute that passes with prices pinned near high gamma strikes, option sellers profit and option buyers lose. The graph shows not just where prices are, but where they're likely to stay. Time becomes the PRO trader's greatest ally and the uninformed retail trader's silent enemy. Those six hours between our two snapshots? That's six hours of theta decay, six hours of premium erosion, six hours of profits flowing from the impatient to the patient.
Understanding how PROs use gamma density transforms you from prey to predator. Here's their strategy, laid bare through our chart analysis.
PROs don't randomly sell options. They identify key psychological levels – round numbers like 24,900, previous highs and lows, technical support and resistance. They concentrate their selling at these strikes, creating gamma walls that become self-fulfilling prophecies. They know retail traders buy options hoping for big moves. They know these traders usually buy short-dated options that decay rapidly. They know patience and capital win this game.
Look at the 1 Sigma level marked on both charts – holding steady at 24,740. This represents one standard deviation of expected movement. PROs use this as their risk boundary. They'll defend positions aggressively within this range but may abandon ship if prices break beyond it. Understanding these boundaries tells you when PROs are comfortable and when they're vulnerable.
The "Lower Tail" and "Upper Tail" markers at 24,600 and 25,050? These aren't arbitrary. They represent the absolute limits of PRO comfort. Beyond these levels, their hedging costs explode, their risks multiply, and their controlled game becomes chaotic. Smart retail traders note these levels. They know that if prices can be pushed beyond these boundaries, PROs must cover, creating the explosive moves that turn small bets into massive wins.
Now that you see what PROs see, you can trade like they trade – or better yet, trade against their positions when they're vulnerable.
When gamma density concentrates at a single strike, like our 24,900 example, you have three choices. You can join the PROs by selling spreads around this level, collecting premium while prices remain pinned. You can wait for the concentration to break, then ride the explosive move that follows. Or you can identify the next concentration level and position yourself before the crowd arrives.
When gamma density spreads across multiple strikes, opportunity multiplies. This usually happens early in the series or during uncertain markets. PROs haven't yet committed to defending specific levels. Prices can trend. Breakouts can sustain. Directional trades work. The morning chart shows this perfectly – broad distribution meant freedom of movement, opportunity for the nimble trader.
When gamma density shifts rapidly, as it did between our two snapshots, you're witnessing PRO positioning in real-time. They're telling you exactly where they expect prices to settle. Follow their lead or fade their positions, but never ignore their message. The transformation from scattered morning gamma to concentrated afternoon gamma? That's PROs broadcasting their expiry target to anyone smart enough to listen.
Here's what PROs don't want you to know: their greatest strength is also their greatest weakness. When they concentrate gamma at specific strikes, they must defend these levels. They have no choice. Their hedging obligations force their hand.
Retail traders, especially when acting in coordination through similar analysis, can exploit this. Identify where gamma concentrates. Recognize that PROs must buy futures when prices rise toward these levels and sell when prices fall. Time your trades to force their hand. Buy calls when prices approach from below, forcing PRO hedge buying that pushes prices higher. Buy puts when approaching from above, forcing the opposite.
The multi-peaked convexity zone in our closing chart reveals another secret. PROs are spread thin, defending multiple strikes. They're vulnerable to coordinated attacks. Pick the weakest point – usually the strike with highest gamma that's furthest from spot price – and concentrate your firepower there.
Remember: in NSE markets, there are no market makers obligated to provide liquidity. When PROs are overwhelmed, they can and will abandon positions. This creates the violent moves that option buyers dream of. Your job is to identify when PROs are overconfident, overexposed, and underprepared for coordinated retail action.
Every expiry tells the same story with different numbers. PROs accumulate positions where they expect to profit. They create gamma concentrations that become price magnets. They use their capital advantage to pin prices and collect premium. But they're not invincible.
Gamma density charts reveal their playbook in real-time. You see where they're strong and where they're vulnerable. You understand why prices stick at certain levels and explode through others. You recognize the difference between noise and signal, between random movement and strategic positioning.
The next time you trade options, don't just look at prices. Look at gamma density. See the invisible forces that truly control market movement. Understand that every tick, every trade, every moment is part of a larger game between those who write options and those who buy them.
The chart above isn't just a snapshot of one day's action. It's a masterclass in market mechanics, a window into professional positioning, a roadmap to profitable trading. The PROs have used this knowledge to profit from retail traders for years.
Today, you level the playing field. Today, you see what they see. Today, you trade with the power of understanding, not the weakness of hope.
Welcome to the world of gamma density trading.
The battlefield is clear. The weapons are understood. The only question remaining is: will you be the hunter or the hunted?

Markets don't move because indicators change.
Indicators change because markets move.
A practical reference for NSE & BSE derivatives traders. 366 pages, built to sit open beside live charts.