
Love Vtrender Charts? Check out our new offer!
Every revolution starts with a simple realization: what we see isn't what's real. The price charts you watch, the candles you analyze, the patterns you trade – they're all shadows on the wall. The real game happens in the invisible realm of gamma, where PRO traders wage war with retail positions, where prices get magnetically pulled to certain strikes, where the market's true intentions are written.
Today, Vtrender Charts tears down that wall.
We're not just launching a feature. We're not just adding another indicator. We're fundamentally changing how you see the market. Welcome to Gamma Density – your x-ray vision into the derivatives battlefield.
Gamma Density is a visual representation of where gamma exposure is concentrated across strikes. Instead of showing gamma strike-by-strike as in a traditional option chain, we now show a smooth, probabilistic curve — one that lets you interpret:
Where gamma is peaking (zones of hedging sensitivity)
Where tails are forming (zones where price may "slip")
How the market is positioned from a hedging perspective
Probabilistic range via ±1 Sigma bands AND TAILS
Think of it as an x-ray of market fragility and strength.
For too long, derivatives traders have been fighting with primitive tools in a sophisticated war. You've had option chains that show strike-by-strike data like reading a phone book. You've had Greeks calculators that spit out numbers without context. You've had implied volatility that tells you what might happen, not what will happen.
But here's what you haven't had: a real-time visual map of where the market's pressure points lie. A way to see where PROs are defending their positions. A method to identify where price will stick and where it will slip. Until now.
The truth is simple yet profound: while you've been watching price action, institutional traders have been watching gamma exposure. They know where the hedging happens. They know where the acceleration begins. They know where the market becomes unstable. This knowledge gap has cost retail traders crores in losses.
Not anymore. Not on our watch. Not with Gamma Density.
Let’s break down the key components of the chart shown for the NIFTY:
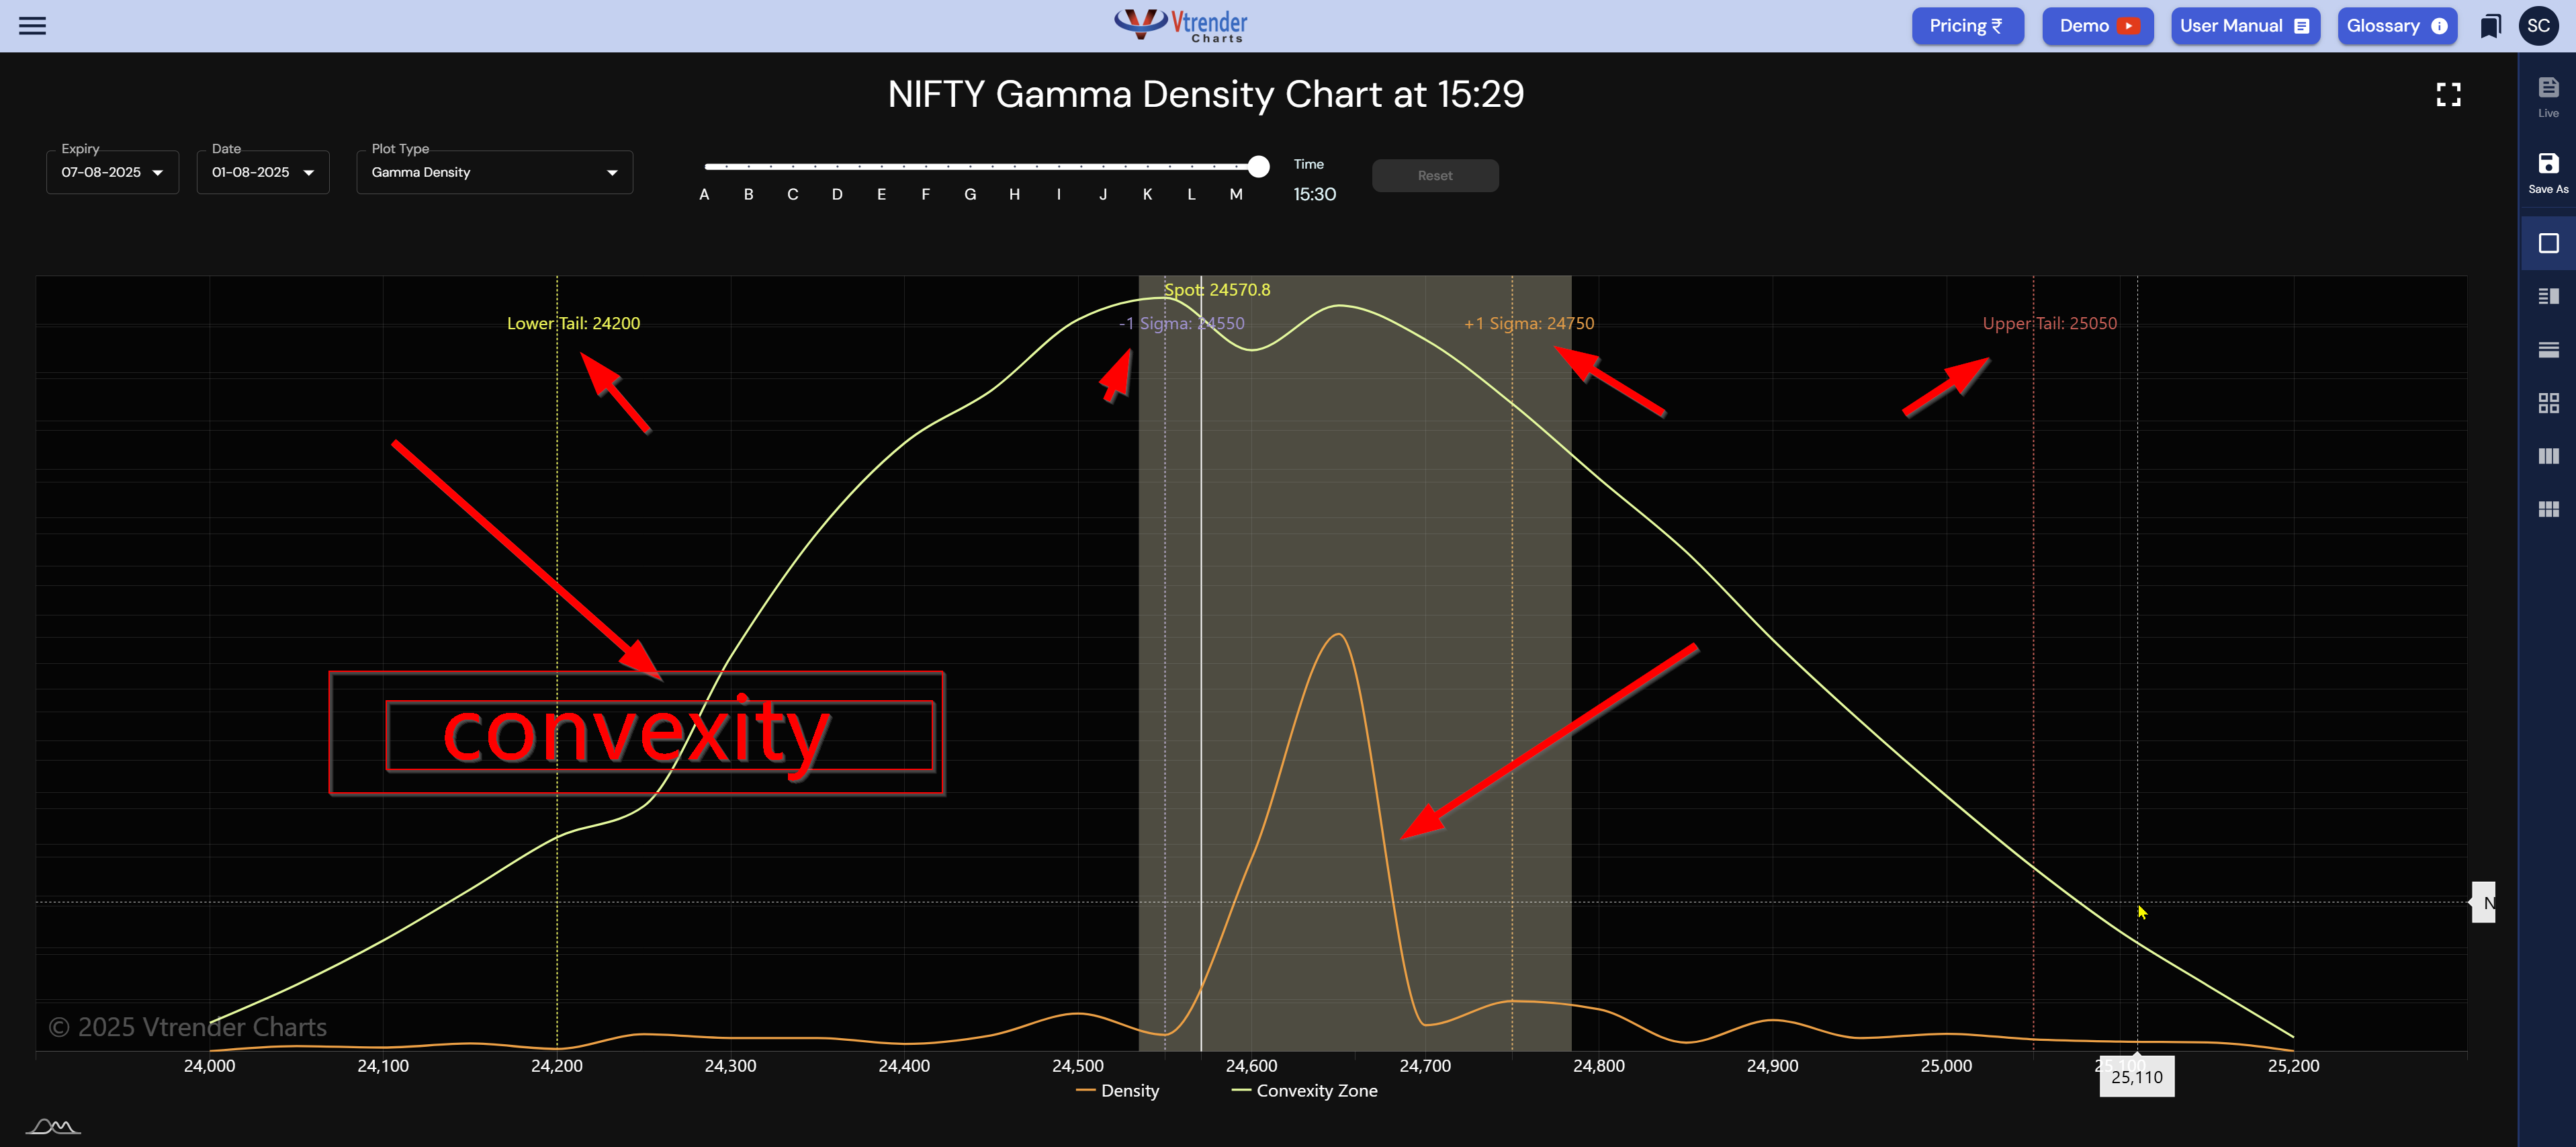
Gamma Density Curve (Yellow Line)
This is the smoothed gamma exposure across strikes. It reveals where option positions are exerting the most hedging force.
Spot Marker
In this example, the spot is at 24570.8 — right between the gamma peak and the upper tail. This helps us anchor our expectations.
Sigma Levels
-1 Sigma at 24550
+1 Sigma at 24750
These represent one standard deviation movement zones, based on gamma risk. Think of them as dynamic expected move bands.
Lower Tail
The Lower Tail at 24200 marks the boundary where gamma exposure sharply drops off. This is where the market becomes "slippery" — and you can expect faster, less controlled moves.
Shaded Distribution (Day Range)
This shows the range traded today and how the market responded. You can use the time filter at the top and go back 15 or 30 minutes to check how "adjustments" were done
Imagine having thermal vision in a dark room while everyone else uses flashlights. That's what Gamma Density gives you. Instead of showing gamma strike-by-strike like a spreadsheet, we've created a smooth, probabilistic curve that reveals the market's hidden architecture in real-time.
First, there's Control versus Chaos. Markets with high gamma concentration are like heavy pendulums – they resist movement and return to center. PROs defend these levels through hedging, creating stability that frustrates breakout traders but rewards premium sellers. Markets with low gamma are like leaves in the wind – they move violently on the slightest provocation. Gamma Density shows you which market you're in, right now, at this moment.
Second, there's Magnetic Pinning. When gamma peaks near spot price, you've found the market's center of gravity. This isn't resistance or support in the traditional sense – it's a mathematical certainty that price will struggle to escape. PROs aren't hoping price stays here; they're ensuring it does through systematic hedging. Understanding these pin zones transforms how you approach expiry days.
Third, there's Acceleration Identification. The tails aren't just boundaries – they're launch pads. When price approaches tail zones, the market's governing dynamics change. Hedging that was suppressing movement suddenly amplifies it. What was stable becomes volatile. What was predictable becomes explosive. Knowing these zones lets you position for the moves others never see coming.
This is practical warfare intelligence you can use right now.
For Intraday Range Planning: Those Sigma bands become your tactical boundaries. Price repeatedly testing +1 Sigma without breaking? That's not just resistance – that's PROs defending their positions. Set up your mean reversion trades with confidence. Price slicing through -1 Sigma like butter? That's not just support breaking – that's gamma support evaporating. Trail your stops and ride the wave.
For Breakout Identification: Forget traditional breakout patterns. When price enters tail zones with gamma density shifting, you're witnessing the market's defense mechanisms failing. These aren't false breakouts that reverse immediately. These are structural breaks that accelerate. Position your straddles here. Place your directional bets here. Make your fortunes here.
For Risk Management: Gamma Density isn't just about finding opportunities – it's about avoiding disasters. Trading in high gamma zones? You can afford larger positions because the market is stable. Venturing into tail zones? Cut your size or hedge aggressively because volatility is about to explode. Let gamma density guide your position sizing, not your gut feeling.
And Gamma Density isn’t static. It updates with time, expiry, and position changes — which means you're always looking at today's probabilities, not yesterday’s or any previous data.
This like our Orderflow charts is all about living in the NOW
We've added:
Time-slider for intraday reference
Expiry filters
Plot type toggles (Gamma sum, gamma split, writer's cash and more )
Visual spot anchoring (LIVE)
This means you can go back in time and study historical hedging behavior around key market events. Or watch the live gamma shifts — minute by minute.
For scalpers, it provides probabilistic context for every trade. For option writers, it reveals safe zones for premium collection. For directional traders, it identifies where moves will accelerate. For students of market structure, it's the missing piece that connects price action to positioning.
But perhaps most importantly, for retail traders who've been disadvantaged by information asymmetry, it levels the playing field. You now see what PROs see. You now know what institutions know. You now trade with intelligence, not hope.
This introduction only scratches the surface. We've recently published a comprehensive analysis showing exactly how PROs used gamma density to control NIFTY's expiry, pinning it precisely at 24,900 despite thousands of retail traders betting otherwise.
Read "The Future Is Written in Gamma" – our deep-dive analysis that reveals:
How PROs trapped price at exactly 24,900 using gamma concentration
Why the market moved only 6 points despite massive volume
The exact tactics PROs use to defend their positions
How retail traders can fight back or profit alongside
Price shows you the result. Volume shows you the participation. But Gamma Density shows you the reason. It reveals why prices stick where they stick, why moves accelerate where they accelerate, why the market behaves as it does.
With Gamma Density, you're no longer reacting to shadows on the wall. You're seeing the fire that casts them. You're understanding the machinery behind the movement. You're trading with intelligence that was previously reserved for the elite.
Access Gamma Density Now: Available for all Expert and Elite members at charts.vtrender.com. Select "Gamma Density" from the menu, choose your expiry and timeframe, and witness the market's hidden architecture.
New to Vtrender Charts? Start your journey here: https://vtrender.com/live-charts
The battlefield is no longer hidden. The weapons are no longer secret. The advantage is no longer theirs alone.
Welcome to the revolution. Welcome to Gamma Density. Welcome to trading with your eyes truly open.
We’re not done. This is just the beginning of a larger plan to:
watch this space...
And yes — we’re also working on a feature that allows you to overlay your trades for post-trade journaling and learning. Check the Payoff charts menu.
Remember: They've been using this knowledge against you for years. Today, you join their ranks. Tomorrow, you might even beat them at their own game.
Gamma Density is now live for all Expert and Elite users at charts.vtrender.com. Just select "Gamma Density" from the Menu dropdown, pick your expiry and time, and explore the market's hidden map.
Ready to go deeper?
Log in. Pick a date. Watch how the curve moves. And start trading with context.
If you do not have Charts start here - https://vtrender.com/live-charts

Markets don't move because indicators change.
Indicators change because markets move.
A practical reference for NSE & BSE derivatives traders. 366 pages, built to sit open beside live charts.